iPhone 7 Display Technology Shoot-Out
iPhone 6 and
iPhone 7
Dr. Raymond M. Soneira
President, DisplayMate Technologies
Corporation
Copyright © 1990-2016 by DisplayMate
Technologies Corporation. All Rights Reserved.
This article, or any part
thereof, may not be copied, reproduced, mirrored, distributed or incorporated
into any other work without
the prior written permission of DisplayMate Technologies Corporation
Introduction
The key element for a great
Smartphone has always been a truly innovative and top performing display, and
the best leading edge Smartphones have always flaunted their super high tech
displays. It is the display performance that determines how good and how
beautiful everything on the Smartphone looks, including camera photos, and also
how readable and how usable the screen is in high ambient lighting. The display
is the crown jewel of the Smartphone!
At first glance the iPhone 7 looks almost indistinguishable from the
2014 iPhone 6 and 2015 iPhone 6s. Actually, the displays are the same size and
have the same pixel resolution. But that is as far as it goes... The iPhone 7
display is a Truly Impressive major enhancement and advancement on the iPhone 6
display... and even every other mobile LCD display that we have ever tested...
note that I hand out compliments on displays very carefully. And for
those of you thinking of Emailing that we got hand-picked units, the iPhones
were purchased retail from Verizon Wireless.
What’s New
Below are just a few of the most important and interesting display
enhancements and improvements on the iPhone 7 that we’ll cover in detail in
this article:
• The iPhone
7 has Two Standard Color Gamuts, the new DCI-P3 Wide Color Gamut that is used in 4K UHD TVs and
Digital Cinema, and also the traditional smaller sRGB
/ Rec.709 Color Gamut that is used for producing most existing consumer content for digital cameras, TVs,
the internet, and computers, including photos, videos, and movies. What’s more,
on the iPhone 7 both Color Gamuts have been implemented with Absolute Color
Accuracy that is Visually Indistinguishable from
Perfect. That’s impressive... Plus only three manufacturers currently
have the new wider DCI-P3 Color Gamut on their Smartphones or Tablets, so it is
a major competitive advantage. Other manufacturers will need to play catch-up
fast...
• The iPhone
7 produces up to an impressive Peak Brightness of 705
nits when Automatic Brightness is turned On in High Ambient Light, where
high Brightness is really needed.
• The iPhone
7 has a record high Contrast Ratio for IPS LCD displays.
• The iPhone
7 has a record low screen Reflectance for Smartphones.
• Given the
exceptional performance of the iPhone 7 LCD display, there will be many
consumers, journalists, reviewers, and even manufacturers wondering if Apple
will actually be switching to OLED iPhone displays in 2017, as has been widely
reported. We’ll examine this in the Conclusion.
We’ll cover all of these issues and much more, with in-depth comprehensive
display tests, measurements and analysis that you will find nowhere else.
The Display Shoot-Out
To examine the
performance of the iPhone 6 and iPhone 7 displays we ran our in-depth series of Mobile Display Technology
Shoot-Out Lab tests and measurements in order to determine how these latest
LCD Smartphone displays have improved. We take display quality very seriously
and provide in-depth objective analysis based on detailed laboratory tests and
measurements and extensive viewing tests with both test patterns, test images
and test photos. To see how far mobile displays have progressed in just six
years see our 2010
Smartphone Display Shoot-Out, and for a real history lesson see our
original 2006
Smartphone Display Shoot-Out.
Results Highlights
In this Results section we provide Highlights of the
comprehensive DisplayMate Lab tests and measurements and extensive visual
comparisons using test photos, test images, and test patterns that are covered
in the advanced sections. The main Display
Shoot-Out Comparison Table summarizes the iPhone 6
and iPhone 7 Lab measurements in the following
categories: Screen
Reflections, Brightness
and Contrast, Colors
and Intensities, Viewing
Angles, LCD
Spectra, Display
Power. You can also skip these Highlights and go directly to the iPhone 7 Conclusions.
Overview
In this Highlights section we will just focus on the new
performance capabilities and features of the iPhone 7.
For additional background information see our iPad Pro 9.7 Display
Technology Shoot-Out, which has a similar high-technology high-performance
LCD display.
Two Color Gamuts including
the new Wide DCI-P3 used by 4K UHD TVs
The iPhone 7 fully supports two important Standard Color
Gamuts, the new DCI-P3 Wide Color Gamut that is used in 4K UHD TVs and in
Digital Cinema, and also the traditional smaller sRGB / Rec.709 Color Gamut
that is used for most existing consumer content
for digital cameras, TVs, the internet, and computers, including photos,
videos, and movies. All of the other recent model iPhones and almost all other
Smartphones and Tablets just support sRGB / Rec.709. The new DCI-P3 Color Gamut
is 26 percent larger.
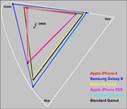
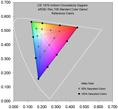
Since the iPhone 7 supports two Color Gamuts it needs to
also implement Color Management in order to have the second smaller sRGB /
Rec.709 Gamut to also appear correctly, which is generated from the wider
native DCI-P3. Each display is individually calibrated at the factory. The
iPhone 7 has a very accurate 102 percent of the wide DCI-P3 Wide Color Gamut
and a very accurate104 percent of the sRGB / Rec.709 Color Gamut. See this Figure for the measured
Color Gamuts.
In addition, the iPhone 7 detects content marked with the
wider DCI-P3 Color Gamut and automatically switches between Gamuts so that
content with the smaller sRGB / Rec.709 Gamut is accurately reproduced and not
displayed with over saturated colors.
Display Brightness and
Contrast Ratio
The measured Peak Brightness for the iPhone 7 is 602 cd/m2
(nits), the Highest Peak Brightness that we have measured for a Smartphone for
all Average Picture Levels APL, including Full Screen White. That is slightly
under the 625 nits that Apple lists as the Typical Peak Brightness for the
iPhone 7. But on the iPhone 7 the Peak Brightness can go considerably higher
when Automatic Brightness is turned On, which we examine below. But High screen
Brightness is only needed when in High Ambient Light, so most of the time the
Brightness should be set lower than the Maximum.
The Display’s Maximum Contrast is the Ratio between its
Peak White Brightness (Luminance) and its darkest Black Luminance, one of the
more important measures of LCD performance quality. The iPhone 7 has a measured
(True not Dynamic) Contrast Ratio of 1,762, which is Very Good for a mobile
display, and the highest that we have measured for any IPS LCD display. It is
also 26 percent larger than the 1,400 that Apple lists as Typical. However,
Contrast Ratio is only meaningful in low ambient light, which is seldom the
case for mobile displays. See the Brightness
and Contrast section for measurements and details.
When the display is viewed under ambient light, the light
reflected by the screen results in a lower Effective
Contrast Ratio that depends on the Screen Reflectance. Our Contrast Rating for High Ambient Light provides a
quantitative measure for display performance in ambient light, which we examine
below...
Even Higher Automatic Peak
Brightness
On the iPhone 7 the
Maximum Screen Brightness can go much higher when Automatic
Brightness is turned On, so that users can’t permanently park the Manual
Brightness slider to very high values, which would run down the battery
quickly. High Screen Brightness is only needed for
High Ambient Light, so turning Automatic Brightness On will provide
better high ambient light screen visibility and also longer battery running
time.
When Automatic Brightness
is turned On, the iPhone 7 produces up to an impressive 705 cd/m2 (nits) in High Ambient Light, where high Brightness
is really needed – the Highest Peak Brightness for a Smartphone for any Average
Picture Level APL, including Full Screen White.
As a result of its high Brightness and low Reflectance,
the iPhone 7 has a Contrast Rating for High Ambient
Light that ranges from 137 to 160, also
among the highest that we have ever measured for a Smartphone display. See the Brightness
and Contrast, the High
Ambient Light and the Screen
Reflections sections for measurements and details.
Low Screen Reflectance and Performance in Ambient Lighting
The screens on all displays are mirrors that reflect
light from everything that is illuminated anywhere in front of the screen
(especially anything behind the viewers), including lamps, ceiling lights,
windows, direct and indirect indoor and outdoor sunlight, which washes out the
on-screen colors, degrades image contrast, and interferes with seeing the
on-screen images. The lower the Screen Reflectance the better. In fact,
decreasing the Screen Reflectance by 50 percent doubles the effective Contrast
Ratio in Ambient Light, so it’s very important because it is equivalent to
doubling the display’s Peak Brightness (Luminance).
To visually compare the differences in screen Reflectance for yourself,
hold any Smartphones or Tablets side-by-side and turn off the displays so you
just see the reflections. Those reflections are still there when you turn them
on, and the brighter the ambient light the brighter the reflections.
The iPhone 7 has a screen Reflectance of 4.4 percent, the
lowest that we have ever measured for a Smartphone. However, it is considerably
higher than the record low 1.7 percent screen Reflectance that we measured for the
iPad Pro 9.7, which has a very innovative AR Anti-Reflection screen
coating.
Unfortunately, AR coatings still can’t be used with
Smartphones, which have much higher abrasion and scratch issues than Tablets
and other touch screen displays because they are small enough to be carried in
pockets and bags that have all sorts of scratchy things inside. A number of
companies are working on technologies that can produce both low screen
Reflectance and high abrasion and scratch resistance. We covered this issue
last year, but it’s challenging and also has to be cost effective. Since Peak
Brightness can’t keep increasing due to battery power limitations and thermal
issues, developing a low Reflectance screen will be the key to improving
display performance in High Ambient Light.
Our Contrast Rating for High
Ambient Light quantitatively measures screen visibility under bright
Ambient Light – the higher the better. As a result of its high Brightness and
very low Reflectance, the iPhone 7 has a Contrast
Rating for High Ambient Light of 137 to 160,
among the highest that we have ever measured for a Smartphone display. See the Screen
Reflections and Brightness
and Contrast sections for measurements and details.
Record Absolute Color Accuracy
Delivering great color with high Absolute Color Accuracy
is incredibly difficult because everything on the display has to be done just
right. In order to deliver accurate image colors, a display needs to closely
match the standard Color Gamut that was used for producing the content being
viewed – not more and not less. In addition the display also needs an accurate
(pure logarithmic power-law) Intensity Scale, and an accurate White Point.
Since the iPhone 7 supports two Color Gamuts it needs to
also implement Color Management in order to get the second smaller sRGB /
Rec.709 Gamut to also appear correctly, which is generated from the wider native
DCI-P3. Each iPhone display is individually calibrated at the factory.
The Absolute Color Accuracy of the iPhone 7 is Truly Impressive as shown in these Figures. It has an
Absolute Color Accuracy of 1.1 JNCD for the sRGB / Red.709 Color Gamut that is
used for most current consumer content, and 1.0 JNCD for the Wider DCI-P3 Color
Gamut that is used for 4K UHD TVs and Digital Cinema. It is the most color
accurate display that we have ever measured. It is Visually
Indistinguishable From Perfect, and is very likely considerably better
than any mobile display, monitor, TV or UHD TV that you have.
See this Figure for an explanation
and visual definition of Just Noticeable Color Difference JNCD and the Color Accuracy Plots
showing the measured display Color Errors. See the Color
Accuracy section and the Color
Accuracy Plots for measurements and details.
Record Absolute Luminance Accuracy
In order to produce an accurate
image, the display also needs to produce an Accurate Luminance (Brightness)
value for every color throughout its entire Color Space. Many displays produce
Accurate Colors but produce them with inaccurate Luminance values, so the
pixels in the image appear with a systematically incorrect distribution of
color and Brightness, which distorts the appearance of the picture. Absolute
Luminance Accuracy is a very important picture quality metric.
Every color in the CIE Diagram for a given
Color Gamut and White Point has a particular Luminance value with respect to
the Luminance for the White Point that must be accurately reproduced. We
measured the Absolute Luminance Accuracy for each of the 41 Reference Colors in
each of the two Standard Color Gamuts and analyzed the results. Since the eye
judges Color separately from Brightness (Luminance), it is essential that Color
Accuracy and Luminance Accuracy be measured and evaluated separately. Some reviewers use Display Calibration software that helps
service technicians calibrate displays by combining both Color and Luminance
into something called dE, but since it mixes both of them together, it is
meaningless for evaluating either Color Accuracy or Luminance Accuracy.
For the iPhone 7 sRGB / Rec.709
Color Gamut the Average Luminance Accuracy is ±2% over the entire Color Gamut for the 41 Reference Colors.
For the Wide DCI-P3 Color Gamut the Average Luminance Accuracy is also ±2% over the entire Color
Gamut for the 41 Reference Colors. These are very accurate results, so all
colors on the iPhone 7 are reproduced with very accurate Brightness
(Luminance).
These Absolute Luminance
Accuracy results for the iPhone 7 are excellent and are Visually Indistinguishable from Perfect. See the Absolute
Luminance Accuracy section for measurements and details.
Night Shift Viewing Mode
The iPhone 7 Night Shift viewing mode is
designed to change the color balance of the display in order to reduce the
amount of Blue light coming from the display, which some recent research
indicates can affect how well users sleep afterwards. In a separate article we have analyzed
the performance of Night
Shift, and then provide our own detailed recommendations for both consumers
and manufacturers.
The measurements in
that article are based on the iPhones and iPads with the narrower sRGB /
Rec.709 Color Gamut like on the iPhone 6 and iPad Pro 12.9 and earlier iPads,
however, the Blue part of the spectrum below 490nm for the iPhone 7 is almost
identical to them as shown in this Figure, so the article
results also cover the iPhone 7.
Viewing Angle Performance
While Smartphones are
primarily single viewer devices, the variation in display performance with
Viewing Angle is still very important because single viewers frequently hold
the display at a variety of viewing angles. The angle is often up to 30
degrees, more if it is resting on a table or desk.
All iPhones and iPads have
IPS LCD displays, so we expected the iPhone 7 to show very small color shifts
with Viewing Angle, and our lab measurements confirmed their excellent Viewing
Angle performance, with no visually noticeable color shifts. With its
Dual-Domain Pixels, the iPhone 7 Contrast Ratio remained close to 1,000:1 at 30
degrees for both the Portrait and Landscape modes, which is the highest we have
measured for LCDs.
However, all LCDs do have
a strong decrease in Brightness (Luminance) with Viewing Angle, and the iPhone
7 showed (as expected) a 55 percent decrease in Brightness at a modest 30 degree
Viewing Angle. See the Viewing
Angles section for measurements and details.
Viewing Tests
The very challenging set of DisplayMate Test and
Calibration Photos that we use to visually evaluate picture quality looked
absolutely Beautiful on the iPhone 7, even to
my experienced hyper-critical eyes.
The iPhone 7 excels due to its record Absolute Color
Accuracy (1.1 JNCD), which is Visually
Indistinguishable from Perfect, and is very likely considerably better
than any mobile display, monitor, TV or UHD TV that you have. So photos,
videos, and online content and merchandise will appear correct and beautiful.
See Color Accuracy Figures
and the Colors
and Intensities section for quantitative details.
Display Power Efficiency
The display’s Power
Efficiency is a major factor in limiting the display’s Peak Brightness
(Luminance) and also the phone’s running time on battery. There are many
factors that affect a display’s Power Efficiency, including its native Color
Gamut, the type of the White LEDs that are used, the optics and optical films
in the Backlight, the circuit technology in the LCD Backplane, the Pixels Per
Inch, and the screen refresh rate.
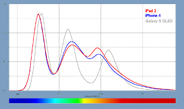
The
Backlights for almost all LCD displays, including the iPhone 6, have White
LEDs, which are made by using a Blue LED together with a Yellow phosphor to
transform some of the light for the Red and Green primaries, resulting in broad
rolling spectra for these LCDs, which isn’t very efficient for light or power.
However, Wide Color Gamut LCDs like the iPhone 7 instead use specially tuned Red
and Green phosphors to optimally transform the light for the chosen saturated
Red and Green primaries, which improves their light and power efficiency.
After measuring the
power used by iPhone 7 and iPhone 6 displays, we scaled the results to the same
screen brightness (Luminance) in order to compare their Relative Power
Efficiencies. In spite of its much wider Color Gamut, the iPhone 7 is actually
7 percent more power efficient than the iPhone 6, which is important and
significant. See the Display
Power section and the LCD Display Spectrum Figure
for measurements and details.
Conclusions for the iPhone 7: An Excellent
Top Tier Display…
The primary goal of this Display Technology Shoot-Out
article series has always been to publicize and promote display excellence
so that consumers, journalists and even manufacturers are aware of and
appreciate the very best in displays and display technology. We point out which
manufactures and display technologies are leading and advancing the
state-of-the-art for displays by performing comprehensive and objective
scientific Lab tests and measurements together with in-depth analysis. We point
out who is leading, who is behind, who is improving, and sometimes
(unfortunately) who is back pedaling… all based solely on the extensive
objective careful Lab measurements that we also publish, so that everyone can
judge the data for themselves as well…
Conclusions Overview
In the Conclusions sections below, we first summarize all
of the results, then review several of the most significant display topics, and
then discuss the future of all Smartphone displays.
See the main Display
Shoot-Out Comparison Table for all the DisplayMate Lab measurements and
test details, and see the Results Highlights section
above for a more detailed introduction and overview with expanded discussions
and explanations.
An Outstanding Smartphone
Display
The display on the iPhone 7 is a Truly
Impressive Top Performing Display and a major upgrade and enhancement to
the display on the iPhone 6. It is by far the best performing mobile LCD
display that we have ever tested, and it breaks many display performance
records.
The iPhone 7 has the
following cutting-edge state-of-the-art display performance functions and
features:
• The iPhone
7 has 2 Standard Color Gamuts, following in the footsteps of the innovative iPad Pro 9.7
that was introduced earlier in 2016. Most mobile displays only support a single
Color Gamut, including all previous iPhones. The iPhone 7 has both the
traditional smaller sRGB / Rec.709 Color Gamut that is used for producing most
existing consumer content for digital cameras, TVs, the internet, and
computers, including photos, videos, and movies, and the new wider DCI-P3 Color
Gamut, which is 26 percent larger.
• The iPhone
7 has the same wide DCI-P3 Color Gamut as 4K UHD TVs, so it will be able to
accurately display all of the new 4K TV and video content. Since the iPhone 7
has a Retina Display it doesn't need the 4K resolution because it already
appears perfectly sharp at its normal viewing distances.
• The new
wider DCI-P3 Color Gamut is really a big deal – it is what makes 4K UHD TVs
deliver noticeably better color and picture quality than 2K Full HD TVs, which
is why consumers are upgrading their TVs, and why they will want to upgrade
their mobile devices up to DCI-P3.
• Only three
manufacturers currently have the new wider DCI-P3 Color Gamut on their
Smartphones or Tablets, so it is a major competitive advantage. Other
manufacturers will need to play catch-up fast.
• We
measured a very high Peak Brightness of 602 cd/m2 (nits), the
Highest Peak Brightness that we have measured for a Smartphone for all Average
Picture Levels APL, including Full Screen White.
• When
Automatic Brightness is turned On, the iPhone 7 produces up to an impressive
705 nits in High Ambient Light, where high Brightness is really needed – the
Highest Peak Brightness for a Smartphone for any Average Picture Level APL,
including Full Screen White.
• The wider
Color Gamut and much brighter display significantly improve screen readability
and usability in high ambient light, which along with battery running is one of
the most important issues for consumers.
• The
Absolute Color Accuracy of the iPhone 7 is Truly
Impressive as shown in these Figures. It is the most
color accurate display that we have ever measured. It is Visually Indistinguishable from Perfect, and is very
likely considerably better than on any mobile display, monitor, TV or UHD TV
that you have. So photos, videos, and online content and merchandise will
appear correct and beautiful.
The iPhone 7 matches or
breaks new Smartphone display performance records for:
• The
Highest Absolute Color Accuracy for any display (1.1 JNCD) – Visually Indistinguishable from Perfect
• The
Highest Absolute Luminance Accuracy for any display (±2%) – Visually Indistinguishable from Perfect
• Very
Accurate Image Contrast and Intensity Scale (with Gamma 2.21) – Visually Indistinguishable from Perfect
• The
Highest Peak Brightness Smartphone for any Average Picture Level APL (602 to
705 nits)
• The
Highest (True) Contrast Ratio for any IPS LCD display (1,762) – Higher Dynamic
Contrast Ratios are phony
• The Lowest
Screen Reflectance for any Smartphone display (4.4 percent)
• The
Highest Contrast Rating in High Ambient Light for a Smartphone for any APL (137
to 160)
• The
Smallest Color variation with Viewing Angle (2.1 JNCD or less)
See the Results Highlights
section and Display
Shoot-Out Comparison Table for all of the measurements and details.
iPhone 7 Display has Top
Performance Across the Board
As we list in detail in the Lab Measurements
Comparison Table section below, the iPhone 7 delivers uniformly consistent
all around Top Tier display performance: one of a small number of displays to
ever to get all Green (Very Good to Excellent) Ratings in all test and
measurement categories (except for Brightness variation with Viewing Angle,
which is the case for all LCDs) since we started the Display Technology
Shoot-Out article Series in 2006, an impressive achievement for a display.
Comparison with the iPhone 6
The iPhone 6 has a Very Good display that we rated A– in
2014. However, in just about every display Lab test and measurement, the iPhone
7 shows from significant to major Across the Board improvements compared to the
iPhone 6. See the main Display
Shoot-Out Comparison Table for all of the Lab measurements and test
details,
iPhone 7 Display Conclusion
Steve Jobs clearly always highly valued display
performance and loved bragging about Apple displays, so he would definitely be
extremely proud of the exceptional performance of the iPhone 7 display, but
probably be dismayed at how little public attention Apple has given to their
outstanding iPhone 7 display – which provides a major competitive advantage
that most consumers and reviewers are not yet aware of... and other
manufacturers will need to play catch-up fast because... The key element for a great Smartphone has always been a
truly innovative and top performing display, and the best leading edge
Smartphones have always flaunted their super high tech displays!! So do it...
Switching to OLED Displays for the Next iPhone
Given the exceptional performance of the iPhone 7 LCD display, there
will be many consumers, journalists, reviewers, and even manufacturers wondering
if Apple will actually be switching to OLED iPhone displays in 2017, as has
been widely reported...
Both LCDs and OLEDs can produce exceptional state-of-the-art displays.
But LCD and OLED technologies have different inherent native strengths and weaknesses,
so neither display technology wins in all cases – it depends on the details of
the specific application.
LCDs are a great cutting edge high performance display technology for
Tablets to TVs, but for small handheld Smartphones, OLED displays provide a
number of significant advantages over LCDs including: being much thinner, much
lighter, with a much smaller bezel providing a near rimless design, they can be
made flexible and into curved screens, plus they have a very fast response
time, better viewing angles, and an always-on display mode. Many of OLED's
performance advantages result from the fact that LCDs are dependent on
transmitting the varying characteristics of their White LED backlight – but for
OLEDs the sub-pixels are directly electrically powered to emit light, which can
provide better color accuracy, image contrast accuracy, and screen uniformity.
Because of their very flexible power management capabilities, OLEDs are
not only more power efficient than LCDs for most image content, but they now
deliver much higher peak Brightness than LCDs because of this. However, for
mostly all white screen content LCDs are likely to remain brighter and more
power efficient for a while. OLED displays are now manufactured on flexible
substrates, which allows the screens to be curved and rounded like on the
Galaxy Note7 and earlier Galaxy Edge and Galaxy Round
displays.
Apple’s reported move to an OLED iPhone is simply a recognition of all
of the above, particularly as more and more competing Smartphones will be
coming with OLED displays.
Comparing Top Tier Smartphone Displays
You can
directly compare all of the display performance measurements and results for
other high-end Smartphones in our Mobile Display Technology Shoot-Out article series by using a
Tabbed web browser on the Comparison Table for each article. We have also
included the iPad Pro 9.7 below because of its display similarity to the iPhone
7. The entries for all of the articles are mostly identical with only minor
formatting differences, so it is easy to make detailed side-by-side comparisons
by simply clicking through the Tabs for each Smartphone or Tablet.
Below are
links for the Comparison Tables for the Smartphones and Tablets mentioned in
the article:
iPhone 7 Lab
Measurements Comparison Table
iPhone 6 Lab
Measurements Comparison Table
iPad Pro 9.7
Lab Measurements Comparison Table
Galaxy S7 OLED
Lab Measurements Comparisons Table
Galaxy
Note7 OLED Lab Measurements Comparisons Table
The Next Generation of Displays – Better Performance in Ambient Light
The best performing LCD and OLED displays are now
delivering impressive sharpness, brightness, high color accuracy, accurate
image contrast, and great viewing angles. So what comes next? Essentially all
published display specifications and factory calibrations are based on
performance in absolute darkness 0 lux, but mobile displays (and even TVs) are
seldom viewed in the dark. Even low levels of ambient light significantly
affect the image and picture quality. For example, the 100 percent Color Gamut
specified by many manufacturers only applies at 0 lux. At 500 lux, which
corresponds to typical indoor office lighting, the on-screen colors are washed
out by the reflected ambient light, typically reducing the on-screen Color
Gamut from 100 percent down to 80 percent, plus the image contrast is also
significantly affected. And it gets worse as the ambient light levels increase.
So here is what needs to come next…
The most important improvements for both LCD and OLED
displays will come from improving their image and picture quality and screen
readability in real world ambient light, which washes out the screen images,
resulting in reduced image contrast, color saturation, and color accuracy. The
key will be in lowering screen Reflectance as much as possible, expanding the
native display Color Gamut as much as possible, and then implementing Dynamic
Color Management with automatic real-time modification of the Color Gamut and
Intensity Scale based the measured Ambient Light level in order to have them
compensate for the reflected light glare and image wash out from ambient light
as discussed in our 2014
Innovative Displays and Display Technology and SID
Display Technology Shoot-Out articles.
The higher the ambient light level, the larger the Color
Gamut that the display needs in order to compensate for the loss of color
saturation from the reflected ambient light. All LCDs will need tunable Quantum
Dots, special phosphors, fluorescent films or discrete Blue, Green and Red
LEDs in order to implement the necessary large Color Gamuts.
The displays, technologies, and
manufacturers that succeed in implementing this new real world high ambient
light performance strategy will take the lead in the next generations of mobile
displays… Follow DisplayMate
on Twitter to learn about these developments and our upcoming display
technology coverage.
DisplayMate Display Optimization Technology
All
Smartphone and Tablet displays can be significantly improved using
DisplayMate’s proprietary very advanced scientific analysis and mathematical
display modeling and optimization of the display hardware, factory calibration,
and driver parameters. We help manufacturers with expert display procurement, prototype
development, testing displays to meet contract specifications, and production
quality control so that they don’t make mistakes similar to those that are
exposed in our public Display Technology Shoot-Out series for consumers. This
article is a lite version of our advanced scientific analysis – before the
benefits of our DisplayMate
Display Optimization Technology, which can correct or improve all of these
issues. If you are a display or product manufacturer and want to significantly
improve display performance for a competitive advantage then Contact DisplayMate Technologies.
Display Shoot-Out Comparison Table
Below we
examine in-depth the LCD displays on the Apple iPhone
6 and Apple
iPhone 7 based on objective Lab measurement data and criteria. For
comparisons and additional background information on other current Smartphone
and Tablet displays see our iPhone 6 Display
Technology Shoot-Out, our Apple iPad Pro 9.7
Display Technology Shoot-Out, and our Apple iPad Pro 12.9
and iPad mini 4 Display Technology Shoot-Out articles.
For
comparisons with other Smartphone displays see our Galaxy S7 OLED
Display Technology Shoot-Out and Galaxy Note7 OLED
Display Technology Shoot-Out articles. For comparisons with the other
leading Smartphone, Tablet, and Smart Watch displays see our Mobile Display Technology
Shoot-Out series.
Display Specifications
|
Categories
|
iPhone 6
|
iPhone 7
|
Comments
|
|
Display Technology
|
4.7
inch Diagonal
IPS LCD
with LTPS Backplane
|
4.7 inch
Diagonal
IPS LCD
with LTPS Backplane
Dual-Domain Pixels
Photo Aligned LCD
|
The diagonal screen size.
In Plane Switching
Liquid Crystal Display
Low Temperature Poly Silicon
|
|
Screen Shape
|
16:9
= 1.78
Aspect
Ratio
|
16:9
= 1.78
Aspect
Ratio
|
The iPhones have the same shape as
widescreen TV video content.
|
|
Screen Size
|
2.30 x
4.09 inches
|
2.30 x
4.09 inches
|
Display Width and Height in inches.
|
|
Screen Area
|
9.4
Square Inches
|
9.4
Square Inches
|
A better measure of size than the
diagonal length.
|
|
Relative Screen Area
|
100 percent
|
100 percent
|
Relative screen areas compared to the
iPhone 6.
|
|
Color Gamut
|
One Color
Gamut
sRGB /
Rec.709 Color Gamut
|
Two Color
Gamuts
sRGB /
Rec.709 Color Gamut
and
DCI-P3
Wide Color Gamut
|
sRGB
/ Rec.709 is the color standard for most
content
and needed for accurate color reproduction.
DCI-P3 is a 26% larger Color Gamut that is
used in 4K UHD TVs and in Digital Cinema.
|
|
Display Resolution
|
1334 x 750
pixels
High
Definition+
|
1334 x 750
pixels
High
Definition+
|
Screen Pixel Resolution.
|
|
Total Number of Pixels
|
1.0 Mega
Pixels
|
1.0 Mega
Pixels
|
Total Number of Pixels.
|
|
Pixels Per Inch
|
326 PPI
Very Good
|
326 PPI
Very Good
|
Sharpness depends on viewing distance and
PPI.
See this on
the visual acuity for a Retina Display
|
|
20/20 Vision Distance
where Pixels or Sub-Pixels
are Not Resolved
|
10.5 inches or more
with 20/20
Vision
|
10.5 inches or more
with 20/20
Vision
|
For 20/20 Vision the minimum Viewing
Distance
where the screen appears perfectly sharp
to the eye.
|
|
Display Sharpness
at Typical Viewing Distances
|
Display
normally appears
Perfectly
Sharp
Typical 11
inches or more
Pixels not
Resolved with 20/20 Vision
|
Display
normally appears
Perfectly
Sharp
Typical 11
inches or more
Pixels not
Resolved with 20/20 Vision
|
The Typical Viewing Distances for these
screen sizes are 11 inches or more.
|
|
Appears Perfectly Sharp
at Typical Viewing Distances
|
Yes
|
Yes
|
Typical Viewing Distances are listed
above.
|
|
Photo Viewer Color Depth
|
Full
24-bit Color
No
Dithering Visible
256
Intensity Levels
|
Full
24-bit Color
No
Dithering Visible
256
Intensity Levels
|
Many Android Smartphones still have some
form of 16-bit color
depth in the Gallery Viewer.
The iPhones do not have this issue.
|
|
Overall Assessments
This section summarizes
the results for all of the extensive Lab Measurements and Viewing Tests
performed on the display
See Screen
Reflections, Brightness
and Contrast, Colors
and Intensities, Viewing
Angles, LCD Spectra,
Display
Power.
|
Categories
|
iPhone
6
|
iPhone 7
|
Comments
|
|
Viewing Tests
in Subdued Ambient Lighting
|
Very Good
Images
Photos and
Videos
have Very
Good Color
and
Accurate Contrast
|
Excellent
Images
Photos and
Videos
have
Excellent Color
and
Accurate Contrast
|
The Viewing Tests examine the accuracy
of
photographic images by comparing the
displays
to a calibrated studio monitor and TV.
|
|
Variation with Viewing Angle
Colors and Brightness
See Viewing
Angles
|
Small Color
Shifts
with
Viewing Angle
Very Good
Large
Brightness Shift
with
Viewing Angle
Typical for
all LCDs
|
Very Small
Color Shifts
with
Viewing Angle
Excellent
Large
Brightness Shift
with
Viewing Angle
Typical for
all LCDs
|
The iPhone LCD displays all have a
relatively large
decrease in Brightness with Viewing
Angle and
relatively small Color Shifts with
Viewing Angle.
See the Viewing
Angles
section for details.
|
|
Overall Display Assessment
Lab Tests and Measurements
|
Very Good
LCD Display
|
Excellent
LCD Display
|
The iPhone LCD displays all performed
very well in the Lab Tests and
Measurements.
|
|
|
|
Color Gamuts
|
Accurate
Color Gamut
101 percent
sRGB /
Rec.709 Color Gamut
|
2
Very Accurate Color Gamuts
104 percent
sRGB /
Rec.709 Color Gamut
102 percent
DCI-P3
Color Gamut
|
sRGB
/ Rec.709 is the color standard for most
TV
content and needed for accurate color reproduction.
DCI-P3 is a 26% larger Color Gamut that is
used in 4K UHD TVs and in Digital Cinema
|
|
Absolute Color Accuracy
Measured over Entire Gamut
For 41 Reference Colors
See Figure 2 and Colors
|
Very Good
Color Accuracy
Small
Color Errors
sRGB /
Rec.709 Color Gamut
Average
2.6 JNCD
Maximum
4.8 JNCD
|
Record
Absolute Color Accuracy
Very Small
Color Errors
sRGB /
Rec.709 Color Gamut
Average
1.1 JNCD
Maximum
2.8 JNCD
DCI-P3
Color Gamut
Average
1.0 JNCD
Maximum
2.6 JNCD
|
Absolute
Color Accuracy is measured with a
Spectroradiometer
for 41
Reference Colors
uniformly
distributed within the entire Color Gamut.
See
Figure 2 and Colors
and Intensities for details.
The new 4K UHD TVs and Digital Cinema use
DCI-P3.
A Wide Color Gamut is useful in High
Ambient Light
and
for some applications
|
|
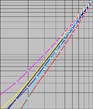
Image Contrast Accuracy
Logarithmic Intensity Scale
See Figure 3 and Contrast
|
Excellent
Image
Contrast Accuracy
Very Close
to Standard
Average
Gamma 2.22
|
Excellent
Image
Contrast Accuracy
Very Close
to Standard
Average
Gamma 2.21
|
The
Image Contrast Accuracy is determined by
measuring
the Log Intensity Scale and Gamma.
See
Figure 3 and Brightness
and Contrast for details.
|
|
True Contrast Ratio at 0 lux
For Low Ambient Light
|
1,592
Very Good
for Mobile
|
1,762
Very Good
for Mobile
|
Only relevant for Low Ambient Light,
which is seldom the case for mobile
devices.
|
|
Performance in Ambient Light
Display Brightness
Screen Reflectance
Contrast Rating
for High Ambient Light
See Brightness
and Contrast
See Screen
Reflections
|
High
Display Brightness
558 nits
558 nits
with Auto Brightness
Low
Reflectance
4.6
percent
High
Contrast Rating
for High
Ambient Light
121
Very
Good
121 with Auto Brightness
|
High
Display Brightness
602 nits
705 nits
with Auto Brightness
Low
Reflectance
4.4
percent
Very High
Contrast Rating
for High
Ambient Light
137
Excellent
160 with
Auto Brightness
|
Smartphones
are seldom used in the dark.
Screen
Brightness and Reflectance determine
the
Contrast Rating for High Ambient Light.
See
the Brightness
and Contrast section for details.
See
the Screen
Reflections section for details.
|
|
Overall Display Calibration
Image and Picture Quality
Lab Tests and Viewing Tests
|
Very Good
Calibration
But White Point is
Slightly Too
Blue
7,241 K 2.0 JNCD
|
Impressive
Calibration Accuracy
White Point is
Very Close
to D65 Standard
6,806 K 0.8 JNCD
|
This is the overall Display Calibration
Accuracy.
White Point Accuracy is more critical
because
it affects the Accuracy of all Low
Saturation Colors.
|
|
|
Overall Display Grade
Overall Assessment
|
Very Good
Display A–
But only
1.0 Mega Pixels
|
Excellent
Display A
But only
1.0 Mega Pixels
Innovative
Two Color
Gamuts
Record
Absolute Color Accuracy
|
The display on the iPhone 7 is a Truly
Impressive Top Performing Display and a major upgrade to the display on the
iPhone 6. It is by far the best performing mobile LCD display that we have
ever tested, and it breaks many display performance records.
|
|
|
iPhone
6
|
iPhone 7
|
Comments
|
|
Screen Reflections
All display screens are mirrors good enough to use
for personal grooming – but that is actually a very bad feature…
We measured the light reflected from all directions
and also direct mirror (specular) reflections, which are much more
distracting and cause more eye strain. Many
Smartphones still have greater than 5 percent reflections that make the
screen much harder to read even in moderate ambient
light levels, requiring ever higher brightness settings that waste
precious battery power. Hopefully, manufacturers
will reduce the Reflections with anti-reflection coatings and also
the Mirror Reflections matte or haze surface
finishes.
Our Lab Measurements include Average Reflectance
for Ambient Light from All Directions and for Mirror Reflections.
All recent model iPhones
have a bonded Cover Glass without an Air Gap.
|
Categories
|
iPhone 6
|
iPhone
7
|
Comments
|
|
Average Screen Reflection
Light From All Directions
|
4.6
percent
for
Ambient Light Reflections
Excellent
|
4.4
percent
Ambient
Light Reflections
Excellent
|
Measured using an Integrating Hemisphere
and
a Spectroradiometer. The best value we
have
ever measured for a Smartphone is 4.4
percent.
|
|
Mirror Reflections
Percentage of Light Reflected
|
6.0 percent
for Mirror Reflections
Very Good
|
5.8 percent
for Mirror Reflections
Very Good
|
These are the most annoying types of
Reflections.
Measured using a Spectroradiometer and a
narrow
collimated pencil light beam reflected
off the screen.
|
|
Brightness and Contrast
The Contrast Ratio
is the specification that gets the most attention, but it only applies for
low ambient light, which is seldom
the case for mobile displays. Much more important
is the Contrast Rating, which indicates how
easy it is to read the screen
under high ambient lighting and depends on both
the Maximum Brightness and the Screen Reflectance. The larger the better.
|
Categories
|
iPhone
6
|
iPhone 7
|
Comments
|
|
Measured Full Brightness
100% Full Screen White
|
Brightness
558 cd/m2
Excellent
|
Brightness
602 cd/m2
Excellent
|
This is the Brightness for a screen that
is entirely
all white with 100% Average Picture
Level.
|
|
Measured Peak Brightness
1% Full Screen White
|
Brightness
558 cd/m2
Excellent
|
Brightness
602 cd/m2
Excellent
|
This is the Peak Brightness for a screen
that
has only a tiny 1% Average Picture
Level.
|
|
Measured Auto Brightness
in High Ambient Light
with Automatic Brightness On
|
Maximum
with Auto Brightness
558 cd/m2
Excellent
|
Maximum
with Auto Brightness
705 cd/m2
Excellent
|
Some displays like the iPhone 7 have a
higher
Maximum Brightness in Automatic
Brightness Mode.
|
|
Low Ambient Light
|
|
Lowest Peak Brightness
Brightness Slider to Minimum
|
6 cd/m2
Very Good
for Low Light
|
3 cd/m2
Very Good
for Low Light
|
The Lowest Brightness with the Slider
set to Minimum. This is useful for working in very dark environments.
|
|
True Black Brightness at 0 lux
at Maximum Brightness Setting
|
0.35 cd/m2
Very Good
for Mobile
|
0.34 cd/m2
Very Good
for Mobile
|
Black brightness is important for low
ambient light,
which is seldom the case for mobile
devices.
|
|
True Contrast Ratio at 0 lux
Relevant for Low Ambient Light
|
1,592
Very Good
for Mobile
|
1,762
Very Good for
Mobile
|
Only relevant for Low Ambient Light,
which is seldom the case for mobile
devices.
|
|
High Ambient Light
|
|
Contrast Rating
for High Ambient Light
The Higher the Better
for Screen Readability
in High Ambient Light
|
121
Excellent
121
With Auto
Brightness
Excellent
|
137
Excellent
160
With Auto
Brightness
Excellent
|
Depends on the Screen Reflectance and
Brightness.
Defined: Maximum Brightness / Average Reflectance.
The display’s actual Contrast Ratio
changes with
the Ambient Light lux level and is proportional
to
the Contrast Rating.
|
|
Screen Readability
in High Ambient Light
|
Excellent A
Excellent A
With Auto Brightness
|
Excellent A+
Excellent A+
With Auto Brightness
|
Indicates how easy it is to read the
screen
under high ambient lighting. Depends on
both the Screen Reflectance and
Brightness.
See High
Ambient Light Screen Shots
|
|
Colors and Intensities
The Color Gamut, Intensity Scale, and White Point
determine the quality and accuracy of all displayed images and all
the image colors. Bigger is definitely Not Better
because the display needs to match all the standards that were used
when the content was produced. For LCDs a wider
Color Gamut reduces the power efficiency and the Intensity Scale
affects both image brightness and color mixture
accuracy.
The slightly Bluish White Point for the
iPhone 6 results in somewhat higher Absolute Color Errors.
|
Categories
|
iPhone
6
|
iPhone 7
|
Comments
|
|
Color of White
Color Temperature in degrees
See Figure 2 for JNCD
Measured in the dark at 0 lux
For the Plotted White Points
See Figure 1
|
7,241 K
2.0 JNCD
from D65 White
White is
slightly Bluish
See Figure 1
See Figure 2 for JNCD
|
6,806 K
0.8 JNCD
from D65 White
Very Close
to Standard
See Figure 1
See Figure 2 for JNCD
|
D65 with 6,500 K is the standard color
of White
for most Consumer Content and needed for
accurate color reproduction of all
images.
White Point Accuracy is more critical
because
it affects the Accuracy of all Low
Saturation Colors.
JNCD is a Just Noticeable Color Difference.
See Figure 2 for the
definition of JNCD.
|
|
Color Gamut
Measured in the dark at 0 lux
See Figure 1
|
101
percent
sRGB /
Rec.709 Color Gamut
Very Close
to Standard
See Figure 1
|
104 percent
sRGB /
Rec.709 Color Gamut
Very Close
to Standard
See Figure 1
|
sRGB / Rec.709 is the color standard for
most
TV content and needed for accurate color
reproduction.
See Figure 1
|
|
102 percent
DCI-P3
Color Gamut
Very Close
to Standard
See Figure 1
|
DCI-P3 is a 26% larger Color Gamut that is
used in 4K UHD TVs and in Digital Cinema.
See Figure 1
|
|
Absolute Color Accuracy
|
|
Absolute Color Accuracy
Average Color Error at 0 lux
For 41 Reference Colors
Just Noticeable Color Difference
See Figure 2
|
Average Color Error
From sRGB / Rec.709 Color Gamut
Δ(u’v’)
= 0.0104
2.6 JNCD
Very Good
Accuracy
See Figure 2
|
Average Color Error
From sRGB / Rec.709 Color Gamut
Δ(u’v’)
= 0.0043
1.1 JNCD
Excellent
Accuracy
See Figure 2
|
JNCD is a Just Noticeable Color Difference.
See Figure 2 for the
definition of JNCD and for
Accuracy Plots showing
the measured Color Errors.
Average Errors below 3.5 JNCD are Very
Good.
Average Errors 3.5 to 7.0 JNCD are
Good.
Average Errors above 7.0 JNCD are
Poor.
|
|
Average Color Error
From DCI-P3 Color Gamut
Δ(u’v’)
= 0.0041
1.0 JNCD
Excellent
Accuracy
See Figure 2
|
|
Absolute Color Accuracy
Largest Color Error at 0 lux
For 41 Reference Colors
Just Noticeable Color Difference
See Figure 2
|
Largest Color Error
From sRGB / Rec.709 Color Gamut
Δ(u’v’)
= 0.0191
4.8 JNCD
for Magenta-Red
Very Good
Accuracy
See Figure 2
|
Largest Color Error
From sRGB / Rec.709 Color Gamut
Δ(u’v’)
= 0.0114
2.8 JNCD
for Blue-Magenta
Excellent
Accuracy
See Figure 2
|
JNCD is a Just Noticeable Color Difference.
See Figure 2 for the
definition of JNCD and for
Accuracy Plots showing
the measured Color Errors.
Largest Errors below 7.0 JNCD are
Very Good.
Largest Errors 7.0 to 14.0 JNCD are
Good.
Largest Errors above 14.0 JNCD are
Poor.
This is twice the limit for the Average
Error.
|
|
Largest Color Error
From DCI-P3 Color Gamut
Δ(u’v’)
= 0.0103
2.6 JNCD for
Blue–Magenta
Excellent
Accuracy
See Figure 2
|
|
Absolute Luminance Accuracy
|
|
Absolute Luminance Accuracy
Average Luminance Error
All Colors within the Gamut
For the 41 Reference Colors
See Figure 2
|
Average Luminance Error
For sRGB / Rec.709 Color Gamut
Over the
Entire Gamut
2 percent
Excellent
Accuracy
|
Average Luminance Error
For sRGB / Rec.709 Color Gamut
Over the
Entire Gamut
2 percent
Excellent
Accuracy
|
The Luminance Error is the difference
between the
actual and standard Brightness
(Luminance) for any
specific color within the entire Color
Gamut.
Average Errors below 5 percent are
Very Good
Average Errors 5 to 10 percent are
Good
Average Errors above 10 percent are
Poor
See Figure 2 for the 41
Reference Colors.
|
|
Average Luminance Error
For DCI-P3 Color Gamut
Over the
Entire Gamut
2 percent
Excellent
Accuracy
|
|
Absolute Luminance Accuracy
Largest Luminance Error
All Colors within the Gamut
For the 41 Reference Colors
See Figure 2
|
Largest Luminance Error
For sRGB / Rec.709 Color Gamut
Over the
Entire Gamut
7 percent
for Blue
Very Good
Accuracy
|
Largest Luminance Error
For sRGB / Rec.709 Color Gamut
Over the
Entire Gamut
5 percent
for Blue-Magenta
Very Good
Accuracy
|
The Luminance Error is the difference
between the
actual and standard Brightness
(Luminance) for any
specific color within the entire Color
Gamut.
Largest Errors below 10 percent are
Very Good
Largest Errors 10 to 20 percent are
Good
Largest Errors above 20 percent are
Poor
This is twice the limit for the Average
Error.
See Figure 2 for the 41
Reference Colors.
|
|
Largest Luminance Error
For DCI-P3 Color Gamut
Over the
Entire Gamut
7 percent
for Blue-Magenta
Very Good
Accuracy
|
|
Intensity Scale and Image Contrast Accuracy
|
|
Dynamic Brightness
Luminance Decrease with
Average Picture Level APL
|
0 percent
Decrease
Excellent
|
0 percent
Decrease
Excellent
|
This is the percent Brightness decrease
with APL
Average Picture Level. Ideally should be
0 percent.
|
|
Logarithmic Intensity Scale
and Image Contrast
See Figure 3
|
Very
Smooth and Straight
Excellent
Image Contrast
See Figure 3
|
Very
Smooth and Straight
Excellent
Image Contrast
See Figure 3
|
The Intensity Scale controls image
contrast needed
for accurate Image Contrast and Color
reproduction.
See Figure 3
|
|
Gamma for the Intensity Scale
Larger has more Image Contrast
See Figure 3
|
Average
2.22
Excellent
Very Close
to 2.20 Standard
|
Average
2.21
Excellent
Very Close
to 2.20 Standard
|
Gamma is the log slope of the Intensity
Scale.
Gamma of 2.20 is the standard and needed
for
accurate Image Contrast and Color
reproduction.
See Figure 3
|
|
Image Contrast Accuracy
|
Excellent
|
Excellent
|
See Figure 3
|
|
Viewing Angles
The variation of
Brightness, Contrast, and Color with Viewing Angle is especially important
for Smartphones because
of their larger screen and
multiple viewers. The typical manufacturer 176+ degree specification for LCD
Viewing Angle
is nonsense because that
is where the Contrast Ratio falls to a miniscule 10. For most LCDs there are
substantial
degradations at less
than ±30 degrees, which is not an atypical Viewing Angle for Smartphones and
Tablets.
Note that the Viewing
Angle performance is also very important for a single viewer because the
Viewing Angle can vary
significantly based on
how the Smartphone is held. The Viewing Angle can be very large if resting on
a table or desk.
|
Categories
|
iPhone
6
|
iPhone 7
|
Comments
|
|
Brightness Decrease
at a 30 degree Viewing Angle
|
–44
percent Portrait
–57
percent Landscape
Very Large
Decrease
Typical for
all LCDs
|
–54
percent Portrait
–55
percent Landscape
Very Large
Decrease
Typical for
all LCDs
|
Most screens become less bright when
tilted.
LCD decrease is generally greater than 50
percent.
|
|
Contrast Ratio at 0 lux
at a 30 degree Viewing Angle
|
1010
Portrait
695 Landscape
Very Good
for Mobile
|
980
Portrait
956
Landscape
Very Good
for Mobile
|
A measure of screen readability when the
screen
is tilted under low ambient lighting.
|
|
White Point Color Shift
at a 30 degree Viewing Angle
|
Small
Color Shift
Δ(u’v’)
= 0.0037
0.9 JNCD Excellent
|
Small
Color Shift
Δ(u’v’)
= 0.0031
0.8 JNCD Excellent
|
JNCD is a Just Noticeable Color Difference.
See Figure 2 for the
definition of JNCD.
Same Rating Scale as Absolute Color
Accuracy.
|
|
Primary Color Shifts
Largest Color Shift for R,G,B
at a 30 degree Viewing Angle
|
Largest Color Shift
Δ(u’v’)
= 0.0052
for Pure
Blue
1.3 JNCD Excellent
|
Small Color
Shift
Largest Δ(u’v’) = 0.0061
for Pure
Blue
1.5 JNCD Excellent
|
JNCD is a Just Noticeable Color Difference.
See Figure 2 for the
definition of JNCD.
Same Rating Scale as Absolute Color
Accuracy.
|
|
Color Shifts for Color Mixtures
at a 30 degree Viewing Angle
Reference Brown (255, 128, 0)
|
Small
Color Shift
Δ(u’v’)
= 0.0046
1.2 JNCD Excellent
|
Small
Color Shift
Δ(u’v’)
= 0.0084
2.1 JNCD Very Good
|
JNCD is a Just Noticeable Color Difference.
Color Shifts for non-IPS LCDs are about 10
JNCD.
Reference Brown is a good indicator of
color shifts
with angle because of unequal drive
levels and
roughly equal luminance contributions
from Red
and Green. See Figure 2 for the
definition of JNCD.
|
|
Display Power Consumption
The display power was measured using a Linear
Regression between Luminance and AC Power with a fully charged battery.
Below we compare the Relative Display
Power Efficiencies of the iPhone 6 and iPhone 7.
The Power Efficiency values are also scaled to the
same screen brightness (Luminance) to compare their Relative Power
Efficiencies.
|
|
Categories
|
iPhone
6
|
iPhone 7
|
Comments
|
|
Maximum Display Power
Full White Screen
at Maximum Brightness
|
1.07 watts
558 cd/m2
9.4 inch2
Screen Area
|
1.08 watts
602 cd/m2
9.4 inch2
Screen Area
|
This measures the display power for a
screen that
is entirely at Peak White for Maximum
Brightness.
|
|
Relative Power Efficiency
Compared to the iPhone 7
Same Luminance 558 cd/m2
Same 4.7 inch screen area
|
Relative Power 100%
Relative Efficiency 100%
1.07 watts
|
Relative Power 93%
Relative Efficiency 107%
1.00 watts
|
This compares the Maximum Power Efficiency
by scaling to the same screen brightness
and
same screen area.
|
About the Author
Dr. Raymond Soneira is
President of DisplayMate Technologies Corporation of Amherst, New Hampshire,
which produces display calibration, evaluation, and diagnostic products for
consumers, technicians, and manufacturers. See www.displaymate.com. He is a research
scientist with a career that spans physics, computer science, and television
system design. Dr. Soneira obtained his Ph.D. in Theoretical Physics from
Princeton University, spent 5 years as a Long-Term Member of the world famous
Institute for Advanced Study in Princeton, another 5 years as a Principal
Investigator in the Computer Systems Research Laboratory at AT&T Bell
Laboratories, and has also designed, tested, and installed color television
broadcast equipment for the CBS Television Network Engineering and Development
Department. He has authored over 35 research articles in scientific journals in
physics and computer science, including Scientific American. If you have any
comments or questions about the article, you can contact him at dtso.info@displaymate.com.
DisplayMate Display Optimization Technology
All
Smartphone and Tablet displays can be significantly improved using
DisplayMate’s proprietary very advanced scientific analysis and mathematical
display modeling and optimization of the display hardware, factory calibration,
and driver parameters. We help manufacturers with expert display procurement,
prototype development, testing displays to meet contract specifications, and
production quality control so that they don’t make mistakes similar to those
that are exposed in our public Display Technology Shoot-Out series for
consumers. This article is a lite version of our advanced scientific analysis –
before the benefits of our DisplayMate
Display Optimization Technology, which can correct or improve all of these
issues. If you are a display or product manufacturer and want to significantly
improve display performance for a competitive advantage then Contact DisplayMate Technologies.
About DisplayMate Technologies
DisplayMate Technologies specializes in proprietary advanced
scientific display calibration and mathematical display optimization to deliver
unsurpassed objective performance, picture quality and accuracy for all types
of displays including video and computer monitors, projectors, HDTVs, mobile
displays such as Smartphone and Tablets, and all display technologies including
OLED, LCD, 3D, LED, LCoS, Plasma, DLP and CRT. This article is a lite version of our intensive
scientific analysis of Smartphone and Tablet mobile displays – before the
benefits of our advanced mathematical DisplayMate Display Optimization
Technology, which can correct or improve many of the display deficiencies. We offer DisplayMate display
calibration software for consumers and advanced DisplayMate display diagnostic
and calibration software for technicians and test labs.
For manufacturers
we offer Consulting Services that include advanced Lab testing and evaluations,
confidential Shoot-Outs with competing products, calibration and optimization
for displays, cameras and their User Interface, plus on-site and factory
visits. We help manufacturers with expert display procurement, prototype
development, and production quality control so they don’t make mistakes similar
to those that are exposed in our Display Technology Shoot-Out series. See our
world renown Display
Technology Shoot-Out public article series for an introduction and preview.
DisplayMate’s
advanced scientific optimizations can make lower cost panels look as good or
better than more expensive higher performance displays. If you are a display or
product manufacturer and want to turn your display into a spectacular one to
surpass your competition then Contact
DisplayMate Technologies to learn more.
Article Links: iPhone 6
Display Technology Shoot-Out
Article Links: iPad Pro
9.7 Display Technology Shoot-Out
Article Links: Absolute
Color Accuracy Display Technology Shoot-Out
Article Links: Display
Color Gamuts Shoot-Out NTSC to Rec.2020
Article Links: Display Technology Shoot-Out
Article Series Overview and Home Page
Copyright © 1990-2016 by DisplayMate
Technologies Corporation. All Rights Reserved.
This article, or any part
thereof, may not be copied, reproduced, mirrored, distributed or incorporated
into any other work without
the prior written permission of DisplayMate Technologies Corporation