iPhone 6 Display Technology Shoot-Out
iPhone 6 and
iPhone 6 Plus with the iPhone 5
Dr. Raymond M. Soneira
President, DisplayMate Technologies
Corporation
Copyright © 1990-2014 by DisplayMate
Technologies Corporation. All Rights Reserved.
This article, or any part
thereof, may not be copied, reproduced, mirrored, distributed or incorporated
into any other work without
the prior written permission of DisplayMate Technologies Corporation
Introduction
A key element for a great Smartphone has always been a truly innovative
and top performing display, and the best leading edge Smartphones have always
flaunted their beautiful high tech displays.
Apple iPhones (and iPads) were up until recently at the leading edge of
mobile displays: they were early adopters of high performance IPS LCDs, the
full 100 percent sRGB Color Gamut, and full 24-bit color, all of which
dramatically improve image and picture quality and display performance. Steve
Jobs and Apple also made display-quality a central theme for their product
marketing.
iPhone 4: Their most
famous and aggressive innovation came with the introduction of the Retina
display in 2010 for the iPhone 4, where Apple doubled the pixel resolution and
Pixels Per Inch (ppi) up to where the screen appeared perfectly sharp for
normal 20/20 Vision at typical Smartphone viewing distances of 10.5 inches or
more. It was a brilliant technical and marketing innovation, and the
competition was left in the dust…
iPhone 4s, 5, 5s: But
then iPhone display innovation slowed almost to a crawl: in 2011 the iPhone 4s
display remained the same (mid-cycle refresh). In 2012 with the iPhone 5, the
new display enhancements were increasing the Color Gamut up to 100 percent sRGB
and bumping up the display size from 3.5 to 4.0 inches. In 2013 the iPhone 5s
display stayed the same (mid-cycle refresh). It’s now four years since the
innovative iPhone 4. This could be a touch of the Blackberry effect (the
display is already perfect), or perhaps a bit like the tale of an
intermittently sprinting Hare losing to the steady progress of a Tortoise… more
on this in the Conclusions.
Competition: While Apple display innovation
slowed, many other manufacturers just steadily pushed ahead to take the lead.
So recently Amazon, Google, HTC, Huawei, LG, and Samsung have been launching
products with the best and most innovative mobile displays, as documented in
our Display Technology
Shoot-Out article series. The new iPad mini Retina
display, for example, came in a distant third place finish due to
backpedaling its Color Gamut down to 63 percent from 100 percent in earlier
Apple products (and in many competing products).
iPhone 6: Now in 2014,
four years after the introduction of the innovative iPhone 4, it’s nice to see
Apple once again significantly enhancing the displays for their iPhone 6 and 6
Plus. But there are now four years of catching up to do, and there are many
more display issues in addition to screen size, which is the simplest one that
has gotten the most attention. We’ll examine how the new iPhone displays
compare to their competition, which includes other Full HD LCD
Smartphones and the OLED Samsung Galaxy S5,
plus we just finished testing the Galaxy Note 4 and
Note Edge, which have the latest OLED displays. We’ll cover these issues
and much more, with in-depth comprehensive display tests, measurements and
analysis that you will find nowhere else.
High Tech Display
Enhancements
One particularly revealing point during the keynote
announcement for the new iPhones were slides listing several technical display
enhancements like Photo aligned IPS, Dual Domain pixels, and Improved
Polarizers. Interesting, but they really don’t mean much because it is the Lab
tests that determine whether they actually improve display performance or are
just sales and marketing puffery. We’ll find out in our Lab tests. In either
case, it is significant that Apple wants everyone to know that display
performance is important, and that they have been working to improve the
displays on the new iPhones… And they did!
Sapphire
The use of sapphire to
make the iPhone screens scratch proof was one of the most talked about rumors
over past year as a result of Apple’s $578M investment with GT Advanced
Technologies to build a factory in Arizona. The likelihood of sapphire
appearing on the iPhone 6 was close to zero because it will probably take at
least another year for everything to come together. It is important to note
that sapphire has some downsides over and above its much higher cost and
manufacturing complexity. The most important issue for display performance is
that sapphire has almost double the screen Reflectance of glass (due to
principles of optics), so it will be harder to read sapphire screens in high
ambient light. That might be one reason why the recently announced Apple Watch
Sport edition has a cover glass rather than sapphire like the other models –
because it is much more likely to be used unshielded in high ambient light
outdoors. Another reason is that while sapphire is very hard it is also brittle
and is likely more prone to impact breakage, which is more common in sports
situations. So, if given the choice, I personally would choose a cover glass
with its better screen visibility and breakage protection. Others may find the
scratch protection more important.
The Display Shoot-Out
To examine the
performance of the iPhone 6 and 6 Plus displays we ran our in-depth series of Mobile Display Technology
Shoot-Out Lab tests and measurements in order to determine how the latest
LCD displays have improved. We take display quality very seriously and provide
in-depth objective analysis based on detailed laboratory tests and measurements
and extensive viewing tests with both test patterns, test images and test
photos. To see how far LCD and LCD mobile displays have progressed in just four
years see our 2010
Smartphone Display Shoot-Out, and for a real history lesson see our
original 2006
Smartphone Display Shoot-Out.
Results Highlights
In this Results section we provide Highlights of the
comprehensive DisplayMate Lab tests and measurements and extensive visual
comparisons using test photos, test images, and test patterns that are covered
in the advanced sections. The main Display Shoot-Out
Comparison Table summarizes the iPhone 6 and iPhone 6 Plus Lab measurements
in the following categories: Screen
Reflections, Brightness
and Contrast, Colors
and Intensities, Viewing Angles,
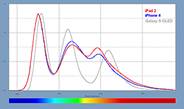
LCD Spectra,
Display
Power. You can also skip these Highlights and go directly to the iPhone Conclusions.
Display Resolution and PPI
Both the iPhone 6 and 6 Plus are what Apple calls Retina
displays, which simply means that the pixels cannot be resolved with normal
20/20 Vision at the typical viewing distances for the displays, which for these
screen sizes is typically 11 inches or more. That is the origin of the often
misunderstood 326 Pixels Per Inch ppi. The iPhone 6 has a 1334x750 pixel
display with 326 ppi and the iPhone 6 Plus has a 1920x1080 pixel display with
401 ppi.
While the display on
the iPhone 6 has almost identical performance
to the iPhone 6 Plus, it only has a 1.0 Mega
Pixel display, significantly lower than the 2.1 pixels on the iPhone 6 Plus,
and the 2.1 to 3.7 Mega Pixels found on all of the other leading Smartphones.
While its 326 ppi and 1334x750 resolution qualifies it as an HD Retina display,
there are a number of other significant advantages for going to higher
resolutions that exceed the limits set by normal 20/20 Vision. For one, it is
particularly important to have as many pixels as possible when digitally
rescaling images from their native resolution to the display that they are
being viewed on. Most images require rescaling and most rescaled images (from
either higher or lower resolutions) with fine text and graphics look noticeably
to considerably better in side-by-side comparisons on the iPhone 6 Plus with
2.1 Mega Pixels compared to just 1.0 Mega Pixels on the iPhone 6. Twice as many
pixels to work with makes a noticeable visual difference. In addition, even
with content at their respective native display resolutions, fine text and
graphics look better on the iPhone 6 Plus. The display
on the iPhone 6 is none-the-less still a Very Good display, and most buyers
will be happy with its performance. We’ll
examine this in detail below.
There are some significant advantages in going higher
than the visual acuity for 20/20 Vision at typical viewing distances. For
Smartphones they include a closer match to digital photo resolutions, the
ability to display standard Full HD 1920x1080 images and videos at their native
resolutions. For the iPhone 6 Plus no rescaling is required for Full HD
content, which always results in the best possible image and picture quality.
In addition, if you really want (or need) to take advantage of the extra fine
display sharpness and resolution above normal 20/20 Vision, you can. If you
study and stare at the image on the screen, move it closer and move it around,
you’ll be able to make out considerably more fine image detail because you are
building an integrated visual map of the image in your brain. So, when you are
looking at an image with very finely detailed graphics and small text, most
people with reasonably good vision will be able to make out and take advantage
of the extra sharpness and image detail if they take the time to do so. See our
2014 Innovative
Displays and Display Technology article for more details.
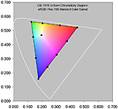
Full sRGB Color Gamut and Absolute Color Accuracy
It was a relief to see the new iPhones stick with a full
100 percent sRGB Color Gamut after the iPad mini Retina
display was launched in 2013 with a reduced 63 percent sRGB Color Gamut.
Both new iPhones provide a very accurate sRGB and Rec.709 Color Gamut that is
used in virtually all current consumer content for digital cameras, HDTVs, the
internet, and computers, including photos, videos, and movies. So it’s
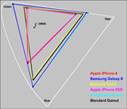
necessary for high color accuracy. We measured a nearly perfect 99 percent sRGB
Color Gamut for the iPhone 6 and 101 percent for the iPhone 6 Plus, both
impressively accurate. See this Figure for the measured
Color Gamuts.
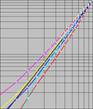
In order to produce high Absolute Color Accuracy a
display also needs an accurate (pure logarithmic power-law) Intensity Scale,
and an accurate White Point. The new iPhones both have very accurate Intensity
Scales with a Gamma of 2.22, however, they both have a Slightly Bluish White
Point, with a Color Temperature of about 7,300K, which is still (marginally)
Very Good, and also somewhat better than the iPhone 5.
In our detailed Lab tests the measured Absolute Color
Accuracy for the for the iPhone 6 is 2.6 JNCD, and for the iPhone 6 Plus 3.1
JNCD. See this Figure for
an explanation and visual definition of JNCD
and the Color Accuracy
Plots showing the measured display Color Errors. Both are Very Good, among
the most accurate mobile displays we have ever measured, and are very likely
considerably more accurate than your living room TV. See the Color
Accuracy section and the Color
Accuracy Plots for measurements and details.
Screen Brightness and
Performance in High Ambient Lighting
Mobile displays are often used under relatively bright
ambient light, which washes out the image colors and contrast, reducing picture
quality and making it harder to view or read the screen. To be usable in high
ambient light a display needs a dual combination of high screen Brightness and
low screen Reflectance – the iPhone 6 and 6 Plus have both. They each provide
over 550 cd/m2 (Luminance, which is a measure of Brightness sometimes
called nits), among the brightest that we have ever measured for a Smartphone,
and considerably higher than the Full
HD LCD Smartphones that we tested in 2013.
The screen Reflectance for both new iPhones is 4.6
percent, close to the lowest value we have ever measured, and also considerably
lower than the same Full HD
LCD Smartphones. Our Contrast Rating for High
Ambient Light quantitatively measures screen visibility under bright
Ambient Light – the higher the better. As a result of their high Brightness and
low Reflectance, the iPhone 6 and 6 Plus have a Contrast Rating for High
Ambient Light of 121, among the highest that we have ever measured (and also
the same as the much smaller iPhone 5). See the Brightness
and Contrast, the High
Ambient Light and the Screen
Reflections sections for measurements and details.
Exceeding Display
Specifications
All of the tested iPhone displays have almost identical
Brightness, Contrast Ratio, Color Gamut, Intensity Scale, and overall
calibration. This is unusual and is due to the detailed automated factory
calibration performed on every individual display at the factory.
Apple is one of the few remaining manufacturers to
actually provide display specifications. They specify a “typical” Brightness of
500 cd/m2 for both the iPhone 6 and 6 Plus – we measured 558 cd/m2
for the iPhone 6 and 566 cd/m2 for iPhone 6 Plus, both about 12
percent greater than the typical, which is impressive because they
significantly exceed it – often the reverse is true… Apple also specifies a
“typical” Contrast Ratio of 1400:1 for the iPhone 6 and we measured a True
Contrast Ratio of 1591:1, and a “typical” Contrast Ratio of 1300:1 for the
iPhone 6 Plus and we measured a True Contrast Ratio of 1451:1, both about 13
percent greater than the typical, and also the highest True Contrast Ratios
that we have ever measured for mobile LCDs. Note that the very high Dynamic
Contrast Ratios claimed by some manufacturers are meaningless and pure
nonsense. And for those of you thinking of Emailing that we got hand-picked
units, these were purchased retail from Verizon Wireless. See the Brightness
and Contrast section for measurements and details.
Display Power Efficiency
The iPhone 6 and 6 Plus have roughly the same
Display Power Efficiency as the iPhone 5, which is not that surprising since
they all have Low Temperature Poly Silicon LTPS Backplanes, which are currently
the most power efficient available. They are 10 percent more display power
efficient than the Full HD LCD
Smartphones that we tested, impart due to the different ppi, which is a
factor.
Comparing them to latest OLEDs:
LCDs are typically more power efficient for images with mostly white content
(like text screens, for example), while OLEDs are more power efficient for
mixed image content because they are emissive displays so their power varies
with the Average Picture Level (average Brightness) of the image content. For
LCDs the display power is independent of image content. For mixed image content
(that includes photos, videos, and movies, for example) with a typical 50
percent Average Picture Level (APL), the latest OLED Galaxy Note 4 display is
21 percent more power efficient than the iPhone 6 and 6 Plus displays. On the
other hand, for a Full White Screen with 100 percent APL, the iPhone 6 and 6
Plus are 45 percent more display power efficient than the latest OLED Galaxy
Note 4 display. See the Display
Power section for measurements and details.
Viewing Angle Performance
While Smartphones are
primarily single viewer devices, the variation in display performance with
viewing angle is still very important because single viewers frequently hold
the display at a variety of viewing angles. The angle is often up to 30
degrees, more if it is resting on a table or desk.
The High Tech Display
Enhancements that Apple mentioned really show up with Viewing Angle. The iPhone
6 and 6 Plus have significantly better Viewing Angle performance than the
iPhone 5 or any other LCD that we have ever tested. Particularly important and
noticeable are the much higher Contrast Ratios and the lower Brightness
Decrease with Viewing Angle. The Color Shifts with Viewing Angle are also very
small. See the Viewing
Angles section for measurements and details.
Viewing Tests
The iPhone 6 and 6 Plus provide very nice, pleasing and
accurate colors, and picture quality. Although the White Points are both
(intentionally) slightly too blue, the Absolute Color Accuracy and Intensity
Scales are Very Good to Excellent. The very challenging set of DisplayMate Test
and Calibration Photos that we use to evaluate picture quality looked Beautiful, even to my experienced hyper-critical
eyes. But this only holds for viewing in low Ambient Light. We’ll discuss high
Ambient Light in the Conclusions…
iPhone 6 and 6 Plus Conclusions:
Impressive Smartphone Displays…
The primary goal of this Display Technology Shoot-Out
article series has always been to point out which manufactures and display
technologies are leading and advancing the state-of-the-art of displays by
performing comprehensive and objective Lab tests and measurements together with
in-depth analysis. We point out who is leading, who is behind, who is
improving, and sometimes (unfortunately) who is back pedaling… all based solely
on the extensive objective measurements that we also publish, so that everyone
can judge the data for themselves as well… See the main Display Shoot-Out
Comparison Table for all of the measurements and details.
iPhone Display Evolution
The iPhone 4 not only revolutionized the displays on Smartphones but it
also started a major unprecedented renaissance of new display technologies for
Smartphones, Tablets, TVs, and entirely new classes of products like wearable
displays. That approach impressed consumers and moved the entire display
industry. Then for reasons we can only guess, innovation on the iPhone displays
slowed down almost to a crawl, while many other manufacturers just steadily
pushed ahead – so there was a fair amount of catching up to do…
The Best LCD Smartphone Display
Now in 2014, four years after the introduction of the innovative iPhone
4, it’s nice to see Apple once again significantly enhancing the displays for
their iPhone 6 and 6 Plus. While screen size has gotten the most attention,
there are many more important and challenging display technology issues that
Apple needed to address and enhance… And they did!
iPhone 6 Plus: Based on our extensive Lab tests
and measurements, the iPhone 6 Plus is the Best
performing Smartphone LCD display that we have ever tested. It delivers
uniformly consistent all around Top Tier display performance. The iPhone 6 Plus is only the second Smartphone display
(LCD or OLED) to ever get all Green (Very Good to Excellent) Ratings in all
test and measurement categories (except for Brightness variation with Viewing
Angle, which is the case for all LCDs) since we started the Display Technology
Shoot-Out article series in 2006, an impressive achievement for a display. The iPhone 6 Plus has raised the bar for top LCD display
performance up by a notch. See the main Display Shoot-Out
Comparison Table for all of the measurements and details.
The iPhone 6 Plus matches or breaks new records in LCD
Smartphone display performance for: Highest Peak Brightness, Lowest Screen
Reflectance, Highest (True) Contrast Ratio, Highest Contrast Rating in Ambient
Light, most accurate (pure logarithmic power-law) Intensity Scale and Gamma,
most accurate Image Contrast, and the smallest Variations with Viewing Angle
for Brightness, Contrast Ratio and Color. Where the iPhone 6 Plus display does
very well but does not break LCD performance records is in: Resolution
(1920x1080 versus 2560x1440), Pixels Per Inch ppi (401 ppi versus 538 ppi). and
Absolute Color Accuracy (3.1 JNCD versus 2.1 JNCD).
iPhone 6: The display on the iPhone 6 has almost identical performance to the iPhone 6 Plus – but it only has a 1.0 Mega Pixel
display, significantly lower than the 2.1 to 3.7 Mega Pixels found on all of
the other leading Smartphones. While its 326 ppi and 1334x750 resolution
qualifies it as an HD Retina display, there are a number of other significant
advantages for exceeding the limits set by normal 20/20 Vision. It is
particularly important to have as many pixels as possible when digitally
rescaling images from their native resolution to the display that they are
being viewed on. Most rescaled images look noticeably better on the iPhone 6
Plus with 2.1 Mega Pixels compared to just 1.0 Mega Pixels on the iPhone 6. In
addition, even at the native display resolution, fine text and graphics look
better on the iPhone 6 Plus if you look carefully and closely at the screen
(because you may want to or need to).
The display on the iPhone 6 is none-the-less still a Very Good display,
and most buyers will be happy with its performance, but it’s somewhat
disappointing that Apple went for satisfactory as opposed to the best. Maybe
that was done for intentional product differentiation with the iPhone 6 Plus,
or perhaps to improve their margins… With a 1920x1080 display the iPhone 6
would have taken the crown…
Comparing the LCD iPhone 6 and 6 Plus with the OLED Samsung Galaxy
S5 and Note 4 Displays
LCDs
and OLEDs are the two leading mobile display technologies. The technologies are
significantly different and each one has its own inherent strengths.
The iPhone 6 and 6 Plus are the current Best Mobile LCD Displays and the Galaxy S5 and Galaxy
Note 4 are the current Best Mobile OLED Displays.
The iPhone 6 with a 4.7 inch 1334x750 display with 326 ppi corresponds most
closely with the Galaxy S5 5.2 inch 1920x1080 display with 432 ppi. The iPhone
6 Plus with a 1920x1080 display with 401 ppi corresponds most closely with the
Galaxy Note 4 5.7 inch display with a 2560x1440 display with 518 ppi.
You can compare all four displays in detail by using a
tabbed web browser with our comprehensive Lab measurements and analysis for
each of the displays.
Click
on each Link below. The entries are mostly identical with only minor formatting
differences, so it’s easy to make detailed comparisons.
iPhone 6 and 6
Plus Lab Measurements Comparison Table
Samsung Galaxy
S5 Lab Measurements Comparison Table
Samsung
Galaxy Note 4 Lab Measurements Comparison Table
Another way to compare them is by the relative strengths
of each technology, which are listed below. Then refer to the individual Lab
Measurements Links above in order to get the values for the categories of
interest. The Manufacturer Dependent Strengths are categories that are not
directly related to LCDs or OLEDs, but rather depend on how well the
manufacturer implements them.
Current LCD Strengths: higher Peak Brightness with high Average
Picture Levels, no Peak Brightness variation with Average Picture Level, wide
Color Gamuts with Quantum Dots, smaller Color Shifts with Viewing Angle, higher
power efficiency with high Average Picture Levels, and much higher worldwide
market share.
Current OLED Strengths: higher Peak Brightness with lower Average
Picture Levels, easier to increase screen resolution and ppi, perfect Blacks
and infinite Contrast Ratios, wide Color Gamuts, smaller Brightness shifts with
Viewing Angle, better Screen Uniformity, faster Response Times and no display
motion blur, higher power efficiency with lower Average Picture Levels.
Manufacturer Dependent Strengths: low Screen Reflectance, accurate
factory calibration, high Absolute Color Accuracy, accurate Image Contrast,
good screen uniformity, multiple Color Gamuts, and providing Color Management.
The Best Smartphone Display
The
iPhone 6 and iPhone 6 Plus are the current Best Mobile LCD Displays and the Galaxy S5 and Galaxy Note 4 are the current Best Mobile OLEDs
Displays.
Both are impressive and excellent displays with great state-of-the-art display
technology. We recently gave the Samsung Galaxy Note 4 our overall Best
Smartphone Display award, and for the time being that continues for all of
the reasons originally mentioned there.
In particular, for implementing Color Management to provide multiple Color
Gamuts, and then using the Color Management to provide the Highest Absolute Color
Accuracy for Standard (sRGB/Rec.709) consumer content of any Smartphone or
Tablet display that we have ever measured (in one of its four available screen
modes, which many reviewers seem to overlook). As we discuss next, dynamic
Color Management is something that every display will need to provide in the
future.
With
display technology advancing rapidly on many different fronts, things can
change again in the next generation of displays – so best wishes to all of the
manufacturers and technologies in innovating and developing the next generation
of even higher-performance displays!
The Next Generation of Best
Mobile Displays
The best performing LCD and OLED displays are now
delivering impressive sharpness, brightness, low reflectance, high color
accuracy, accurate image contrast, and great viewing angles. So what comes
next? Essentially all published display specifications and factory calibrations
are based on performance in absolute darkness 0 lux, but mobile displays (and
even TVs) are seldom viewed in the dark. Even low levels of ambient light
significantly affect the image and picture quality. For example, the 100
percent sRGB Color Gamut specified by many manufacturers only applies at 0 lux.
At 500 lux, which corresponds to typical indoor office lighting, the on-screen
colors are washed out by the reflected ambient light, typically reducing the
on-screen Color Gamut from 100 percent down to 80 percent, plus the image
contrast is also significantly affected. And it gets worse as the ambient light
levels increase. So here is what needs to come next…
The most important improvements for both LCD and LCD
mobile displays will come from improving their image and picture quality and
screen readability in ambient light, which washes out the screen images,
resulting in reduced image contrast, color saturation, and color accuracy. The
key will be in implementing automatic real-time modification of the display’s
Color Gamut and Intensity Scales based the measured Ambient Light level in
order to have them compensate for the reflected light glare and image wash out
from ambient light as discussed in our 2014
Innovative Displays and Display Technology and SID
Display Technology Shoot-Out articles. LCDs will need Quantum
Dots in order to implement the necessary wide Color Gamuts. The displays, technologies, and manufacturers that succeed in
implementing this new high ambient light performance strategy will take the
lead in the next generations of mobile displays… Follow DisplayMate on Twitter to learn
about these developments and our upcoming display technology coverage.
DisplayMate Display Optimization Technology
All
Smartphone and Tablet displays can be significantly improved using
DisplayMate’s proprietary very advanced scientific analysis and mathematical
display modeling and optimization of the display hardware, factory calibration,
and driver parameters. We help manufacturers with expert display procurement,
prototype development, testing displays to meet contract specifications, and
production quality control so that they don’t make mistakes similar to those
that are exposed in our public Display Technology Shoot-Out series for
consumers. This article is a lite version of our advanced scientific analysis –
before the benefits of our DisplayMate
Display Optimization Technology, which can correct or improve all of these
issues. If you are a display or product manufacturer and want to significantly
improve display performance for a competitive advantage then Contact DisplayMate Technologies.
Display Shoot-Out Comparison Table
Below we
examine in-depth the LCD displays on the Apple iPhone
6 and iPhone 6
Plus based on objective Lab measurement
data and criteria. For comparisons and additional background information refer
to these comparable Smartphone displays: Samsung Galaxy S5
Display Technology Shoot-Out, Samsung Galaxy
Note 4 Display Technology Shoot-Out, Full HD LCD
Smartphone Display Technology Shoot-Out, and the iPhone 5 Display
Technology Shoot-Out. For comparisons with the other leading Smartphone,
Tablet and Smart Watch displays see our Mobile Display Technology
Shoot-Out series.
|
Categories
|
iPhone
5
|
iPhone
6
|
iPhone 6
Plus
|
Comments
|
|
Display Technology
|
4.0 inch
Diagonal
IPS LCD
with LTPS Backplane
|
4.7 inch
Diagonal
IPS LCD
with LTPS Backplane
|
5.5 inch
Diagonal
IPS LCD
with LTPS Backplane
|
Liquid Crystal Display
In Plane Switching
Low Temperature Poly Silicon
|
|
Screen Shape
|
16:9 =
1.78
Aspect
Ratio
|
16:9 =
1.78
Aspect
Ratio
|
16:9 =
1.78
Aspect
Ratio
|
The iPhones have the same shape as
widescreen HDTV video content.
|
|
Screen Size
|
1.96 x
3.48 inches
|
2.30 x
4.09 inches
|
2.69 x
4.79 inches
|
Display Width and Height in inches.
|
|
Screen Area
|
6.8 Square
Inches
|
9.4 Square
Inches
|
12.9
Square Inches
|
A better measure of size than the
diagonal length.
|
|
Relative Screen Area
|
100
percent
|
138
percent
|
189
percent
|
Relative screen areas compared to the
iPhone 5.
|
|
Display Resolution
|
1136 x 640
pixels
Standard
Definition+
Good
|
1334 x 750
pixels
High
Definition+
Good
|
1920 x
1080 pixels
Full High
Definition
Very Good
|
Screen Pixel Resolution.
|
|
Total Number of Pixels
|
0.7 Mega
Pixels
Good
|
1.0 Mega
Pixels
Good
|
2.1
Mega Pixels
Very Good
|
Total Number of Pixels.
|
|
Pixels Per Inch
|
326 PPI
Very Good
|
326 PPI
Very Good
|
401 PPI
Excellent
|
Sharpness depends on the viewing distance
and PPI.
See this on
the visual acuity for a true Retina Display
|
|
20/20 Vision Distance
where Pixels or Sub-Pixels
are Not Resolved
|
10.5
inches
with 20/20
Vision
|
10.5
inches
with 20/20
Vision
|
8.6
inches
with 20/20
Vision
|
For 20/20 Vision the minimum Viewing
Distance
where the screen appears perfectly sharp
to the eye.
At 11 inches from the screen 20/20 Vision
is 313 PPI.
|
|
Display Sharpness
at Typical Viewing Distances
|
Display
normally appears Perfectly Sharp
Pixels are
not Resolved with 20/20 Vision
|
Display
normally appears
Perfectly
Sharp
Pixels are
not Resolved
with 20/20
Vision
|
Display
appears
Perfectly
Sharp
Pixels are
not Resolved with 20/20 Vision
|
The Typical Viewing Distances for these
screen sizes are 11 inches or more.
|
|
Appears Perfectly Sharp
at Typical Viewing Distances
|
Yes
|
Yes
|
Yes
|
Typical Viewing Distances are 11 inches
or more
for these screen sizes.
|
|
Photo Viewer Color Depth
|
Full
24-bit Color
No
Dithering Visible
256
Intensity Levels
|
Full
24-bit Color
No
Dithering Visible
256
Intensity Levels
|
Full
24-bit Color
No
Dithering Visible
256
Intensity Levels
|
Many Android Smartphones and Tablets
still have some form of 16-bit color
depth in the Gallery Viewer.
The Apple iPhone 6 and 6 Plus do not have
this issue.
|
|
Overall Assessments
This section summarizes
the results for all of the extensive Lab Measurements and Viewing Tests
performed on the display
See Screen
Reflections, Brightness
and Contrast, Colors
and Intensities, Viewing
Angles, LCD
Spectra, Display Power.
|
Categories
|
iPhone 5
|
iPhone 6
|
iPhone 6
Plus
|
Comments
|
|
Viewing Tests
in Subdued Ambient Lighting
|
Very Good
Images
Photos and
Videos
have Very
Good Color
and
Accurate Contrast
|
Very Good
Images
Photos and
Videos
have Very
Good Color
and
Accurate Contrast
|
Very Good
Images
Photos and
Videos
have Very
Good Color
and
Accurate Contrast
|
The Viewing Tests examine the accuracy
of
photographic images by comparing the
displays
to an calibrated studio monitor and
HDTV.
|
|
Variation with Viewing Angle
Colors and Brightness
See Viewing
Angles
|
Small
Color Shifts
with
Viewing Angle
Large
Brightness Shift
with
Viewing Angle
Typical
for all LCDs
|
Small
Color Shifts
with
Viewing Angle
Large
Brightness Shift
with
Viewing Angle
Typical
for all LCDs
|
Small
Color Shifts
with
Viewing Angle
Large
Brightness Shift
with
Viewing Angle
Typical
for all LCDs
|
The iPhone 6 display has a relatively
large
decrease in Brightness with Viewing
Angle and
relatively small Color Shifts with
Viewing Angle.
See the Viewing
Angles
section for details.
|
|
Overall Display Assessment
Lab Tests and Measurements
|
Very Good LCD Display
|
Excellent LCD Display
|
Excellent LCD Display
|
The iPhone LCD Displays performed
very well in the Lab Tests and
Measurements.
|
|
|
|
Color Gamut
|
104
percent
sRGB /
Rec.709
|
101
percent
sRGB /
Rec.709
|
99 percent
sRGB /
Rec.709
|
sRGB
/ Rec.709 is the color standard for most
content
and needed for accurate color reproduction.
|
|
Absolute Color Accuracy
Measured over Entire Gamut
See Figure 2 and Colors
|
Good
Absolute
Color Accuracy
Medium
Color Errors
4.0 JNCD
|
Very Good
Absolute
Color Accuracy
Small
Color Errors
2.6 JNCD
|
Very Good
Absolute
Color Accuracy
Small
Color Errors
3.1 JNCD
|
Absolute
Color Accuracy is measured with a
Spectroradiometer
for 21 Reference Colors
uniformly
distributed within the entire Color Gamut.
See
Figure 2 and Colors
and Intensities for details.
|
|
Image Contrast Accuracy
See Figure 3 and Contrast
|
Very Good
Image
Contrast Accuracy
Slightly Too
High
Gamma 2.36
|
Excellent
Image
Contrast Accuracy
Close to
Standard
Gamma 2.22
|
Excellent
Image
Contrast Accuracy
Close to
Standard
Gamma 2.22
|
The
Image Contrast Accuracy is determined by
measuring
the Log Intensity Scale and Gamma.
See
Figure 3 and Brightness
and Contrast for details.
|
|
Performance in Ambient Light
Display Brightness
Screen Reflectance
Contrast Rating
See Brightness
and Contrast
See Screen
Reflections
|
High
Display Brightness
556 nits
Very Low
Reflectance
4.6
percent
High
Contrast Rating
for High
Ambient Light
121
|
High
Display Brightness
558 nits
Very Low
Reflectance
4.6
percent
High
Contrast Rating
for High
Ambient Light
121
|
High
Display Brightness
566 nits
Very Low
Reflectance
4.6
percent
High
Contrast Rating
for High
Ambient Light
123
|
Smartphones
are seldom used in the dark.
Screen
Brightness and Reflectance determine
the
Contrast Rating for High Ambient Light.
See
the Brightness
and Contrast section for details.
See
the Screen
Reflections section for details.
|
|
Overall Display Calibration
Image and Picture Quality
Lab Tests and Viewing Tests
|
Very Good Calibration
White Point
Somewhat Too
Blue
7,461 K
|
Very Good Calibration
White Point
Slightly Too
Blue
7,241 K
|
Very Good Calibration
White Point
Slightly Too
Blue
7,348 K
|
All of the iPhones have a slightly Bluish
White.
Some people prefer that but it does
affect all of
the Low Saturation Colors.
|
|
|
Overall Display Grade
Overall Assessment
|
Very Good
Display A–
But
Not
State-of-the-Art and
only 0.7
Mega Pixels
|
Very Good
Display A–
But
Would be
Excellent A except
only 1.0
Mega Pixels
|
Excellent
Display A
The Best
Performing LCD
that we
have ever tested
|
Both the iPhone 6 and 6 Plus have
Excellent LCD displays that deliver great performance across the board. They
are the Best Performing LCD displays that we have ever tested, but the iPhone
6 has been downgraded because it only has a 1.0 Mega Pixel display,
significantly lower than the 2.1 to 3.7 Mega Pixels found on all other
leading Smartphones.
|
|
|
iPhone 5
|
iPhone 6
|
iPhone 6
Plus
|
Comments
|
|
Screen Reflections
All display screens are mirrors good enough to use
for personal grooming – but that is actually a very bad feature…
We measured the light reflected from all directions
and also direct mirror (specular) reflections, which are much more
distracting and cause more eye strain. Many
Smartphones still have greater than 10 percent reflections that make the
screen much harder to read even in moderate ambient
light levels, requiring ever higher brightness settings that waste
precious battery power. Hopefully manufacturers
will reduce the mirror reflections with anti-reflection coatings and
matte or haze surface finishes.
Our Lab Measurements include Average Reflectance
for Ambient Light from All Directions and for Mirror Reflections.
All of the iPhones have approximately
same Reflectance because they are all very close to the minimum possible with
a cover Glass without optical coatings,
which would scratch easily and also be affected by fingerprints and dirt.
|
Categories
|
iPhone
5
|
iPhone
6
|
iPhone
6 Plus
|
Comments
|
|
Average Screen Reflection
Light From All Directions
|
4.6
percent
Ambient
Light Reflections
Excellent
|
4.6
percent
Ambient
Light Reflections
Excellent
|
4.6
percent
Ambient
Light Reflections
Excellent
|
Measured using an Integrating Hemisphere
and
a Spectroradiometer. The best value we
have
ever measured for a Smartphone is 4.4
percent.
|
|
Mirror Reflections
Percentage of Light Reflected
|
6.1 percent
for Mirror Reflections
Very Good
|
6.0 percent
for Mirror Reflections
Very Good
|
6.0 percent
for Mirror Reflections
Very Good
|
These are the most annoying types of
Reflections.
Measured using a Spectroradiometer and a
narrow
collimated pencil beam of light
reflected off the screen.
|
|
Brightness and Contrast
The Contrast Ratio
is the specification that gets the most attention, but it only applies for
low ambient light, which is seldom
the case for mobile displays. Much more important
is the Contrast Rating, which indicates how
easy it is to read the screen
under high ambient lighting and depends on both
the Maximum Brightness and the Screen Reflectance. The larger the better.
All of the iPhones have approximately
the same Brightness, Contrast Ratio, and Contrast Rating for High Ambient
Light.
This is due in part to the automated
factory calibration performed on each individual display at the factory.
Our tested iPhone 6 and 6 Plus units
have 12 to 14 percent higher Brightness and Contrast Ratios than the
“typical”
performance specifications listed on the
Apple website.
|
Categories
|
iPhone 5
|
iPhone 6
|
iPhone 6
Plus
|
Comments
|
|
Measured Average Brightness
50% Average Picture Level
|
Brightness
556 cd/m2
Excellent
|
Brightness
558 cd/m2
Excellent
|
Brightness
566 cd/m2
Excellent
|
This is the Brightness for typical
screen content
that has a 50% Average Picture Level.
|
|
Measured Full Brightness
100% Full Screen White
|
Brightness
556 cd/m2
Excellent
|
Brightness
558 cd/m2
Excellent
|
Brightness
566 cd/m2
Excellent
|
This is the Brightness for a screen that
is entirely
all white with 100% Average Picture
Level.
|
|
Measured Peak Brightness
1% Full Screen White
|
Brightness
556 cd/m2
Excellent
|
Brightness
558 cd/m2
Excellent
|
Brightness
566 cd/m2
Excellent
|
This is the Peak Brightness for a screen
that
has only a tiny 1% Average Picture
Level.
|
|
Measured Auto Brightness
in High Ambient Light
with Automatic Brightness On
|
Max Auto
Brightness
556 cd/m2
Excellent
|
Max Auto
Brightness
558 cd/m2
Excellent
|
Max Auto
Brightness
566 cd/m2
Excellent
|
Some displays including the iPhone 6
have
higher Brightness in Automatic
Brightness Mode.
|
|
Low Ambient Light
|
|
Lowest Peak Brightness
Brightness Slider to Minimum
|
5 cd/m2
Very Good
For Very
Low Light
|
6 cd/m2
Very Good
For Very
Low Light
|
5 cd/m2
Very Good
For Very
Low Light
|
This is the Lowest Brightness with the
Slider set to
Minimum. This is useful for working in
very dark
environments. Picture Quality remained
Excellent.
|
|
True Black Brightness at 0 lux
at Maximum Brightness Setting
|
0.41 cd/m2
Very Good
for Mobile
|
0.35 cd/m2
Very Good
for Mobile
|
0.39 cd/m2
Very Good
for Mobile
|
Black brightness is important for low
ambient light,
which is seldom the case for mobile
devices.
|
|
True Contrast Ratio at 0 lux
Relevant for Low Ambient Light
|
1,356
Very Good
for Mobile
|
1,592
Very Good
for Mobile
|
1,451
Very Good
for Mobile
|
Only relevant for Low Ambient Light,
which is seldom the case for mobile
devices.
|
|
High Ambient Light
|
|
Contrast Rating
for High Ambient Light
The Higher the Better
for Screen Readability
in High Ambient Light
|
121
Excellent
121
With Auto
Brightness
Excellent
|
121
Excellent
121
With Auto
Brightness
Excellent
|
123
Excellent
123
With Auto
Brightness
Excellent
|
Depends on the Screen Reflectance and
Brightness.
Defined as Maximum Brightness / Average Reflectance.
Some displays have higher Brightness
in Automatic Brightness Mode.
|
|
Screen Readability
in High Ambient Light
|
Excellent A
Excellent A
With Auto Brightness
|
Excellent A
Excellent A
With Auto Brightness
|
Excellent A
Excellent A
With Auto Brightness
|
Indicates how easy it is to read the
screen
under high ambient lighting. Depends on
both the Screen Reflectance and
Brightness.
See High
Ambient Light Screen Shots
|
|
Colors and Intensities
The Color Gamut, Intensity Scale, and White Point
determine the quality and accuracy of all displayed images and all
the image colors. Bigger is definitely Not Better
because the display needs to match all the standards that were used
when the content was produced. For LCDs a wider
Color Gamut reduces the power efficiency and the Intensity Scale
affects both image brightness and color mixture
accuracy.
The iPhone 6 and 6 Plus are much better
calibrated with significantly improved Absolute Color Accuracy and
with more accurate Intensity Scales and
Image Contrast. The iPhone 6 and 6 Plus continue with a Slightly Bluish
White Point, but somewhat less than the
iPhone 5. The White Point Accuracy is more critical than for other colors
because it affects all of the low
saturation colors and white is more noticeable because it often fills the
screen.
|
Categories
|
iPhone 5
|
iPhone 6
|
iPhone 6
Plus
|
Comments
|
|
Color of White
Color Temperature in degrees
See Figure 2 for JNCD
Measured in the dark at 0 lux
For the Plotted White Points
See Figure 1
|
7,461 K
2.7 JNCD
from D65 White
White is
Somewhat Bluish
See Figure 1
See Figure 2 for JNCD
|
7,241 K
2.0 JNCD
from D65 White
White is
Slightly Bluish
See Figure 1
See Figure 2 for JNCD
|
7,348 K
2.2 JNCD from
D65 White
White is
Slightly Bluish
See Figure 1
See Figure 2 for JNCD
|
D65 with 6,500 K is the standard color
of White
for most Consumer Content and needed for
accurate color reproduction of all
images.
JNCD is a Just Noticeable Color Difference.
White Point Accuracy is more critical than
other Colors.
See Figure 2 for the
definition of JNCD.
|
|
Color Gamut
Measured in the dark at 0 lux
See Figure 1
|
104
percent
sRGB /
Rec.709
Fairly
Close to Standard
See Figure 1
|
101
percent
sRGB /
Rec.709
Very Close
to Standard
See Figure 1
|
99 percent
sRGB /
Rec.709
Very Close
to Standard
See Figure 1
|
sRGB / Rec.709 is the color standard for
most
content and needed for accurate color
reproduction.
|
|
Color Accuracy
|
|
Absolute Color Accuracy
Average Color Error at 0 lux
For 21 Reference Colors
Just Noticeable Color Difference
See Figure 2
|
Average
Color Shift
From
sRGB/Rec.709
Δ(u’v’)
= 0.0160
4.0 JNCD
Good
Accuracy
See Figure 2
|
Average
Color Error
From
sRGB/Rec.709
Δ(u’v’)
= 0.0104
2.6 JNCD
Very Good
Accuracy
See Figure 2
|
Average
Color Error
From
sRGB/Rec.709
Δ(u’v’)
= 0.0123
3.1 JNCD
Very Good
Accuracy
See Figure 2
|
JNCD is a Just Noticeable Color Difference.
See Figure 2 for the
definition of JNCD and for
Accuracy Plots showing
the measured Color Errors.
Average Errors below 3.5 JNCD are Very
Good.
Average Errors 3.5 to 7.0 JNCD are Good.
Average Errors above 7.0 JNCD are
Poor.
|
|
Absolute Color Accuracy
Largest Color Error at 0 lux
For 21 Reference Colors
Just Noticeable Color Difference
See Figure 2
|
Largest Color Shift
From sRGB/Rec.709
Δ(u’v’)
= 0.0294
7.4 JNCD
for Cyan-Blue
Good
Accuracy
See Figure 2
|
Largest Color Error
From
sRGB/Rec.709
Δ(u’v’)
= 0.0191
4.8 JNCD
for Magenta-Red
Very Good
Accuracy
See Figure 2
|
Largest Color Error
From
sRGB/Rec.709
Δ(u’v’)
= 0.0224
6.1 JNCD
for Magenta
Very Good
Accuracy
See Figure 2
|
JNCD is a Just Noticeable Color Difference.
See Figure 2 for the
definition of JNCD and for
Accuracy Plots showing
the measured Color Errors.
Largest Errors below 7.0 JNCD are
Very Good.
Largest Errors 7.0 to 14.0 JNCD are
Good.
Largest Errors above 14.0 JNCD are
Poor.
This is twice the limit for the Average
Error.
|
|
Intensity Scale
|
|
Dynamic Brightness
Luminance Decrease with
Average Picture Level APL
|
0 percent
Decrease
Excellent
|
0 percent
Decrease
Excellent
|
0 percent
Decrease
Excellent
|
This is the percent Brightness decrease
with APL
Average Picture Level. Ideally should be
0 percent.
|
|
Intensity Scale and
Image Contrast
See Figure 3
|
Very
Smooth and Straight
Very Good
Slightly
Too Steep
See Figure 3
|
Very
Smooth and Straight
Excellent
Image Contrast
See Figure 3
|
Very
Smooth and Straight
Excellent
Image Contrast
See Figure 3
|
The Intensity Scale controls image
contrast needed
for accurate Image Contrast and Color
reproduction.
See Figure 3
|
|
Gamma for the Intensity Scale
Larger has more Image Contrast
See Figure 3
|
2.36
Very Good
Gamma
Slightly Too High
|
2.22
Excellent
Very Close
to Standard
|
2.22
Excellent
Very Close
to Standard
|
Gamma is the log slope of the Intensity
Scale.
Gamma of 2.20 is the standard and needed
for
accurate Image Contrast and Color
reproduction.
See Figure 3
|
|
Image Contrast Accuracy
|
Very Good
|
Excellent
|
Excellent
|
See Figure 3
|
|
Viewing Angles
The variation of
Brightness, Contrast, and Color with Viewing Angle is especially important
for Smartphones because
of their larger screen
and multiple viewers. The typical manufacturer 176+ degree specification for
LCD Viewing Angle
is nonsense because that
is where the Contrast Ratio falls to a miniscule 10. For most LCDs there are
substantial
degradations at less
than ±30 degrees, which is not an atypical Viewing Angle for Smartphones and
Tablets.
Note that the Viewing
Angle performance is also very important for a single viewer because the
Viewing Angle can vary
significantly based on
how the Smartphone is held. The Viewing Angle can be very large if resting on
a table or desk.
The
High Tech Display Enhancements that Apple mentioned really show up here…
The
iPhone 6 and 6 Plus have significantly better Viewing Angle performance than
the iPhone 5 or any other
LCD
that we have ever tested. Particularly important and noticeable are the much
higher Contrast Ratios and
the
lower Brightness Decrease with Viewing Angle. The Color Shifts with Viewing
Angle are also very small.
|
Categories
|
iPhone 5
|
iPhone 6
|
iPhone 6
Plus
|
Comments
|
|
Brightness Decrease
at a 30 degree Viewing Angle
|
–60
percent Portrait
–57
percent Landscape
Very Large
Decrease
Typical for
all LCDs
|
–44
percent Portrait
–57
percent Landscape
Very Large
Decrease
Typical for
all LCDs
|
–45 percent Portrait
–59
percent Landscape
Very Large
Decrease
Typical for
all LCDs
|
Most screens become less bright when
tilted.
LCD decrease is due to optical
absorption.
LCD decrease is generally greater than 50
percent.
|
|
Contrast Ratio at 0 lux
at a 30 degree Viewing Angle
|
743
Portrait
407 Landscape
Very Good
for Mobile
|
1010
Portrait
695 Landscape
Very Good
for Mobile
|
805
Portrait
664 Landscape
Very Good
for Mobile
|
A measure of screen readability when the
screen
is tilted under low ambient lighting.
|
|
White Point Color Shift
at a 30 degree Viewing Angle
|
Small
Color Shift
Δ(u’v’)
= 0.0077
1.9 JNCD
Very Good
|
Small
Color Shift
Δ(u’v’)
= 0.0037
0.9 JNCD Excellent
|
Small
Color Shift
Δ(u’v’)
= 0.0026
0.7 JNCD Excellent
|
JNCD is a Just Noticeable Color Difference.
See Figure 2 for the
definition of JNCD.
Same Rating Scale as Absolute Color
Accuracy.
|
|
Primary Color Shifts
Largest Color Shift for R,G,B
at a 30 degree Viewing Angle
|
Largest Color Shift
Δ(u’v’)
= 0.0077
for Pure
Blue
1.9 JNCD Very Good
|
Largest Color Shift
Δ(u’v’)
= 0.0052
for Pure
Blue
1.3 JNCD Excellent
|
Largest Color Shift
Δ(u’v’)
= 0.0060
for Pure
Blue
1.5 JNCD Excellent
|
JNCD is a Just Noticeable Color Difference.
See Figure 2 for the
definition of JNCD.
Same Rating Scale as Absolute Color
Accuracy.
|
|
Color Shifts for Color Mixtures
at a 30 degree Viewing Angle
Reference Brown (255, 128, 0)
|
Small
Color Shift
Δ(u’v’)
= 0.0098
2.4 JNCD Very Good
|
Small
Color Shift
Δ(u’v’)
= 0.0046
1.2 JNCD Excellent
|
Small
Color Shift
Δ(u’v’)
= 0.0053
1.3 JNCD Excellent
|
JNCD is a Just Noticeable Color Difference.
Color Shifts for non-IPS LCDs are about 10
JNCD.
Reference Brown is a good indicator of
color shifts
with angle because of unequal drive
levels and
roughly equal luminance contributions
from Red
and Green. See Figure 2 for the
definition of JNCD.
|
|
Display Power Consumption
The display power was measured using a Linear
Regression between Luminance and AC Power with a fully charged battery.
Since the displays all have different screen sizes
and maximum brightness, the values were also scaled to the
same screen brightness (Luminance) and same screen
area in order to compare their Relative Power Efficiencies.
Below we compare the Relative Display
Power Efficiencies of the iPhone 6 and 6 Plus with other LCD and OLED
Smartphones.
The results are all scaled for the same
brightness (Luminance) and same screen area.
Comparison with the iPhone 5
The iPhone 6 and 6 Plus have roughly
the same Display Power Efficiency as the iPhone 5.
All of the iPhones have Low Temperature
Poly Silicon LTPS Backplanes, which are currently the most power efficient
available.
Comparison with other Full
HD LCDs
iPhone 6 and 6 Plus are 10 percent more display power
efficient than the HTC One, the most power efficient of
the Full HD LCD
Smartphones that we tested, which has 468 ppi, which is a factor.
Comparison with OLEDs
LCDs are typically more power efficient for images with
mostly white content (like text screens, for example), while OLEDs
are more power efficient for mixed image content
because they are emissive displays so their power varies with the
Average Picture Level (average Brightness) of the image
content. For LCDs the display power is independent of image content.
For mixed image content (that includes photos, videos,
and movies, for example) with a typical 50 percent Average Picture Level,
the latest OLED Galaxy Note 4 display is 21 percent
more efficient than the iPhone 6 and 6 Plus displays. On the other hand, for
a
Full White Screen the iPhone 6 and 6 Plus are 45
percent more display power efficient than the latest OLED Galaxy Note 4
display.
|
|
Categories
|
iPhone 5
|
iPhone 6
|
iPhone 6
Plus
|
Comments
|
|
Average Display Power
Maximum Brightness at
50% Average Picture Level
|
0.74 watts
556 cd/m2
|
1.07 watts
558 cd/m2
|
1.52 watts
566 cd/m2
|
This measures the average display power
for
a wide range of image content.
|
|
Maximum Display Power
Full White Screen
at Maximum Brightness
|
0.74 watts
556 cd/m2
|
1.07 watts
558 cd/m2
|
1.52 watts
566 cd/m2
|
This measures the display power for a
screen
that is entirely Peak White.
|
|
Relative Power Efficiency
Same Luminance 556 cd/m2
Same 4.0 inch screen area
|
0.74 watts
326 ppi
|
0.77 watts
326 ppi
|
0.79 watts
401 ppi
|
This compares the Maximum Power
Efficiency
by scaling to the same screen brightness
and
same screen area as the iPhone 5.
|
About the Author
Dr. Raymond Soneira is
President of DisplayMate Technologies Corporation of Amherst, New Hampshire,
which produces display calibration, evaluation, and diagnostic products for
consumers, technicians, and manufacturers. See www.displaymate.com. He is a research
scientist with a career that spans physics, computer science, and television
system design. Dr. Soneira obtained his Ph.D. in Theoretical Physics from
Princeton University, spent 5 years as a Long-Term Member of the world famous
Institute for Advanced Study in Princeton, another 5 years as a Principal
Investigator in the Computer Systems Research Laboratory at AT&T Bell
Laboratories, and has also designed, tested, and installed color television
broadcast equipment for the CBS Television Network Engineering and Development
Department. He has authored over 35 research articles in scientific journals in
physics and computer science, including Scientific American. If you have any
comments or questions about the article, you can contact him at dtso.info@displaymate.com.
DisplayMate Display Optimization Technology
All
Smartphone and Tablets displays can be significantly improved using
DisplayMate’s proprietary very advanced scientific analysis and mathematical
display modeling and optimization of the display hardware, factory calibration,
and driver parameters. We help manufacturers with expert display procurement,
prototype development, testing displays to meet contract specifications, and
production quality control so that they don’t make mistakes similar to those
that are exposed in our public Display Technology Shoot-Out series for
consumers. This article is a lite version of our advanced scientific analysis –
before the benefits of our DisplayMate
Display Optimization Technology, which can correct or improve all of these
issues. If you are a display or product manufacturer and want to significantly
improve display performance for a competitive advantage then Contact DisplayMate Technologies.
About DisplayMate Technologies
DisplayMate Technologies specializes in proprietary advanced
scientific display calibration and mathematical display optimization to deliver
unsurpassed objective performance, picture quality and accuracy for all types
of displays including video and computer monitors, projectors, HDTVs, mobile
displays such as smartphones and tablets, and all display technologies
including LCD, LCD, 3D, LED, LCoS, Plasma, DLP and CRT. This article is a lite version of
our intensive scientific analysis of Smartphone and Smartphone mobile displays
– before the benefits of our advanced mathematical DisplayMate Display Optimization
Technology, which can correct or improve many of the display deficiencies. We offer DisplayMate display
calibration software for consumers and advanced DisplayMate display diagnostic
and calibration software for technicians and test labs.
For
manufacturers we offer Consulting Services that include advanced Lab testing
and evaluations, confidential Shoot-Outs with competing products, calibration
and optimization for displays, cameras and their User Interface, plus on-site
and factory visits. We help manufacturers with expert display procurement,
prototype development, and production quality control so they don’t make
mistakes similar to those that are exposed in our Display Technology Shoot-Out
series. See our world renown Display
Technology Shoot-Out public article series for an introduction and preview.
DisplayMate’s
advanced scientific optimizations can make lower cost panels look as good or
better than more expensive higher performance displays. If you are a display or
product manufacturer and want to turn your display into a spectacular one to
surpass your competition then Contact
DisplayMate Technologies to learn more.
Article Links: Samsung
Galaxy S5 Display Technology Shoot-Out
Article Links: Samsung
Galaxy Note 4 Display Technology Shoot-Out
Article Links: Full HD
LCD Smartphone Display Technology Shoot-Out
Article Links: iPhone
5 Display Technology Shoot-Out
Article Links: Display Technology Shoot-Out
Article Series Overview and Home Page
Copyright © 1990-2014 by DisplayMate
Technologies Corporation. All Rights Reserved.
This article, or any part
thereof, may not be copied, reproduced, mirrored, distributed or incorporated
into any other work without
the prior written permission of DisplayMate Technologies Corporation