Note that Complementary Colors lie directly across from one another through the White Point.
The 4 sets of triangles are the 25% 50% 75% and 100% Saturated Colors.
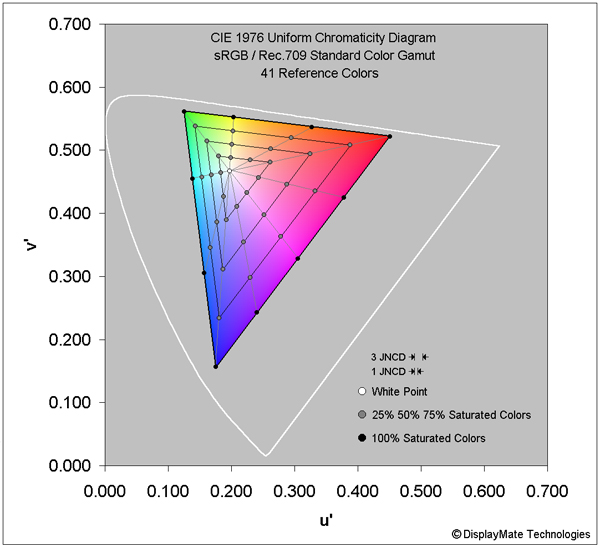
The colors in
Figure 2a
have been accurately calculated to show the real colors
within the sRGB / Rec.709 Gamut.
The colors shown in most published Color Gamuts are
fictitious and wildly incorrect.
There is a similar set of 41 Reference Colors for the DCI-P3 Color Gamut to
those shown for sRGB / Rec.709 in Figure 2a.
For an in-depth discussion and analysis of these Color Gamuts see this
article.
41 Reference Colors for the sRGB / Rec.709 Color Gamut Standard
Most existing consumer content
is based on the sRGB / Rec.709 Color Gamut Standard.
Figure 2a
above shows 41 Reference Colors for the
Standard sRGB / Rec.709 Color Gamut as White, Gray, and Black circles.
The 10 Black circles on the outer triangle
are the 100% fully Saturated Colors on the periphery.
The 3 inner sets of Gray triangles are the 25%, 50% and 75% Saturated Colors
between the inner White Point and the 100% Saturated Colors on the periphery.
The White circle is the White Point with 0% Color Saturation.
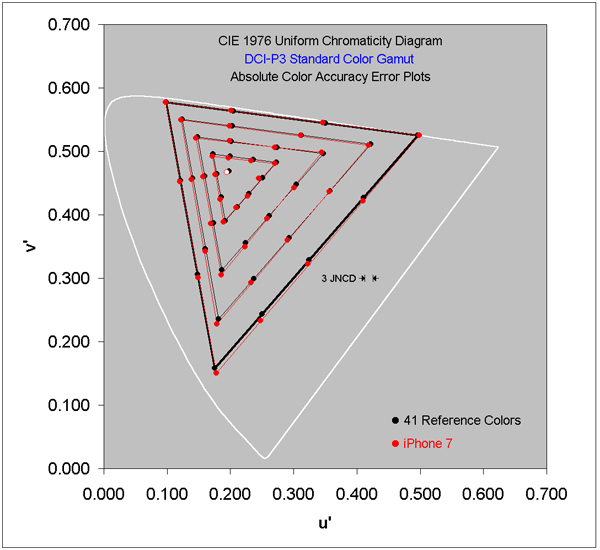
41 Reference Colors for the DCI-P3 Color Gamut Standard
The 41 Reference Colors for the DCI-P3 Color Gamut are shown in Black in
Figure 2c
below.
It is 26 percent larger by area compared to Figure 2a.
We have not included a Colorized version of DCI-P3
because it is quite similar,
and you would need to use a display with the DCI-P3 Gamut to actually
see the true colorized colors.
To see the Colorized Gamuts see this
article.
Uniform Color Diagrams
All color measurements are plotted on 1976 CIE Uniform Color Diagrams.
Note that the older 1931 CIE Diagrams that are published by many reviewers
are highly non-uniform and are meaningless for Color Accuracy.
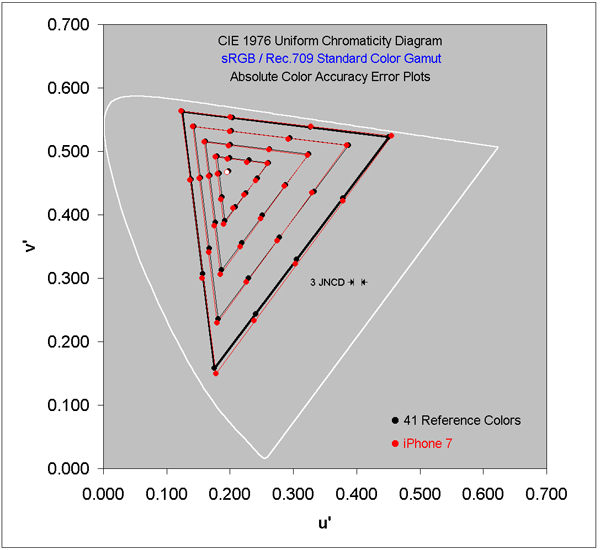
Absolute Color Accuracy Plots
Figure 2b
below shows the measured screen colors for the
sRGB / Rec.709 Reference Colors.
Figure 2c
below shows the measured screen colors for the
DCI-P3 Reference Colors.
Reference Colors
The
Reference Colors
in
Figures 2b-2c
are all shown as Black circles and the measured
Colors for each of the two Gamuts are shown as Red circles.
Color Errors smaller than the appropriate JNCD are not visually noticeable.
The 1 JNCD and 3 JNCD Errors are discussed next and are shown in
all of the Figures.
Just Noticeable Color Difference JNCD
The on-screen colors produced by any display can be measured using a
Spectroradiometer together with our proprietary DisplayMate Test Patterns.
The accuracy of the colors can then be calculated using the
1976 CIE Uniform Chromaticity color space and compared to the
eye's sensitivity to color.
We present the color accuracy and errors here in terms of
MPCD Minimum Perceptible Color Difference or
JNCD Just Noticeable Color Difference,
where 1 MPCD = 1 JNCD = Δ(u'v') = 0.0040 on the
CIE 1976 Uniform Chromaticity Scale.
JNCD for Displays
Color differences less than 1 JNCD are visually indistinguishable,
while values greater than 1 JNCD are visually noticeable, but only when the
two colors are touching on-screen.
When the colors are not touching and are further apart,
the visual threshold for Just Noticing a Color Difference is higher.
Here we will use 3 JNCD for the threshold of
a visually noticeable display color difference.
The 1 JNCD and 3 JNCD sizes are shown in the Figures below.
Any Display Color Error less than 3 JNCD on a display is not visually noticeable and appears perfectly accurate to the eye.
For an in-depth discussion and analysis of Absolute Color Accuracy see this
article.