iPad 2015 Display Technology Shoot-Out
iPad mini 4 and
iPad Air 2 and iPad Pro
Dr. Raymond M. Soneira
President, DisplayMate Technologies
Corporation
Copyright © 1990-2015 by DisplayMate
Technologies Corporation. All Rights Reserved.
This article, or any part
thereof, may not be copied, reproduced, mirrored, distributed or incorporated
into any other work without
the prior written permission of DisplayMate Technologies Corporation
Introduction
The key element for a great Tablet has always been a truly innovative
and top performing display, and the best leading edge Tablets have always
flaunted their beautiful high tech displays.
For 2015 there is a new broad product line of iPads –
from the small mini up to the new large Pro model, with display sizes that span
almost 3 to 1 in screen area. The displays have different applications and
performance criteria that we will measure and analyze below. The differences
and similarities in performance between the 3 iPad displays are really
interesting and surprising...
The Tablet revolution began with the launch of the first iPad in 2010,
and over the years the iPad displays have taken the lead with several major
innovations, but they have also periodically lagged behind the displays on
competing Tablets. Looking back, the iPad displays have gotten major performance
enhancements every two years (just like the iPhones but without the S
designations). To understand the various performance aspects of the latest iPad
displays we’ll first take a look at how they have evolved…
Early 9.7 inch iPads in 2010 – 2013
For 2010, the original iPad had a [1.0] leading edge 1024x768
display with 132 Pixels Per Inch (ppi) and a smallish 62 percent Color Gamut
that had noticeably lower color saturation. The next [2.0] cutting edge
development for Tablet displays arrived in 2012 on the iPad 3, which not only
doubled the resolution and ppi up to what Apple classifies as a Retina Display,
but also provided a much larger 99 percent Color Gamut, which delivered full
color saturation images.
Up through 2013 all of the iPads had relatively high screen reflections,
primarily from an air gap between the outer cover glass and the display,
resulting in a high Reflectance of 8.7 percent of the ambient light falling on
the screen, which was reduced with each succeeding generation down to 6.5 percent
for the iPad Air 1 in 2013. That may seem like a small percentage difference,
but it is their ratio that matters, so 6.5 percent reflects 25 percent less
ambient light than 8.7 percent.
iPad Air 2 in 2014
The next [3.0] cutting edge development for Tablet displays
arrived in 2014 on the iPad Air 2, which received a very innovative low
Reflectance screen that reflects just 2.5 percent of the ambient light by using
a new Anti-Reflection AR coating (together with eliminating the air gap). While
this was overlooked by most consumers, reviewers, and (even) manufacturers, it
was a major enhancement that reduced the reflected light glare from the screen
by a very impressive 62 percent compared to the iPad Air 1 (and even more for
the earlier iPads).
Reflected ambient light washes out the on-screen images, reducing both
their contrast and color saturation. Since [almost] no one looks at the screen
in absolute darkness, that 62 percent decrease in Reflectance significantly
increases the actual on-screen image contrast that you see in typical ambient
light by an incredible factor of 2.6X, and that also improves on-screen color
saturation. Stated another way, the earlier iPads had less than 38 percent of
the visual display contrast compared to the iPad Air 2 in typical ambient
light. The difference is very easy to see in side-by-side visual comparisons,
particularly when the displays are turned off so you just see the light
reflected by the screens.
A lower screen Reflectance also allows you to reduce the display
brightness setting in ambient light, which saves power and increases running
time on battery. Lowering screen Reflectance is a major display performance
improvement for real world viewing conditions!
Early 7.9 inch iPad minis in 2012 – 2014
The much anticipated smaller 7.9 inch iPad mini 1 launched in 2012, but
the mini’s display performance has always lagged the full size 9.7 inch iPads
by 1 to 2 generations. In 2013, the mini 2 was upgraded to a Retina Display but
still only received the lower 62 percent Color Gamut, which also continued for
the mini 3 in 2014. The mini screen Reflectance was even higher than the full
size iPads. The iPad mini was treated like the runt of the litter, but it has
now found favor and been transformed into a beautiful leading edge display on
the new iPad mini 4…
The iPads for 2015
For 2015, all of the current iPad displays have all of the enhancements
mentioned above. The iPad Air 2 continues on as the current 9.7 inch model, the
new 7.9 inch iPad mini 4 has received a slew of major display performance
improvements, and there is the brand new iPad Pro with a much larger 12.9 inch
display that is intended primarily for professional and advanced imaging
applications (and promoted as a laptop replacement).
The differences and similarities in performance between these 3 current
iPad displays are really interesting and surprising... We’ll cover these issues
and much more, with in-depth comprehensive display tests, measurements and
analysis that you will find nowhere else.
The Display Shoot-Out
To examine the
performance of the iPad mini 4, the iPad Air 2, and iPad Pro displays we ran our in-depth series of Mobile Display Technology
Shoot-Out Lab tests and measurements in order to determine how these latest
LCD Tablet displays have improved. We take display quality very seriously and
provide in-depth objective analysis based on detailed laboratory tests and
measurements and extensive viewing tests with both test patterns, test images
and test photos. To see how far mobile displays have progressed in just five
years see our 2010
Smartphone Display Shoot-Out, and for a real history lesson see our
original 2006
Smartphone Display Shoot-Out.
Results Highlights
In this Results section we provide Highlights of the
comprehensive DisplayMate Lab tests and measurements and extensive visual
comparisons using test photos, test images, and test patterns that are covered
in the advanced sections. The main Display
Shoot-Out Comparison Table summarizes the iPad
mini 4, the iPad Air 2, and iPad Pro Lab measurements in the following
categories: Screen
Reflections, Brightness
and Contrast, Colors
and Intensities, Viewing
Angles, LCD Spectra,
Display
Power. You can also skip these Highlights and go directly to the iPad Conclusions.
Overview of the iPads
All of the iPads have similar high performance IPS LCDs,
but with different performance enhancements. The iPad Air 2 and iPad Pro both
have Photo Aligned LCDs, which provides higher Contrast Ratios than the
traditional and more common mechanical alignment on the iPad mini 4. On top of
that, the iPad Pro has a Metal Oxide TFT Backplane that increases the light
throughput for the panel and therefore increases its power efficiency, which is
particularly important for such a large mobile LCD panel with a Backlight that
needs lots of battery power to keep all of its LEDs shinning.
All of the iPads have Retina Displays, which means that
their pixels are not resolved with normal 20/20 Vision at their typical viewing
distances. The smaller iPad mini 4 has a higher 326 Pixels Per Inch (ppi)
because it is typically viewed closer than the larger iPad Air 2 and iPad Pro,
which have 264 ppi. All the iPads appear perfectly sharp at their typical
viewing distances.
Because the iPad Pro has a much larger screen size, its
ppi results in a significantly higher resolution of 2732 x 2048 pixels, versus
2048x1536 pixels for the iPad mini 4 and iPad Air 2. All of the iPads have a
horizontal to vertical screen Aspect Ratio of 4:3, which is the same as
standard 8.5 x 11 inch paper documents (with 0.5 inch borders). Their most
important and significant difference is the almost 3 to 1 range in screen area.
Display Brightness and
Contrast Ratio
All of the iPads have fairly high Maximum Brightness,
from 415 cd/m2 (nits) for the iPad Air 2, to 424 nits for the iPad
Pro, and 450 nits for the iPad mini 4. High screen Brightness is only needed
when in High Ambient Light, so most of the time the Brightness should be set
lower than the maximum.
The Display’s Maximum Contrast is the Ratio between its
Peak White Brightness (Luminance) and its darkest Black Luminance, one of the
more important measures of LCD performance quality. All of the iPads have
fairly high True Contrast Ratios, from 967 for the iPad mini 4, to 1,064 for
the iPad Air 2, up to a very impressive 1,631 for the iPad Pro, the highest we
have ever measured for an LCD Tablet display. Note that some manufacturers list
a much higher (Dynamic) Contrast Ratio for their LCDs, but that is just
meaningless marketing puffery. See the Brightness
and Contrast section for measurements and details.
Color Gamut and Absolute Color Accuracy
Good Color Accuracy is particularly important for Tablets
because they provide much larger images than smartphones. Their accuracy has
been steadily improving as the result of providing close to 100 percent Color
Gamuts and more manufacturers are now using fully automated color calibration
with instruments at the factory instead of having assembly workers visually
tweaking the colors.
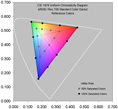
Producing high Absolute Color Accuracy is incredibly
difficult because everything on the display has to be done just right. In order
to deliver accurate image colors, a display needs a 100 percent sRGB / Rec.709
Standard Color Gamut that is used for producing virtually all current consumer
content for digital cameras, HDTVs, the internet, and computers, including
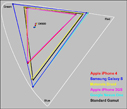
photos, videos, and movies. The iPad mini 4 has a very accurate 101 percent
Color Gamut, while the iPad Air 2 and iPad Pro have slightly too large 105 to
107 percent Color Gamuts, primarily from over saturated Blue primaries, which
reduces their Color Accuracy. See this Figure for the measured
Color Gamuts.
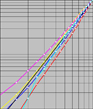
In order to produce high Absolute Color Accuracy a
display also needs an accurate (pure logarithmic power-law) Intensity Scale,
and an accurate White Point. The new iPads have fairly accurate Intensity
Scales with Gammas fairly close to the 2.2 standard, however, they all have
slightly bluish White Points, with Color Temperatures of 7,109K to 7,355K,
which is still (marginally) Very Good but reduces their overall Color Accuracy
somewhat because the White Point also affects all of the low saturation colors
in the Color Gamut. See this Figure
for a plot of the measured Intensity Scales and the Colors
and Intensities section for measurements and details.
The iPad mini 4 has a very impressive Absolute Color
Accuracy with Average/Maximum Color Errors of 1.9 and 4.2 JNCD – tied for first
place in Absolute Color Accuracy with the Microsoft Surface Pro 4. The iPad Pro
is somewhat less accurate, but still (just barely) Very Good, with
Average/Maximum Color Errors of 2.6 and 6.6 JNCD. The iPad Air 2 has noticeably
lower Absolute Color Accuracy with Average/Maximum Color Errors of 3.9 and 8.8
JNCD, which are visually noticeable and could be unacceptable for some color
critical applications (like medical imaging, high-end digital photography,
product sales demonstrations, and advertising proofs, for example)
See this Figure for an explanation
and visual definition of JNCD and the Color Accuracy Plots
showing the measured display Color Errors. See the Color
Accuracy section and the Color
Accuracy Plots for measurements and details.
Screen Reflectance and
Performance in Ambient Lighting
The screens on all displays are mirrors that reflect
light from everything that is illuminated anywhere in front of the screen
(especially anything behind the viewers), including lamps, ceiling lights,
windows, direct and indirect indoor and outdoor sunlight, which washes out the
on-screen colors, degrades image contrast, and interferes with seeing the
on-screen images. The lower the Screen Reflectance the better. In fact,
decreasing the Screen Reflectance by 50 percent doubles the effective Contrast
Ratio in Ambient Light, so it is very important.
To visually compare the differences in screen Reflectance for yourself,
hold any Tablets or Smartphones side-by-side and turn off the displays so you
just see the reflections. Those reflections are still there when you turn them
on, and the brighter the ambient light the brighter the reflections.
A major innovation for all of the current iPads is an Anti-Reflection AR
coating on the cover glass that reduces ambient light reflections by about 3:1
over most other Tablets and Smartphones (including the previous iPads), and
about 2:1 over all of the very best competing Tablets and Smartphones.
Right now all 3 current
iPads are the unrivaled record holders for display performance in ambient light
as a result of their record low screen Reflectance of 2.0 to 2.6 percent,
significantly lower than the 4.5 to 6.5 percent Reflectance found in all other
current competing Tablets. The iPad mini 4 is the best at 2.0 percent, with the
iPad Air 2 at 2.5 percent and the iPad Pro at 2.6 percent.
Our Contrast Rating for High
Ambient Light quantitatively measures screen visibility under bright
Ambient Light – the higher the better. As a result of its high Brightness and
very low Reflectance, the iPad mini 4 has a Contrast
Rating for High Ambient Light of 225, by far the highest that we have
ever measured. The iPad Air 2 has 166 and the iPad Pro has 163. See the Screen
Reflections and Brightness
and Contrast sections for measurements and details.
Viewing Angle Performance
While Tablets are
primarily single viewer devices, the variation in display performance with
Viewing Angle is still very important because single viewers frequently hold
the display at a variety of viewing angles, plus they are large enough for
sharing the screen with others. The angle is often up to 30 degrees, more if it
is resting on a table or desk.
The iPads all have IPS LCD
displays, so we expected them to show very small color shifts with Viewing
Angle, and our lab measurements confirmed their excellent Viewing Angle
performance, with no visually noticeable color shifts.
The display’s Contrast
Ratio also changes with Viewing Angle, and at 30 degrees the iPad Pro
maintained its high Contrast Ratio with 1,015 in Portrait mode and 974 in
Landscape mode, the highest we have ever measured for an LCD Tablet. The iPad
Air 2 and iPad min 4 Contrast Ratios at 30 degrees were both in the 400 to 650
range, which are much lower but still Very Good for mobile displays.
However, all LCDs do have
a strong decrease in Brightness (Luminance) with Viewing Angle, and all of the
iPads showed (as expected) a 55 to 60 percent decrease in Brightness at a
modest 30 degree viewing angle. See the Viewing
Angles section for measurements and details.
Viewing Tests
The iPads all provide very nice, pleasing and accurate
colors and picture quality. The very challenging set of DisplayMate Test and
Calibration Photos that we use to evaluate picture quality looked Beautiful, even to my experienced hyper-critical
eyes.
But in side-by-side visual comparisons of all 3 iPads, it
was clear that the iPad mini 4 provided the best and most accurate colors and
image contrast over a very wide range of photo and image content – the result
of its high Color Accuracy and very accurate Intensity Scale. See Figure 2 and Figure 3 and the Colors
and Intensities section for quantitative details.
Display Power Efficiency
There are many factors
that affect a display’s power efficiency, including the type of the White LEDs
that are used, the optics and optical films in the Backlight, the circuit
technology in the LCD Backplane, and the Pixels Per Inch.
After measuring the
power used by each display, we scaled them all to the same screen brightness
(Luminance) and the same screen area in order to compare their Relative Power
Efficiencies. The Display Power Efficiencies for the iPad mini 4 and iPad Pro
are 22% to 33% higher than the iPad Air 2.
The iPad Pro is the
most power efficient of the iPads for two reasons: it has a Metal Oxide
Backplane, which increases the light throughput for the panel, and the display
uses a lower refresh rate when the images remain static (like during our power
measurements). See the Display
Power section for measurements and details.
Conclusions for the 2015 iPads: All Very
Good to Excellent Top Tier Displays…
The primary goal of this Display Technology Shoot-Out
article series has always been to publicize and promote display excellence
so that consumers, journalists and even manufacturers are aware of and
appreciate the very best in displays and display technology. We point out which
manufactures and display technologies are leading and advancing the
state-of-the-art for displays by performing comprehensive and objective
scientific Lab tests and measurements together with in-depth analysis. We point
out who is leading, who is behind, who is improving, and sometimes
(unfortunately) who is back pedaling… all based solely on the extensive
objective careful Lab measurements that we also publish, so that everyone can
judge the data for themselves as well…
The Conclusions below summarize all of the major results.
See the main Display
Shoot-Out Comparison Table for all the DisplayMate Lab measurements and
test details, and see the Results Highlights section
above for a more detailed introduction and overview with expanded discussions
and explanations.
The 2015 iPad Displays
The new product line of iPads now includes small, medium,
and large displays, with sizes that span almost 3 to 1 in screen area. The
displays have different applications and performance criteria. The differences
and similarities in performance between the 3 iPad displays are really
interesting and surprising...
The nicest surprise this year is the tremendous
improvement in the display quality and performance of the iPad mini 4 after the
poor showings of previous minis – the mini 4 is now very impressive and breaks
many Tablet display performance records. The iPad Pro has also made a strong
entrance and first appearance.
As we analyze in detail below, the iPad mini 4 and iPad Pro both deliver
uniformly consistent all around Top Tier display performance: two of a small
number of displays to ever to get all Green (Very Good to Excellent) Ratings in
all test and measurement categories (except for Brightness variation with
Viewing Angle, which is the case for all LCDs) since we started the Display
Technology Shoot-Out article Series in 2006, an impressive achievement for a
display. The iPad Air 2 missed the all Green performance cut as the result of
its lower Yellow Absolute Color Accuracy (discussed below).
Right now all the iPads are the unrivaled record holders
for display performance in ambient light as a result of their record low screen
Reflectance of 2.0 to 2.6 percent, significantly lower than the 4.5 to 6.5
percent Reflectance found in all other current competing Tablets. As a result,
the iPads provide by far the highest on-screen image Contrast in ambient light
and the highest Contrast Rating for High Ambient Light of all current Tablet
displays. In the Next Generation of Displays section below
we’ll explain how the display performance in ambient light can be further
significantly improved.
Below we individually cover and analyze the display performance of iPad
mini 4, iPad Air 2, and iPad Pro displays
iPad mini 4
The iPad mini 4 is close to being a textbook perfect LCD display in all
of the Lab measurements and viewing tests. Among the iPads it takes first place
and is marked Best in every single test category except Contrast Ratio – where it has a
Very Good but not the highest Contrast Ratio of 957 in 0 lux (because Apple
didn’t provide a Photo Aligned LCD like on the Air 2 and Pro).
Among all existing Tablets of any size, the iPad mini 4 takes first
place and breaks performance records in many of the most important test categories
including: lowest screen Reflectance (2.0 percent), Highest Contrast Rating in
High Ambient Light (225), a near perfect Log-Straight Intensity Scale and Gamma
of 2.22, and the highest Absolute Color Accuracy (Average/Maximum Color Errors
of 1.9 and 4.2 JNCD – tied for first place with the Microsoft Surface
Pro 4). If Apple hadn’t intentionally made the display’s White Point so
bluish (7,109K instead of 6,500K) then the Color Errors would have been even
smaller.
There is just one qualification… if you will be viewing dark content or
need perfectly dark Black Levels, then an OLED display like the Samsung Galaxy Tab
S 8.4 will perform much better than an LCD display.
The iPad mini is small but has a gorgeous display – unquestionably the
best and most accurate LCD Tablet display that we have ever tested. If a 7.9
inch display is big enough, the iPad mini 4 is the best! See the Display
Shoot-Out Comparison Table for all of the measurements and details.
iPad Air 2
The iPad Air 2 has a Very Good display overall, but for almost all of
the tests and measurements it came in somewhat behind both the iPad mini 4 and
Pro – both are new for 2015 while the Air 2 was introduced in 2014, and the
unit we tested was our original from 2014. It is certainly possible that the
2015 iPad Air 2 production units have been improved, but we have not seen that
on previous iPad and iPhone models carried over from year to year.
While the iPad Air 2 performed very well overall, it did not take first
place in any of the tests, which is actually a nice demonstration of the steady
improvements in displays and display technology from year-to-year. It came in a
solid second place only once, with a Contrast Ratio of 1,064, 11 percent higher
than the mini 4 (which lacks a Photo Aligned LCD) but 35 percent behind the record
high 1,631 for the iPad Pro. In all other tests it was either tied for second
or a close behind third.
The one category where the iPad Air 2 received a disappointing Yellow
grade, was in Absolute Color Accuracy, where it had Average/Maximum Color Errors
of 3.9 and 8.8 JNCD, which are visually noticeable and could be unacceptable
for some color critical applications (like medical imaging, high-end digital
photography, product sales demonstrations, and advertising proofs, for
example). If better Absolute Color Accuracy is important then for this screen
size consider the Samsung Galaxy Tab
S 10.5 with Average/Maximum Color Errors of 2.1 and 4.0 JNCD or the Microsoft Surface 3
with 2.2 and 4.5 JNCD.
If Absolute Color Accuracy is not critical then the iPad Air 2 has a
Very Good all around medium size Tablet display. See the Display
Shoot-Out Comparison Table for all of the measurements and details.
iPad Pro
The iPad Pro is a large Tablet, with almost double the screen area of
the iPad Air 2, and almost triple the area of the iPad mini 4. Many professional
and imaging applications need or can benefit from a large display that you can
easily carry around, lay flat on a table, just hold, or rest on your lap. But
to qualify as a Professional grade display it needs to provide top image
quality and accuracy.
The iPad Pro display performed very well in all of our tests and
measurements, earning Very Good to Excellent in all test categories, performing
not quite as well as the iPad mini 4, but it came in or tied for second place
in every test except True Contrast Ratio in 0 lux, where it is the definitive
winner and marked Best with a record 1,631.
But in two test categories the Pro display was not quite stellar: first,
since 2012 all of the iPad and iPhone displays have had near perfect
Log-Straight Intensity Scales (something that no other manufacturer has yet
been able to match), but on the iPad Pro there is a significant Intensity Scale
bump and irregularity at and below 45 percent signal as shown in this Figure, a surprising
calibration issue for an Apple display (but still better than most competing
Tablets).
Second, in Absolute Color Accuracy the iPad Pro just barely qualified
for a Very Good Green rating, just 6 percent from the cutoff, where it has
Average/Maximum Color Errors of 2.6 and 6.6 JNCD, much better than the iPad Air
2, but no where near as good as the iPad mini 4, as shown in this Figure. If better Absolute
Color Accuracy is important, then for this screen size consider the Microsoft Surface
Pro 4 with Average/Maximum Color Errors of 1.9 and 4.1 JNCD – tied with the
iPad mini 4 for the most Color Accurate Tablet that we have ever tested.
The displays on the competing iPad Pro and Surface Pro 4 are both Very
Good to Excellent in all test categories. The most significant performance
differences are the iPad Pro’s much lower Screen Reflectance (2.6 versus 5.6
percent) and the Surface Pro 4’s much better Absolute Color Accuracy (listed
above).
If you need a large Professional grade Tablet with Very Good to
Excellent image quality and accuracy, the iPad Pro delivers a Top Tier
professional display. See the Display
Shoot-Out Comparison Table for all of the measurements and details.
Comparing Tablet Displays
You can
directly compare all of the display performance measurements and results for
many other Tablets by referring to our Mobile Display Technology Shoot-Out article series by using a
Tabbed web browser on the Comparison Table for each article. The entries for
all the articles are mostly identical with only minor formatting differences,
so it is easy to make detailed side-by-side comparisons by simply clicking
through the Tabs for each Tablet.
Below are
links for the Comparison Tables for the Tablets mentioned in the article:
Apple iPad
2015 Lab Measurements Comparison Table
Microsoft
Surface Pro 4 Lab Measurements Comparison Table
Microsoft
Surface 3 Lab Measurements Comparison Table
Samsung OLED
Tablet Lab Measurements Comparison Table
Apple iPad mini 3
Lab Measurements Comparison Table
The Next Generation of Displays – Better Performance in Ambient Light
Right now the iPads are the unrivaled record holders for
display performance in ambient light as a result of their record low screen
Reflectance of 2.0 to 2.6 percent, significantly lower than the 4.5 to 6.5
percent Reflectance currently found in all other current competing Tablets.
Apple has taken an important first step towards improving
display performance in ambient light. But essentially all displays are still
designed to work best in absolute darkness, but they all significantly degrade
in even modest levels of ambient light. However, Microsoft has also taken an
important initial step, with the Surface 3
providing its best Color Accuracy in typical indoor 300 lux ambient light
rather than in absolute darkness like everybody else…
The best performing LCD and OLED displays are now
delivering impressive sharpness, brightness, low reflectance, high color
accuracy, accurate image contrast, and great viewing angles. So what comes
next? Essentially all published display specifications and factory calibrations
are based on performance in absolute darkness 0 lux, but mobile displays (and
even TVs) are seldom viewed in the dark. Even low levels of ambient light
significantly affect the image and picture quality. For example, the 100
percent sRGB Color Gamut specified by many manufacturers only applies at 0 lux.
At 500 lux, which corresponds to typical indoor office lighting, the on-screen
colors are washed out by the reflected ambient light, typically reducing the
on-screen Color Gamut from 100 percent down to 80 percent, plus the image
contrast is also significantly affected. And it gets worse as the ambient light
levels increase.
So here is what needs to come next…
The most important improvements for both LCD and OLED
displays will come from improving their image and picture quality and screen
readability in real world ambient light, which washes out the screen images,
resulting in reduced image contrast, color saturation, and color accuracy. The
key will be in lowering screen Reflectance and then implementing Dynamic Color
Management with automatic real-time modification of a larger Color Gamut and
Intensity Scale based the measured Ambient Light level in order to have them
compensate for the reflected light glare and image wash out from ambient light
as discussed in our 2014
Innovative Displays and Display Technology and SID
Display Technology Shoot-Out articles.
The higher the ambient light level, the larger the Color
Gamut that the display needs in order to compensate for the loss of color
saturation from the reflected ambient light. All LCDs will need Quantum
Dots in order to implement the necessary large Color Gamuts.
The displays, technologies, and
manufacturers that succeed in implementing this new real world high ambient
light performance strategy will take the lead in the next generations of mobile
displays… Follow DisplayMate
on Twitter to learn about these developments and our upcoming display
technology coverage.
DisplayMate Display Optimization Technology
All Tablet
and Smartphone displays can be significantly improved using DisplayMate’s
proprietary very advanced scientific analysis and mathematical display modeling
and optimization of the display hardware, factory calibration, and driver
parameters. We help manufacturers with expert display procurement, prototype
development, testing displays to meet contract specifications, and production
quality control so that they don’t make mistakes similar to those that are
exposed in our public Display Technology Shoot-Out series for consumers. This
article is a lite version of our advanced scientific analysis – before the
benefits of our DisplayMate
Display Optimization Technology, which can correct or improve all of these
issues. If you are a display or product manufacturer and want to significantly
improve display performance for a competitive advantage then Contact DisplayMate Technologies.
Display Shoot-Out Comparison Table
Below we
examine in-depth the LCD displays on the Apple iPad
mini 4, the
iPad Air 2, and iPad Pro based on objective Lab measurement data and criteria. For
comparisons and additional background information refer to these comparable
Tablet displays: Microsoft Surface
Pro 4 Display Technology Shoot-Out, the Microsoft Surface 3
Display Technology Shoot-Out, and the Samsung OLED Tab S
Display Technology Shoot-Out.
For
comparisons with the other leading Tablet, Smartphone, and Smart Watch displays
see our Mobile Display
Technology Shoot-Out series.
|
Categories
|
iPad
mini 4
|
iPad Air
2
|
iPad Pro
|
Comments
|
|
Display Technology
|
7.9 inch
Diagonal
IPS LCD
|
9.7 inch
Diagonal
IPS LCD
Photo Aligned LCD
|
12.9
inch Diagonal
IPS LCD
Photo Aligned LCD
Metal Oxide TFT
|
The diagonal screen size.
Liquid Crystal Display
In Plane Switching
|
|
Screen Shape
|
4:3 =
1.33
Aspect
Ratio
|
4:3 =
1.33
Aspect
Ratio
|
4:3 =
1.33
Aspect
Ratio
|
The iPads have the same shape as 8.5x11
paper.
|
|
Screen Size
|
6.3 x 4.7
inches
|
7.8 x 5.8
inches
|
10.3 x 7.7
inches
|
Display Width and Height in inches.
|
|
Screen Area
|
29.6
Square Inches
|
45.1
Square Inches
|
80.3
Square Inches
|
A better measure of size than the
diagonal length.
|
|
Relative Screen Area for mini 4
|
100 percent
|
153
percent
|
271
percent
|
Relative screen areas compared to the
iPad mini 4.
|
|
Relative Screen Area for Air 2
|
66 percent
|
100 percent
|
178
percent
|
Relative screen areas compared to the
iPad Air 2.
|
|
Relative Screen Area for Pro
|
37 percent
|
56 percent
|
100 percent
|
Relative screen areas compared to the
iPad Pro.
|
|
Display Resolution
|
2048 x
1536 pixels
Full High
Definition+
Very Good
|
2048 x
1536 pixels
Full High
Definition+
Very Good
|
2732 x
2048 pixels
Full High
Definition+
Very Good
|
Screen Pixel Resolution.
|
|
Total Number of Pixels
|
3.1 Mega
Pixels
Very Good
|
3.1 Mega
Pixels
Very Good
|
5.6 Mega
Pixels
Very Good
|
Total Number of Pixels.
|
|
Pixels Per Inch
|
326 PPI
Very Good
|
264 PPI
Very Good
|
264 PPI
Very Good
|
Sharpness depends on the viewing distance
and PPI.
See this on
the visual acuity for a true Retina Display
|
|
20/20 Vision Distance
where Pixels or Sub-Pixels
are Not Resolved
|
10.5 inches
or more
with 20/20
Vision
|
13.0 inches
or more
with 20/20
Vision
|
13.0 inches
or more
with 20/20
Vision
|
For 20/20 Vision the minimum Viewing
Distance
where the screen appears perfectly sharp
to the eye.
|
|
Display Sharpness
at Typical Viewing Distances
|
Display
normally appears Perfectly Sharp
Typical 12
inches or more
Pixels are
not Resolved with 20/20 Vision
|
Display
normally appears
Perfectly
Sharp
Typical 14
inches or more
Pixels are
not Resolved with 20/20 Vision
|
Display
normally appears
Perfectly
Sharp
Typical 16
inches or more
Pixels are
not Resolved with 20/20 Vision
|
The Typical Viewing Distances are:
12 inches or more for the iPad mini 4.
14 inches or more for the iPad Air 2.
16 inches or more for the iPad Pro.
|
|
Appears Perfectly Sharp
at Typical Viewing Distances
|
Yes
|
Yes
|
Yes
|
Typical Viewing Distances are listed
above.
|
|
Photo Viewer Color Depth
|
Full
24-bit Color
No
Dithering Visible
256
Intensity Levels
|
Full
24-bit Color
No
Dithering Visible
256
Intensity Levels
|
Full 24-bit
Color
No
Dithering Visible
256
Intensity Levels
|
Many Android Tablets still have some
form of 16-bit color
depth in the Gallery Viewer.
The iPads do not have this issue.
|
|
Overall Assessments
This section summarizes
the results for all of the extensive Lab Measurements and Viewing Tests
performed on the display
See Screen
Reflections, Brightness
and Contrast, Colors
and Intensities, Viewing
Angles, LCD
Spectra, Display
Power.
|
Categories
|
iPad
mini 4
|
iPad Air
2
|
iPad Pro
|
Comments
|
|
Viewing Tests
in Subdued Ambient Lighting
|
Excellent
Images
Photos and
Videos
have
Excellent Color
and
Accurate Contrast
|
Very Good
Images
Photos and
Videos
have Very
Good Color
and
Accurate Contrast
|
Very Good
Images
Photos and
Videos
have Very
Good Color
and
Accurate Contrast
|
The Viewing Tests examine the accuracy
of
photographic images by comparing the
displays
to an calibrated studio monitor and
HDTV.
|
|
Variation with Viewing Angle
Colors and Brightness
See Viewing
Angles
|
Small Color
Shifts
with
Viewing Angle
Very Good
Large
Brightness Shift
with
Viewing Angle
Typical for
all LCDs
|
Small Color
Shifts
with Viewing
Angle
Very Good
Large
Brightness Shift
with
Viewing Angle
Typical for
all LCDs
|
Small Color
Shifts
with
Viewing Angle
Very Good
Large
Brightness Shift
with
Viewing Angle
Typical for
all LCDs
|
The iPad displays all have a relatively
large
decrease in Brightness with Viewing
Angle and
relatively small Color Shifts with
Viewing Angle.
See the Viewing
Angles
section for details.
|
|
Overall Display Assessment
Lab Tests and Measurements
|
Excellent
LCD Display
|
Very Good
LCD Display
|
Excellent
LCD Display
|
The iPad displays all performed
very well in the Lab Tests and
Measurements.
|
|
|
|
Color Gamut
|
101 percent
sRGB /
Rec.709
Best
|
107 percent
sRGB /
Rec.709
|
105 percent
sRGB /
Rec.709
|
sRGB
/ Rec.709 is the color standard for most
content
and needed for accurate color reproduction.
|
|
Absolute Color Accuracy
Measured over Entire Gamut
See Figure 2 and Colors
|
Excellent
Color Accuracy
Small
Color Errors
Average
1.9 JNCD
Maximum
4.2 JNCD
Best
|
Good Color
Accuracy
Medium
Color Errors
Average
3.9 JNCD
Maximum
8.8 JNCD
|
Very Good
Color Accuracy
Small
Color Errors
Average
2.6 JNCD
Maximum
6.6 JNCD
|
Absolute
Color Accuracy is measured with a
Spectroradiometer
for 21 Reference Colors
uniformly
distributed within the entire Color Gamut.
See
Figure 2 and Colors
and Intensities for details.
|
|
Image Contrast Accuracy
Logarithmic Intensity Scale
See Figure 3 and Contrast
|
Excellent
Image
Contrast Accuracy
Close to
Perfect
Gamma 2.22
Best
|
Excellent
Image
Contrast Accuracy
Close to
Standard
Gamma 2.25
|
Very Good
Image
Contrast Accuracy
Slightly
Irregular
Average
Gamma 2.13
|
The
Image Contrast Accuracy is determined by
measuring
the Log Intensity Scale and Gamma.
See
Figure 3 and Brightness
and Contrast for details.
|
|
True Contrast Ratio at 0 lux
Relevant for Low Ambient Light
|
957
Very Good
for Mobile
|
1,064
Very Good
for Mobile
|
1,631
Very Good
for Mobile
Best
|
Only relevant for Low Ambient Light,
which is seldom the case for mobile
devices.
|
|
Performance in Ambient Light
Display Brightness
Screen Reflectance
Contrast Rating
for High Ambient Light
See Brightness
and Contrast
See Screen
Reflections
|
High
Display Brightness
450 nits
Record Low
Reflectance
2.0
percent
Best
Record
Contrast Rating
for High
Ambient Light
225 Excellent
|
High
Display Brightness
415 nits
Very Low
Reflectance
2.5
percent
Very High
Contrast Rating
for High
Ambient Light
166 Excellent
|
High
Display Brightness
424 nits
Very Low
Reflectance
2.6
percent
Very High
Contrast Rating
for High
Ambient Light
163 Excellent
|
Tablets
are seldom used in the dark.
Screen
Brightness and Reflectance determine
the
Contrast Rating for High Ambient Light.
See
the Brightness
and Contrast section for details.
See
the Screen
Reflections section for details.
|
|
Overall Display Calibration
Image and Picture Quality
Lab Tests and Viewing Tests
|
Excellent
Calibration
Best
But White Point is
Slightly Too
Blue
7,109 K
|
Very Good
Calibration
But White Point is
Somewhat Too
Blue
7,355 K
|
Very Good
Calibration
But White Point is
Slightly Too
Blue
7,164 K
|
All of the iPads have a slightly Bluish
White.
Some people prefer that but it does
affect all of
the Low Saturation Colors.
|
|
|
Overall Display Grade
Overall Assessment
|
All
2015 iPads have Recommended Top Tier Displays
|
The iPads all have uniformly Very Good to
Excellent
Top Tier Display Performance.
All have an Innovative Anti-Reflection
screen coating.
|
|
Excellent
Display A
Small Size
Tablet
Innovative
Anti-Reflection
|
Very Good
Display A–
Medium Size
Tablet
Innovative
Anti-Reflection
|
Very Good
Display A–
Large Size
Tablet
Innovative
Anti-Reflection
|
|
|
iPad
mini 4
|
iPad Air
2
|
iPad Pro
|
Comments
|
|
Screen Reflections
All display screens are mirrors good enough to use
for personal grooming – but that is actually a very bad feature…
We measured the light reflected from all directions
and also direct mirror (specular) reflections, which are much more
distracting and cause more eye strain. Many Tablets
still have greater than 5 percent reflections that make the
screen much harder to read even in moderate ambient
light levels, requiring ever higher brightness settings that waste
precious battery power. Hopefully, manufacturers
will reduce the Reflections with anti-reflection coatings and also
the Mirror Reflections matte or haze surface
finishes.
Our Lab Measurements include Average Reflectance
for Ambient Light from All Directions and for Mirror Reflections.
All the iPads have a bonded Cover Glass
without an Air Gap.
All the iPads have a very innovative
Anti-Reflection screen coating that produces the
Lowest Reflectance that we have ever
measured for a Tablet or Smartphone.
|
Categories
|
iPad
mini 4
|
iPad
Air 2
|
iPad
Pro
|
Comments
|
|
Average Screen Reflection
Light From All Directions
|
2.0
percent
Ambient
Light Reflections
Record Low
Outstanding
|
2.5
percent
Ambient
Light Reflections
Very Low
Outstanding
|
2.6
percent
Ambient
Light Reflections
Very Low
Outstanding
|
Measured using an Integrating Hemisphere
and
a Spectroradiometer. The best value we
have
ever measured for a Tablet is 2.0
percent.
|
|
Relative Brightness of the
Reflected Ambient Light
|
Lowest
Reflected Glare
|
25 percent
more Light Glare
|
30 percent
more Light Glare
|
Relative Brightness of the Reflected
Ambient Light
Expressed as a percentage of the lowest
amount.
|
|
Mirror Reflections
Percentage of Light Reflected
|
2.6 percent
for Mirror Reflections
Record Low
Outstanding
|
2.9 percent
for Mirror Reflections
Very Low
Outstanding
|
2.8 percent
for Mirror Reflections
Very Low
Outstanding
|
These are the most annoying types of
Reflections.
Measured using a Spectroradiometer and a
narrow
collimated pencil beam of light
reflected off the screen.
|
|
Cover Glass with Display
|
Bonded Cover Glass
Laminated Display
Anti-Reflection
Coating
|
Bonded Cover Glass
Laminated Display
Anti-Reflection
Coating
|
Bonded Cover Glass
Laminated Display
Anti-Reflection
Coating
|
The Cover Glass and other optical layers
above the
Display have a significant impact on the
Reflectance.
|
|
Brightness and Contrast
The Contrast Ratio
is the specification that gets the most attention, but it only applies for
low ambient light, which is seldom
the case for mobile displays. Much more important
is the Contrast Rating, which indicates how
easy it is to read the screen
under high ambient lighting and depends on both
the Maximum Brightness and the Screen Reflectance. The larger the better.
The display’s actual Contrast Ratio
changes with the Ambient Light lux level and is proportional to the Contrast
Rating.
The iPad mini 4 has the Highest Contrast
Rating for High Ambient Light that we have ever measured as the result of its
Low Reflectance.
The display’s actual Contrast Ratio
changes with the Ambient Light lux level and is proportional to the Contrast
Rating.
|
Categories
|
iPad
mini 4
|
iPad Air
2
|
iPad Pro
|
Comments
|
|
Measured Full Brightness
100% Full Screen White
|
Brightness
450 cd/m2
Very Good
|
Brightness
415 cd/m2
Very Good
|
Brightness
424 cd/m2
Very Good
|
This is the Brightness for a screen that
is entirely
all white with 100% Average Picture
Level.
|
|
Measured Peak Brightness
1% Full Screen White
|
Brightness
450 cd/m2
Very Good
|
Brightness
415 cd/m2
Very Good
|
Brightness
424 cd/m2
Very Good
|
This is the Peak Brightness for a screen
that
has only a tiny 1% Average Picture
Level.
|
|
Measured Auto Brightness
in High Ambient Light
with Automatic Brightness On
|
Max Auto
Brightness
450 cd/m2
Very Good
|
Max Auto
Brightness
415 cd/m2
Very Good
|
Max Auto
Brightness
424 cd/m2
Very Good
|
Some displays have a higher Maximum
Brightness
in Automatic Brightness Mode.
|
|
Low Ambient Light
|
|
Lowest Peak Brightness
Brightness Slider to Minimum
|
5 cd/m2
Very Good
for Low Light
|
5 cd/m2
Very Good
for Low Light
|
4 cd/m2
Very Good
for Low Light
|
The Lowest Brightness with the Slider
set to Minimum. This is useful for working in very dark environments.
|
|
True Black Brightness at 0 lux
at Maximum Brightness Setting
|
0.47 cd/m2
Very Good
for Mobile
|
0.39 cd/m2
Very Good
for Mobile
|
0.26 cd/m2
Very Good
for Mobile
|
Black brightness is important for low
ambient light,
which is seldom the case for mobile
devices.
|
|
True Contrast Ratio at 0 lux
Relevant for Low Ambient Light
|
957
Very Good
for Mobile
|
1,064
Very Good
for Mobile
|
1,631
Very Good
for Mobile
|
Only relevant for Low Ambient Light,
which is seldom the case for mobile
devices.
|
|
High Ambient Light
|
|
Contrast Rating
for High Ambient Light
The Higher the Better
for Screen Readability
in High Ambient Light
|
225
Excellent
225
With Auto
Brightness
Excellent
|
166
Excellent
166
With Auto
Brightness
Excellent
|
163
Excellent
163
With Auto
Brightness
Excellent
|
Depends on the Screen Reflectance and
Brightness.
Defined: Maximum Brightness / Average Reflectance.
The display’s actual Contrast Ratio
changes with
the Ambient Light lux level and is
proportional to
the Contrast Rating.
|
|
Screen Readability
in High Ambient Light
|
Excellent A
Excellent A
With Auto Brightness
|
Excellent A
Excellent A
With Auto Brightness
|
Excellent A
Excellent A
With Auto Brightness
|
Indicates how easy it is to read the
screen
under high ambient lighting. Depends on
both the Screen Reflectance and
Brightness.
See High
Ambient Light Screen Shots
|
|
Colors and Intensities
The Color Gamut, Intensity Scale, and White Point
determine the quality and accuracy of all displayed images and all
the image colors. Bigger is definitely Not Better
because the display needs to match all the standards that were used
when the content was produced. For LCDs a wider
Color Gamut reduces the power efficiency and the Intensity Scale
affects both image brightness and color mixture
accuracy.
All of the iPads continue with a
Slightly Bluish White Point. The White Point Accuracy is more critical than
for other
colors because it affects all of the low
saturation colors and white is more noticeable because it often fills the
screen.
The Bluish White Point results in
somewhat higher Absolute Color Errors over the entire Color Gamut.
As a result the largest Color Error is
often for Magenta because it is the furthest away from the White Point.
|
Categories
|
iPad
mini 4
|
iPad Air
2
|
iPad Pro
|
Comments
|
|
Color of White
Color Temperature in degrees
See Figure 2 for JNCD
Measured in the dark at 0 lux
For the Plotted White Points
See Figure 1
|
7,109 K
1.6 JNCD
from D65 White
White is Slightly
Bluish
See Figure 1
See Figure 2 for JNCD
|
7,355 K
2.4 JNCD
from D65 White
White is
Somewhat Bluish
See Figure 1
See Figure 2 for JNCD
|
7,164 K
1.8 JNCD
from D65 White
White is
Slightly Bluish
See Figure 1
See Figure 2 for JNCD
|
D65 with 6,500 K is the standard color
of White
for most Consumer Content and needed for
accurate color reproduction of all
images.
JNCD is a Just Noticeable Color Difference.
White Point Accuracy is more critical than
other Colors.
See Figure 2 for the
definition of JNCD.
|
|
Color Gamut
Measured in the dark at 0 lux
See Figure 1
|
101 percent
sRGB /
Rec.709
Very Close
to Standard
See Figure 1
|
107 percent
sRGB /
Rec.709
Fairly
Close to Standard
See Figure 1
|
105 percent
sRGB /
Rec.709
Fairly
Close to Standard
See Figure 1
|
sRGB / Rec.709 is the color standard for
most
content and needed for accurate color
reproduction.
|
|
Color Accuracy
|
|
Absolute Color Accuracy
Average Color Error at 0 lux
For 21 Reference Colors
Just Noticeable Color Difference
See Figure 2
|
Average Color Error
From sRGB
/ Rec.709
Δ(u’v’)
= 0.0077
1.9 JNCD
Excellent
Accuracy
See Figure 2
|
Average Color Error
From sRGB
/ Rec.709
Δ(u’v’)
= 0.0155
3.9 JNCD
Good
Accuracy
See Figure 2
|
Average Color Error
From sRGB
/ Rec.709
Δ(u’v’)
= 0.0103
2.6 JNCD
Very Good
Accuracy
See Figure 2
|
JNCD is a Just Noticeable Color Difference.
See Figure 2 for the
definition of JNCD and for
Accuracy Plots showing
the measured Color Errors.
Average Errors below 3.5 JNCD are Very
Good.
Average Errors 3.5 to 7.0 JNCD are
Good.
Average Errors above 7.0 JNCD are
Poor.
|
|
Absolute Color Accuracy
Largest Color Error at 0 lux
For 21 Reference Colors
Just Noticeable Color Difference
See Figure 2
|
Largest Color Shift
From sRGB
/ Rec.709
Δ(u’v’)
= 0.0167
4.2 JNCD
for Magenta
Very Good
Accuracy
See Figure 2
|
Largest Color Error
From sRGB
/ Rec.709
Δ(u’v’)
= 0.0350
8.8 JNCD
for Magenta
Good
Accuracy
See Figure 2
|
Largest Color Error
From sRGB
/ Rec.709
Δ(u’v’)
= 0.0263
6.6 JNCD
for Blue
Very Good
Accuracy
See Figure 2
|
JNCD is a Just Noticeable Color Difference.
See Figure 2 for the
definition of JNCD and for
Accuracy Plots showing
the measured Color Errors.
Largest Errors below 7.0 JNCD are Very
Good.
Largest Errors 7.0 to 14.0 JNCD are
Good.
Largest Errors above 14.0 JNCD are
Poor.
This is twice the limit for the Average
Error.
|
|
Intensity Scale
|
|
Dynamic Brightness
Luminance Decrease with
Average Picture Level APL
|
0 percent
Decrease
Excellent
|
0 percent
Decrease
Excellent
|
0 percent
Decrease
Excellent
|
This is the percent Brightness decrease
with APL
Average Picture Level. Ideally should be
0 percent.
|
|
Logarithmic Intensity Scale
and Image Contrast
See Figure 3
|
Very
Smooth and Straight
Excellent
Image Contrast
See Figure 3
|
Very
Smooth and Straight
Excellent
Image Contrast
See Figure 3
|
Slightly
Irregular
Very Good
Image Contrast
See Figure 3
|
The Intensity Scale controls image
contrast needed
for accurate Image Contrast and Color
reproduction.
See Figure 3
|
|
Gamma for the Intensity Scale
Larger has more Image Contrast
See Figure 3
|
2.22
Excellent
Close to
Perfect
|
2.25
Excellent
Very Close
to Standard
|
Average
2.13
Very Good
But
Slightly Too Low
|
Gamma is the log slope of the Intensity
Scale.
Gamma of 2.20 is the standard and needed
for
accurate Image Contrast and Color
reproduction.
See Figure 3
|
|
Image Contrast Accuracy
|
Excellent
|
Excellent
|
Very Good
|
See Figure 3
|
|
Viewing Angles
The variation of
Brightness, Contrast, and Color with Viewing Angle is especially important
for Tablets because
of their larger screen
and multiple viewers. The typical manufacturer 176+ degree specification for
LCD Viewing Angle
is nonsense because that
is where the Contrast Ratio falls to a miniscule 10. For most LCDs there are
substantial
degradations at less
than ±30 degrees, which is not an atypical Viewing Angle for Tablets and
Smartphones.
Note that the Viewing
Angle performance is also very important for a single viewer because the
Viewing Angle can vary
significantly based on
how the Tablet is held. The Viewing Angle can be very large if resting on a
table or desk.
|
Categories
|
iPad
mini 4
|
iPad Air
2
|
iPad Pro
|
Comments
|
|
Brightness Decrease
at a 30 degree Viewing Angle
|
–58
percent Portrait
–59
percent Landscape
Very Large
Decrease
Typical for
all LCDs
|
–62 percent Portrait
–58
percent Landscape
Very Large
Decrease
Typical for
all LCDs
|
–56 percent Portrait
–56
percent Landscape
Very Large
Decrease
Typical for
all LCDs
|
Most screens become less bright when
tilted.
LCD decrease is generally greater than 50
percent.
|
|
Contrast Ratio at 0 lux
at a 30 degree Viewing Angle
|
573
Portrait
414 Landscape
Very Good
for Mobile
|
650
Portrait
500 Landscape
Very Good
for Mobile
|
1,015
Portrait
974 Landscape
Very Good
for Mobile
|
A measure of screen readability when the
screen
is tilted under low ambient lighting.
|
|
White Point Color Shift
at a 30 degree Viewing Angle
|
Small
Color Shift
Δ(u’v’)
= 0.0076
1.9 JNCD Excellent
|
Small
Color Shift
Δ(u’v’)
= 0.0033
0.8 JNCD Excellent
|
Small
Color Shift
Δ(u’v’)
= 0.0075
1.9 JNCD Excellent
|
JNCD is a Just Noticeable Color Difference.
See Figure 2 for the
definition of JNCD.
Same Rating Scale as Absolute Color
Accuracy.
|
|
Primary Color Shifts
Largest Color Shift for R,G,B
at a 30 degree Viewing Angle
|
Small Color
Shift
Largest Δ(u’v’) = 0.0090
for Blue
2.2 JNCD Very Good
|
Small Color
Shift
Largest Δ(u’v’) = 0.0053
for Blue
1.3 JNCD Excellent
|
Small Color
Shift
Largest Δ(u’v’) = 0.0038
for Green
1.0 JNCD Excellent
|
JNCD is a Just Noticeable Color Difference.
See Figure 2 for the
definition of JNCD.
Same Rating Scale as Absolute Color
Accuracy.
|
|
Color Shifts for Color Mixtures
at a 30 degree Viewing Angle
Reference Brown (255, 128, 0)
|
Small
Color Shift
Δ(u’v’)
= 0.0065
1.6 JNCD Excellent
|
Small
Color Shift
Δ(u’v’)
= 0.0097
2.4 JNCD Very Good
|
Small
Color Shift
Δ(u’v’)
= 0.0060
1.5 JNCD Excellent
|
JNCD is a Just Noticeable Color Difference.
Color Shifts for non-IPS LCDs are about 10
JNCD.
Reference Brown is a good indicator of
color shifts
with angle because of unequal drive
levels and
roughly equal luminance contributions
from Red
and Green. See Figure 2 for the
definition of JNCD.
|
|
Display Power Consumption
The display power was measured using a Linear
Regression between Luminance and AC Power with a fully charged battery.
Below we compare the Relative Display
Power Efficiencies of the Tablets compared to the iPad Air 2.
Since the displays all have different screen sizes
and maximum brightness, the values are also scaled to the
same screen brightness (Luminance) and same screen
area in order to compare their Relative Power Efficiencies.
As shown below, the Display Power
Efficiencies for the iPad mini 4 and iPad Pro are 22% to 33% higher than the
iPad Air 2.
The Microsoft
Surface Pro 4 is even more efficient: it has 27 percent higher Relative
Power Efficiency than the iPad Pro,
with just 3.0 watts when scaled to the
same values as the iPad Air 2 below.
Both the iPad Pro and Surface Pro 4 have
Metal Oxide Backplanes, which increases their light throughput and further
improves their Power Efficiency.
|
|
Categories
|
iPad
mini 4
|
iPad Air
2
|
iPad Pro
|
Comments
|
|
Maximum Display Power
Full White Screen
at Maximum Brightness
|
3.0 watts
450 cd/m2
29.6 inch2
Screen Area
|
5.1 watts
415 cd/m2
45.1 inch2
Screen Area
|
7.0 watts
424 cd/m2
80.3 inch2
Screen Area
|
This measures the display power for a
screen that
is entirely at Peak White for Maximum
Brightness.
|
|
Relative Power Efficiency
Compared to the iPad Air 2
Same Luminance 415 cd/m2
Same 45.1 inch screen area
|
Relative Power 82%
Relative Efficiency 122%
4.2 watts
|
Relative Power 100%
Relative Efficiency 100%
5.1 watts
|
Relative Power 75%
Relative Efficiency 133%
3.8 watts
|
This compares the Maximum Power
Efficiency
by scaling to the same screen brightness
and
same screen area as the iPad Air 2.
|
|
|
|
|
|
|
About the Author
Dr. Raymond Soneira is
President of DisplayMate Technologies Corporation of Amherst, New Hampshire,
which produces display calibration, evaluation, and diagnostic products for
consumers, technicians, and manufacturers. See www.displaymate.com. He is a research
scientist with a career that spans physics, computer science, and television
system design. Dr. Soneira obtained his Ph.D. in Theoretical Physics from
Princeton University, spent 5 years as a Long-Term Member of the world famous
Institute for Advanced Study in Princeton, another 5 years as a Principal
Investigator in the Computer Systems Research Laboratory at AT&T Bell
Laboratories, and has also designed, tested, and installed color television
broadcast equipment for the CBS Television Network Engineering and Development
Department. He has authored over 35 research articles in scientific journals in
physics and computer science, including Scientific American. If you have any
comments or questions about the article, you can contact him at dtso.info@displaymate.com.
DisplayMate Display Optimization Technology
All Tablet
and Smartphone displays can be significantly improved using DisplayMate’s
proprietary very advanced scientific analysis and mathematical display modeling
and optimization of the display hardware, factory calibration, and driver
parameters. We help manufacturers with expert display procurement, prototype
development, testing displays to meet contract specifications, and production
quality control so that they don’t make mistakes similar to those that are
exposed in our public Display Technology Shoot-Out series for consumers. This
article is a lite version of our advanced scientific analysis – before the
benefits of our DisplayMate
Display Optimization Technology, which can correct or improve all of these
issues. If you are a display or product manufacturer and want to significantly
improve display performance for a competitive advantage then Contact DisplayMate Technologies.
About DisplayMate Technologies
DisplayMate Technologies specializes in proprietary advanced
scientific display calibration and mathematical display optimization to deliver
unsurpassed objective performance, picture quality and accuracy for all types
of displays including video and computer monitors, projectors, HDTVs, mobile
displays such as Tablets and Smartphones, and all display technologies
including LCD, LCD, 3D, LED, LCoS, Plasma, DLP and CRT. This article is a lite version of
our intensive scientific analysis of Tablet and Smartphone mobile displays –
before the benefits of our advanced mathematical DisplayMate Display Optimization
Technology, which can correct or improve many of the display deficiencies. We offer DisplayMate display
calibration software for consumers and advanced DisplayMate display diagnostic
and calibration software for technicians and test labs.
For
manufacturers we offer Consulting Services that include advanced Lab testing
and evaluations, confidential Shoot-Outs with competing products, calibration
and optimization for displays, cameras and their User Interface, plus on-site
and factory visits. We help manufacturers with expert display procurement,
prototype development, and production quality control so they don’t make
mistakes similar to those that are exposed in our Display Technology Shoot-Out
series. See our world renown Display
Technology Shoot-Out public article series for an introduction and preview.
DisplayMate’s
advanced scientific optimizations can make lower cost panels look as good or
better than more expensive higher performance displays. If you are a display or
product manufacturer and want to turn your display into a spectacular one to
surpass your competition then Contact
DisplayMate Technologies to learn more.
Article Links: Microsoft
Surface Pro 4 Display Technology Shoot-Out
Article Links: Microsoft
Surface 3 Display Technology Shoot-Out
Article Links: Samsung
OLED Tab S Display Technology Shoot-Out
Article Links: Apple iPad mini
3 Display Technology Shoot-Out
Article Links: Display Technology Shoot-Out
Article Series Overview and Home Page
Copyright © 1990-2015 by DisplayMate
Technologies Corporation. All Rights Reserved.
This article, or any part
thereof, may not be copied, reproduced, mirrored, distributed or incorporated
into any other work without
the prior written permission of DisplayMate Technologies Corporation