OLED Tablet Display Technology Shoot-Out
Samsung Galaxy Tab S 8.4 –
Samsung Galaxy Tab S 10.5
Dr. Raymond M. Soneira
President, DisplayMate Technologies
Corporation
Copyright © 1990-2014 by DisplayMate
Technologies Corporation. All Rights Reserved.
This article, or any part
thereof, may not be copied, reproduced, mirrored, distributed or incorporated
into any other work without
the prior written permission of DisplayMate Technologies Corporation
Introduction
The key element for a great Tablet has always been a truly innovative
and top performing display, and the best leading edge Tablets have always
flaunted their beautiful high tech displays. But Tablet displays are more
challenging to produce because their large screens are 3 to 4 times the size of
a Smartphone. Up until now Tablets have been almost exclusively LCD based – so
while the Samsung Galaxy series of Smartphones are Flagship models for Samsung
to show off its latest and greatest OLED displays and display technology, there
haven’t been any OLED Tablets until now (except for a single 7.7 inch OLED
model launched in 2012).
With the continuing advancement in manufacturing OLED displays Samsung
has now produced the Galaxy Tab S series, which true to form, will be the
Flagship models for their line of Tablets – with display performance widely
expected to be comparable to the OLED Galaxy S5, which is the best Smartphone
display that we have ever tested. Samsung provided DisplayMate Technologies
with pre-release production units of the Galaxy Tab S Tablets so that we could
perform our well known objective and comprehensive display Lab tests,
measurements, and analysis, explaining the in-depth OLED display performance
results for consumers, reviewers, and journalists.
The Display Shoot-Out
To examine the
performance of the Galaxy Tab S OLED Displays
we ran our in-depth series of Mobile
Display Technology Shoot-Out Lab tests and measurements in order to
determine how OLED displays have improved. We take display quality very
seriously and provide in-depth objective analysis based on detailed laboratory
tests and measurements and extensive viewing tests with both test patterns,
test images and test photos. To see how far OLED and LCD mobile displays have
progressed in just four years see our 2010 Smartphone
Display Shoot-Out, and for a real history lesson see our original 2006 Smartphone
Display Shoot-Out.
Results Highlights
In this Results section we provide Highlights of the
comprehensive DisplayMate Lab tests and measurements and extensive visual
comparisons using test photos, test images, and test patterns that are covered
in the advanced sections. The Display
Shoot-Out Comparison Table summarizes the Lab measurements in the following
categories: Screen
Reflections, Brightness
and Contrast, Colors
and Intensities, Viewing
Angles, OLED
Spectra, Display
Power. You can also skip these Highlights and go directly to the Conclusions.
State-of-the-Art OLED Displays
Our extensive Lab tests
and measurements presented in the detailed Comparison
Table indicate that the Galaxy Tab S Tablet displays are (not surprisingly)
almost identical in display performance to the OLED Galaxy S5
Smartphone that we recently tested and found to be the Best Performing
Smartphone Display. See the Galaxy S5 article for additional background
information on OLED displays. For direct performance comparisons with the
leading LCD Tablets see our Flagship Tablet and
Mini Tablet
Display Shoot-Outs.
2.5K Quad HD 2560x1600
Displays
Both Galaxy Tab S models offer Quad HD 2560x1600 pixel
displays, currently the highest resolution for Tablets, with 4.1 Mega Pixels,
double the number on your HDTV. The 10.5 inch model has RGB Stripe Pixels with
287 pixels per inch, and the 8.4 inch model has Diamond Pixels and Sub-Pixel
Rendering with 361 pixels per inch (ppi). Both are higher than can be resolved
with normal 20/20 Vision at the typical viewing distances for Tablets, so the
displays appear perfectly sharp.
Multiple Screen Modes and
Color Management
Most Smartphones and Tablets only provide a single fixed
factory display color calibration, with no way for the user to alter it based
on personal preferences, running applications, or ambient light levels. An
important capability provided by the OLED Galaxy Smartphones and new Tab S
Tablets is the implementation of Color Management that provides a number of
Screen Modes with different levels of user selectable color saturation and
display calibration based on user and application preferences. The Galaxy Tab S
models have 4 user selectable Screen Modes: Adaptive Display, AMOLED Photo,
AMOLED Cinema, and the Basic screen mode, which matches the sRGB/Rec.709
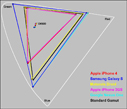
Standard used for most consumer content. See this Figure for the Color Gamuts
of the different Screen modes and the Colors
and Intensities section for measurements and details.
Adaptive Display Mode and
Wide Color Gamut
The Adaptive Display screen mode provides real-time
adaptive processing to dynamically adjust images and videos – for some
applications it will vary the White Point, Color Gamut, and Color Saturation
based on the image content and the color of the surrounding ambient lighting measured
by the Ambient Light Sensor (which measures color in addition to brightness).
The Adaptive Display mode also delivers higher color saturation, with 138
percent of the standard sRGB/Rec.709 Gamut, the highest that we have ever
measured for Tablets and Smartphones. Some people like vibrant colors, plus it
is useful for special applications and particularly for viewing in medium to
high levels of ambient light, because it offsets some of the reflected glare
that washes out the on-screen colors.
AMOLED Photo Mode with Adobe
RGB Gamut
Most high-end digital cameras have an option to use the
Adobe RGB Gamut, which is 17 percent larger than the standard sRGB/Rec.709
Gamut used in consumer cameras. The AMOLED Photo screen mode on the Galaxy Tab
S provides an accurate calibration to the Adobe RGB standard, which is rarely
available in consumers displays, and is very useful for high-end digital
photography and other advanced imaging applications. The measured Absolute
Color Accuracy of the AMOLED Photo mode for the Galaxy Tab S is 3.2 JNCD, which
is very accurate. See this Figure
for an explanation and visual definition of JNCD and
Color Accuracy Plots
showing the measured Color Errors. There are very few consumer displays that
can accurately reproduce Adobe RGB, so this is a significant plus for serious
photography enthusiasts. See the Color
Accuracy section and Color
Accuracy Plots for measurements and details.
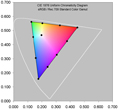
Basic Mode with sRGB / Rec.709 Standard Gamut
The Basic screen mode provides the most accurate Color
and White Point calibration for the standard sRGB/Rec.709 Color Gamut that is
used in virtually all current consumer content for digital cameras, HDTVs, the
internet, and computers, including photos, videos, and movies. The Absolute
Color Accuracy for the Basic screen mode is an Excellent 2.1 JNCD, the most
color accurate display that we have ever measured for a Smartphone or Tablet.
See this Figure for an
explanation and visual definition of JNCD and Color Accuracy Plots
showing the measured Color Errors, and also this regarding Bogus Color Accuracy
Measurements. Use the Basic screen mode for the best color and image
accuracy, which is especially important when viewing photos from family and
friends (because you often know exactly what they actually should look like),
for some TV shows, movies, and sporting events with image content and colors
that you are familiar with, and also for viewing online merchandise, so you
have a very good idea of exactly what colors you are buying and are less likely
to return them. See the Color
Accuracy section and Color
Accuracy Plots for measurements and details.
Screen Brightness
Both of the Galaxy Tab S displays have Very Good to
Excellent screen Brightness, but are not as bright as the brightest LCD
Tablets. The current record holder for Tablets is the Nokia Lumia 2520 with 684
cd/m2 (nits), while the Tab S has 546 nits with Automatic Brightness
On and 415 nits under manual Brightness (10 percent lower for mixed content
with 50 percent Average Picture Level APL and 25 percent lower for an all white
100 percent APL screen). High screen Brightness is only needed for High Ambient
Light, so turning Automatic Brightness On will provide better screen visibility
and also a longer battery running time. As discussed below, the record low
screen Reflectance of 4.7 percent for the Galaxy Tab S further improves its
effective Screen Brightness in high Ambient Light. See the Brightness
and Contrast section for measurements and details.
Super Dimming Mode
The Galaxy Tab S Tablets also have a Super Dimming Mode
that allows the Maximum Screen Brightness to be set all the way down to just 2
cd/m2 using the Brightness Slider. This is useful for working
comfortably without eye strain or bothering others in very dark environments,
or affecting the eye’s dark adaptation, such as when using a telescope. The display
still delivers full 24-bit color and the picture quality remains excellent.
Performance in High Ambient Lighting
Mobile displays are often used under relatively bright
ambient light, which washes out image colors and contrast, reducing picture
quality and making it harder to view or read the screen. To be usable in high
ambient light a display needs a dual combination of high screen Brightness and
low screen Reflectance – the Galaxy Tab S displays have both. They have 4.7
percent Screen Reflectance, the lowest of any Tablet display that we have ever
tested. Our Contrast Rating for High Ambient Light
quantitatively measures screen visibility under bright Ambient Light – the
higher the better. As a result of its high Brightness and low Reflectance, the Galaxy
Tab S have a Contrast Rating for High Ambient Light that ranges from 59 to 116,
among the highest that we have ever measured. See the Brightness
and Contrast section for measurements and details.
Power Efficiency
LCDs are typically more power efficient for images with
mostly white content (like text screens, for example), while OLEDs are more
power efficient for mixed image content because they are emissive displays so
their power varies with the Average Picture Level (average Brightness) of the
image content. For LCDs the display power is independent of image content.
OLEDs have been rapidly improving in their power efficiency. For example,
comparing the OLED Tab S 8.4 to the LCD Apple iPad Air: the OLED Tab S with
Diamond Pixels is 27 percent more power efficient (for the same screen size and
Luminance) than the LCD iPad Air for mixed image content (that includes photos,
videos, and movies, for example) with a typical 50 percent Average Picture
Level. See the Display
Power section for more details. The Galaxy Tab S displays also have an
Ultra Power Saving Mode that lowers the screen Brightness and also sets the
background to Black, both of which significantly reduce display power and can
double the running time on battery.
Screen Uniformity
One subtle but important advantage of OLEDs is their
excellent screen uniformity compared to LCDs, which often show hot spots and
shadows from the edge LED lighting.
Viewing Angle Performance
While Tablets are
primarily single viewer devices, the variation in display performance with
viewing angle is still very important because single viewers frequently hold
the display at a variety of viewing angles. The angle is often up to 30
degrees, more if it’s resting on a table or desk. While LCDs typically
experience a 55 percent or greater decrease in Brightness at a 30 degree
Viewing Angle, the OLED Galaxy Tab S displays show a much smaller 21 percent
decrease in Brightness at 30 degrees. This also applies to multiple
side-by-side viewers as well, and is a significant advantage of OLED displays.
The Color Shifts with Viewing Angle are also relatively small. See the Viewing
Angles section for measurements and details.
Viewing Tests
The Galaxy Tab S Basic screen mode provides very nice,
pleasing and accurate colors, and picture quality. Although the Image Contrast
and Color Saturation are slightly too high (due to a slightly too steep
Intensity Scale), the very challenging set of DisplayMate Test and Calibration
Photos that we use to evaluate picture quality looked Beautiful,
even to my experienced hyper-critical eyes. The Basic screen mode is
recommended for indoor and low ambient light viewing of most standard consumer
content for digital camera, HDTV, internet, and computer content, including
photos, videos, and movies. The Adaptive Display screen mode has significantly
more vibrant and saturated colors. Some people like that. It is also
particularly recommended for medium to high levels of ambient light viewing
because it offsets some of the reflected glare that washes out the images.
Galaxy Tab S Conclusions: An Impressive
Tablet Display…
The primary goal of this Display Technology Shoot-Out
article series has always been to point out which manufactures and display
technologies are leading and advancing the state-of-the-art of displays by
performing comprehensive and objective Lab tests and measurements together with
in-depth analysis. We point out who is leading, who is behind, who is improving,
and sometimes (unfortunately) who is back pedaling… all based solely on the
extensive objective measurements that we also publish, so that everyone can
judge the data for themselves as well…
Best Tablet Display:
Based on our extensive Lab tests and measurements, the Galaxy Tab S is the Best Performing Tablet Display that
we have ever tested, not surprisingly with
performance that is almost identical to the OLED Galaxy S5
Smartphone that we recently tested and found to be the Best Performing
Smartphone Display. The Galaxy Tab S establishes new records for best Tablet
display performance in: Highest Color Accuracy, Infinite Contrast Ratio, Lowest
Screen Reflectance, and smallest Brightness Variation with Viewing Angle. Both
Galaxy Tab S models offer Quad HD 2560x1600 pixel displays (with 287 to 361
pixels per inch), currently the highest for Tablets, with 4.1 Mega Pixels,
double the number on your HDTV. Where the Galaxy Tab S does very well but does
not break performance records is in maximum display Brightness – the current
record holder for Tablets is the Nokia Lumia 2520 with 684 nits, while the Tab
S has 546 nits with Automatic Brightness On and 415 nits under manual
Brightness (10 percent lower for mixed content with 50 percent Average Picture
Level APL and 25 percent lower for an all white screen). High screen
Brightness is only needed for High Ambient Light, so turning Automatic
Brightness On will provide better screen visibility and also a longer battery
running time. Its record low Screen Reflectance of
4.7 percent further improves the effective screen Brightness, resulting in a
very high Contrast Rating for High Ambient Light with Automatic Brightness On.
See the Brightness
and Contrast section for details. Comparisons with the leading LCD Tablets
are examined below.
Multiple Screen Modes and Color Management: Most Tablets only provide a single
fixed factory display color calibration, with no way for the user to alter it
based on personal preferences, running applications, or ambient light levels.
Samsung’s implementation of Color Management for their OLED Smartphones and
Tablets allows them to provide multiple Screen Modes with different Color
Gamuts and color calibrations – other Tablets only provide a single fixed
screen Color Gamut and calibration.
Most Accurate Colors: The
Galaxy Tab S Basic screen mode has the most accurate colors for standard
(sRGB/Rec.709) consumer content of any Smartphone or Tablet display that we
have ever measured (even slightly better than the Galaxy S5 the previous record
holder – also see this regarding Bogus Color Accuracy
Measurements). Color Accuracy is especially important when viewing photos
from family and friends (because you often know exactly what they actually
should look like), for some TV shows, movies, and sporting events with image
content and colors that you are familiar with, and also for viewing online
merchandise, so you have a very good idea of exactly what colors you are buying
and are less likely to return them.
Adobe RGB AMOLED Photo Mode:
Most high-end digital cameras have an option to use the Adobe RGB Gamut, which
is 17 percent larger than the standard sRGB/Rec.709 Gamut used in consumer
cameras. The AMOLED Photo screen mode on the Galaxy Tab S provides an accurate
calibration to the Adobe RGB standard, which is rarely available in consumer
displays, and is very useful for high-end digital photography and other
advanced imaging applications. The large screens on the Galaxy Tab S makes them
especially useful for photographers to check their Adobe RGB photo shots and
for showing them off.
Adaptive Display Wide Color
Gamuts: The OLED display’s native Wide Color Gamut in the Adaptive
Display screen mode has significantly more vibrant and saturated colors, with
138 percent of the standard sRGB/Rec.709 Color Gamut, the highest that we have
ever measured for Tablets and Smartphones. Some people like vibrant colors,
plus it is useful for special applications and particularly for medium to high
levels of ambient light viewing because it offsets some of the reflected glare
that washes out the on-screen colors.
Comparisons with the Amazon Kindle Fire HDX and Apple iPad Tablet
Displays: In 2013
the Amazon Kindle Fire HDX Tablets became the top performing Tablet displays in
our Display Technology Shoot-Out series, leapfrogging the competition with
cutting edge displays using Quantum Dots and Low Temperature Poly
Silicon. But with the ever continuing and impressive improvements in
display technology the Samsung Galaxy Tab S has now taken the lead for the Best
Tablet Displays. The Apple iPad Air, which came in second after the Kindle Fire
HDX 8.9, now moves into third place for Flagship Tablet models,
and the iPad mini with Retina Display, with a very disappointing 63 percent of
the standard sRGB/Rec.709 Color Gamut and poor Color Accuracy moves further
down the pack for the Mini
Tablet models. You can directly compare all of the display performance
measurements and results by referring to these and other articles in our
Display Technology Shoot-Out article
series.
The Next Generation of
Displays: With display technology advancing rapidly on many
different fronts things can change again in the next generation of displays for
Tablets and Smartphones. So a strong Congratulations to Samsung, but please
don’t rest on your laurels – and best wishes to all manufacturers in developing
their next generation of even higher performance displays!!
The most
important developments for the upcoming generations of both OLED and LCD mobile
displays will come from improvements in their image and picture quality in
ambient light, which washes out screen images, resulting in reduced
readability, image contrast, and color saturation and accuracy. The key will be
in dynamically changing the display’s color management and intensity scales
with the measured Ambient Light in order to automatically compensate for
reflected glare and image wash out from ambient light as discussed in our 2014
Innovative Displays and Display Technology and SID
Display Technology Shoot-Out articles. The
displays and technologies that succeed in implementing this new strategy will
take the lead in the next generations of mobile displays…
DisplayMate Display Optimization Technology
All
Smartphone and Tablet displays can be significantly improved using
DisplayMate’s proprietary very advanced scientific analysis and mathematical
display modeling and optimization of the display hardware, factory calibration,
and driver parameters. We help manufacturers with expert display procurement,
prototype development, testing displays to meet contract specifications, and
production quality control so that they don’t make mistakes similar to those
that are exposed in our public Display Technology Shoot-Out series for
consumers. This article is a lite version of our advanced scientific analysis –
before the benefits of our DisplayMate
Display Optimization Technology, which can correct or improve all of these
issues. If you are a display or product manufacturer and want to significantly
improve display performance for a competitive advantage then Contact DisplayMate Technologies.
Display Shoot-Out Comparison Table
Below we
examine in-depth the OLED displays on the Samsung Galaxy
Tab S 8.4 and 10.5 models based on
objective Lab measurement data and criteria. For comparisons and additional
background information see the Galaxy S5 OLED
Display Technology Shoot-Out, the Flagship Tablet LCD
Display Technology Shoot-Out, and the Mini Tablet LCD Display
Technology Shoot-Out. For comparisons with the other leading Tablet,
Smartphone and Smart Watch displays see our Mobile Display Technology
Shoot-Out series.
|
Categories
|
Samsung
Galaxy Tab S 8.4
|
Samsung
Galaxy Tab S 10.5
|
Comments
|
|
Display Technology
|
8.4 inch
OLED with
Diamond Pixels
|
10.5 inch
OLED with
RGB Stripe Pixels
|
Organic Light Emitting Diode
Sub-Pixels are in a Diamond or an RGB
Stripe
|
|
Screen Shape
|
16:10 =
1.60
Aspect
Ratio
|
16:10 =
1.60
Aspect
Ratio
|
The Galaxy Tab S has the same shape as
widescreen HDTV video content.
|
|
Screen Area
|
31.4
Square Inches
|
49.7
Square Inches
|
A better measure of size than the
diagonal length.
|
|
Relative Screen Area
|
100
percent
|
158
percent
|
Relative Screen Area for the Tablets
|
|
Display Resolution
|
2560 x
1600 pixels
2.5K Quad
HD
|
2560 x
1600 pixels
2.5K Quad
HD
|
Screen Pixel Resolution.
Quad HD can display four 1280x720 HD
images
|
|
Total Number of Pixels
|
4.1 Mega
Pixels
|
4.1 Mega
Pixels
|
Total Number of Pixels.
|
|
Pixels Per Inch
|
361 PPI
with Diamond Pixels
Excellent
|
287 PPI
with RGB Stripe Pixels
Excellent
|
Sharpness depends on the viewing distance
and PPI.
See this on
the visual acuity for a true Retina Display
|
|
Sub-Pixels Per Inch
|
Red
255 SPPI
Green
361 SPPI
Blue
255 SPPI
|
Red
287 SPPI
Green 287
SPPI
Blue
287 SPPI
|
Diamond Pixel displays have only half the
number of
Red and Blue Sub-Pixels as standard RGB
displays.
|
|
Total Number of Sub-Pixels
|
Red
2,048 KSP
Green
4,096 KSP
Blue
2,048 KSP
|
Red
4,096 KSP
Green
4,096 KSP
Blue
4,096 KSP
|
Number of Kilo Sub-Pixels KSP for Red, Green, Blue.
Diamond Pixel displays have only half the
number of
Red and Blue Sub-Pixels as standard RGB
displays.
At High PPI this is generally not visible
due to the
use of Sub-Pixel Rendering.
|
|
20/20 Vision Distance
where Pixels or Sub-Pixels
are Not Resolved
|
9.5
inches for White and Green
13.4 inches for Red and Blue
|
12.0
inches for White and Green
12.0
inches for Red and Blue
|
For 20/20 Vision the minimum Viewing
Distance
where the screen appears perfectly sharp
to the eye.
At 14 inches from the screen 20/20 Vision
is 246 PPI.
|
|
Display Sharpness
at Typical Viewing Distances
|
Display
appears Perfectly Sharp
Pixels are
not Resolved with 20/20 Vision
at Typical
Viewing Distances of
12 to 15
inches
The
Sub-Pixel Rendering significantly improves Display Sharpness
|
Display
appears Perfectly Sharp
Pixels are
not Resolved with 20/20 Vision
at Typical
Viewing Distances of
15 to 18
inches
|
The Typical Viewing Distances for these
Tablets
are in the range of 12 to 18 inches.
Also note that eye’s resolution is much
lower for
Red and Blue color content than White
and Green.
|
|
Appears Perfectly Sharp
at Typical Viewing Distances
|
Yes
|
Yes
|
Typical Viewing Distances are 12 to 18
inches
or more.
|
|
Photo Viewer Color Depth
|
Full
24-bit Color
No
Dithering Visible
256
Intensity Levels
|
Full
24-bit Color
No
Dithering Visible
256
Intensity Levels
|
Many Android Smartphones and Tablets
still have some form of 16-bit color
depth in the Gallery Viewer.
The Samsung Galaxy Tab S do not have
this issue.
|
|
Overall Assessments
This section summarizes
the results for all of the extensive Lab Measurements and Viewing Tests
performed on the display
See Screen
Reflections, Brightness
and Contrast, Colors
and Intensities, Viewing
Angles, OLED
Spectra, Display
Power.
The
Galaxy Tab S line has 4 user selectable Screen Modes that are calibrated for different applications and user
preferences.
Here
we provide results for the Adaptive Display mode, which is a dynamic Wide
Color Gamut mode, the AMOLED Photo mode,
which
is calibrated for the Adobe RGB Gamut used in high-end digital photography
and other advanced imaging applications, and
the
Basic screen mode, which is calibrated for
the sRGB/Rec.709 Standard that is used for most consumer camera,
photo, video,
movie, web, and
computers.
|
|
Both Tablets have the same
4 Screen Modes. Three were selected for
the article tests.
|
Galaxy
Tab S 8.4
Adaptive
Display
Wide Color
Gamut
|
Galaxy
Tab S 10.5
|
Comments
|
|
AMOLED
Photo mode
Adobe RGB
Gamut
|
Basic mode
sRGB/Rec.709
Gamut
|
|
Viewing Tests
in Subdued Ambient Lighting
|
Good
Images
Photos and
Videos
have too
much color
and
accurate contrast
Wide Color
Gamut Mode
Intentionally
Vivid Colors
|
Very Good
Images
Adobe RGB
Photos
have very
good color
and
accurate contrast
Accurate
Pro Photo Mode
|
Very Good
Images
Photos and
Videos
have very
good color
and
accurate contrast
Accurate
Std Mode
|
The Viewing Tests examine the accuracy
of
photographic images by comparing the
displays
to an calibrated studio monitor and
HDTV.
|
|
Variation with Viewing Angle
Colors and Brightness
See Viewing
Angles
|
Small
Color Shifts
with
Viewing Angle
Small
Brightness Shift
with
Viewing Angle
|
Small
Color Shifts
with
Viewing Angle
Small
Brightness Shift
with Viewing
Angle
|
Small
Color Shifts
with
Viewing Angle
Small
Brightness Shift
with
Viewing Angle
|
The Galaxy Tab S displays have a
relatively small
decrease in Brightness with Viewing
Angle and
relatively small Color Shifts with
Viewing Angle.
See the Viewing
Angles
section for details.
|
|
Overall Display Assessment
Lab Tests and Measurements
|
Excellent OLED Display
Wide Color
Gamut Mode
|
Excellent OLED Display
Accurate
Pro Photo Mode
|
Excellent OLED Display
Accurate
Std Mode
|
The Galaxy Tab S OLED Displays performed
very well in the Lab Tests and
Measurements.
|
|
|
|
Absolute Color Accuracy
Measured over Entire Gamut
See Figure 2 and Colors
|
Good
Color Accuracy
Colors
More Saturated
Wide Color
Gamut Mode
|
Very Good
Color Accuracy
Color
Errors are Small
Accurate
Pro Photo Mode
|
Excellent
Color Accuracy
Color
Errors are Small
Accurate
Std Mode
|
Absolute
Color Accuracy is measured with a
Spectroradiometer
for 21 Reference Colors
uniformly
distributed within the entire Color Gamut.
See
Figure 2 and Colors
and Intensities for details.
|
|
Image Contrast Accuracy
See Figure 3 and Contrast
|
Very Good
Accuracy
Image
Contrast
Slightly
Too High
|
Very Good
Accuracy
Image
Contrast
Slightly
Too High
|
Very Good
Accuracy
Image
Contrast
Slightly
Too High
|
The
Image Contrast Accuracy is determined by
measuring
the Log Intensity Scale and Gamma.
See
Figure 3 and Brightness
and Contrast for details.
|
|
Performance in Ambient Light
Display Brightness
Screen Reflectance
Contrast Rating
See Brightness
and Contrast
See Screen
Reflections
|
High
Display Brightness
Very Low
Reflectance
High
Contrast Rating
Higher
Brightness with
Auto
Brightness On
|
High
Display Brightness
Very Low
Reflectance
High
Contrast Rating
Higher
Brightness with
Auto
Brightness On
|
High
Display Brightness
Very Low
Reflectance
High
Contrast Rating
Higher
Brightness with
Auto
Brightness On
|
Tablets
are seldom used in the dark.
Screen
Brightness and Reflectance determine
the
Contrast Rating for High Ambient Light.
See
the Brightness
and Contrast section for details.
See
the Screen
Reflections section for details.
|
|
Overall Display Calibration
Image and Picture Quality
Lab Tests and Viewing Tests
|
Vivid Saturated Colors
Wide Color
Gamut Mode
|
Very Good Calibration
Accurate
Pro Photo Mode
|
Excellent Calibration
Accurate
Std Mode
|
Galaxy Tab S displays have multiple
Screen Modes
that deliver accurately calibrated colors
and images
and a Wide Color Gamut Mode that is
preferred by
some users and for some applications.
|
|
|
Overall Display Grade
Overall
Assessment
|
Overall Galaxy Tab S Display
Grade is Excellent A
The Best Performing Tablet Displays
that we have ever tested.
|
The Galaxy Tab S displays deliver
excellent
image quality, have both Color Accurate
and
Wide Color Gamut Vivid Color modes, have
high Screen Brightness and low
Reflectance,
have good Viewing Angles, and are all
around
top performing Tablet displays.
|
|
Wide Color Gamut Mode
Also Best
for Viewing in
High
Ambient Light
|
Accurate
Pro Photo Mode
For Viewing
High-End
Adobe RGB
Photos
|
Accurate
Std Mode
For Viewing
Most Content
Photo Video
Movie Web
|
|
|
Adaptive
Display
Wide Color
Gamut
|
AMOLED
Photo mode
Adobe RGB
Gamut
|
Basic mode
sRGB/Rec.709
Gamut
|
Comments
|
|
Screen Reflections
All display screens are mirrors good enough to use
for personal grooming – but that is actually a very bad feature…
We measured the light reflected from all directions
and also direct mirror (specular) reflections, which are much more
distracting and cause more eye strain. Many Tablets
still have greater than 10 percent reflections that make the
screen much harder to read even in moderate ambient
light levels, requiring ever higher brightness settings that waste
precious battery power. Hopefully manufacturers
will reduce the mirror reflections with anti-reflection coatings and
matte or haze surface finishes.
Our Lab Measurements include Average Reflectance
for Ambient Light from All Directions and for Mirror Reflections.
Note that the Screen Reflectance is exactly the
same for all of the Screen Modes on each Galaxy Tab S model.
The Galaxy Tab S has the Lowest
Reflectance that we have ever measured for a Tablet.
|
|
|
Galaxy
Tab S 8.4
|
Galaxy
Tab S 10.5
|
Comments
|
|
Average Screen Reflection
Light From All Directions
|
4.7
percent
Ambient
Light Reflections
Excellent
|
4.7
percent
Ambient
Light Reflections
Excellent
|
Measured using an Integrating Hemisphere
and
a Spectroradiometer. The best value we
have
ever measured for a Tablet is 4.7
percent.
|
|
Mirror Reflections
Percentage of Light Reflected
|
7.6 percent
for Mirror Reflections
Very Good
|
7.5 percent
for Mirror Reflections
Very Good
|
These are the most annoying types of
Reflections.
Measured using a Spectroradiometer and a
narrow
collimated pencil beam of light
reflected off the screen.
|
|
Brightness and Contrast
The Contrast Ratio
is the specification that gets the most attention, but it only applies for
low ambient light, which is seldom
the case for mobile displays. Much more important
is the Contrast Rating, which indicates how
easy it is to read the screen
under high ambient lighting and depends on both
the Maximum Brightness and the Screen Reflectance. The larger the better.
|
|
Both Tablets have the same
4 Screen Modes. Three were selected for
the article tests.
|
Galaxy
Tab S 8.4
Adaptive
Display
Wide Color
Gamut
|
Galaxy
Tab S 10.5
|
Comments
|
|
AMOLED
Photo mode
Adobe RGB
Gamut
|
Basic mode
sRGB/Rec.709
Gamut
|
|
Measured Brightness
50% Average Picture Level
|
Brightness
328 cd/m2
Very Good
|
Brightness
301 cd/m2
Very Good
|
Brightness
301 cd/m2
Very Good
|
This is the Brightness for typical screen
content
that has a 50% Average Picture Level.
|
|
Measured Brightness
100% Full Screen White
|
Brightness
286 cd/m2
Good
|
Brightness
279 cd/m2
Good
|
Brightness
280 cd/m2
Good
|
This is the Brightness for a screen that
is entirely
all white with 100% Average Picture
Level.
|
|
Measured Peak Brightness
1% Full Screen White
|
Brightness
415 cd/m2
Very Good
|
Brightness
364 cd/m2
Very Good
|
Brightness
364 cd/m2
Very Good
|
This is the Peak Brightness for a screen
that
has only a tiny 1% Average Picture
Level.
|
|
Measured Brightness
with Automatic Brightness On
|
Brightness
349 – 544
cd/m2
Excellent
|
Brightness
366 – 518
cd/m2
Excellent
|
Brightness
366 – 518
cd/m2
Excellent
|
Some displays including the Galaxy S5
have
higher Brightness in Automatic
Brightness Mode.
|
|
Low Ambient Light
|
|
Lowest Peak Brightness
Super Dimming Mode
Brightness Slider to Minimum
|
2 cd/m2
For Very
Low Light
|
2 cd/m2
For Very
Low Light
|
2 cd/m2
For Very
Low Light
|
This is the Lowest Brightness with the
Slider set to
Minimum. This is useful for working in
very dark
environments. Picture Quality remained
Excellent.
|
|
Black Brightness at 0 lux
at Maximum Brightness Setting
|
0 cd/m2
Outstanding
|
0 cd/m2
Outstanding
|
0 cd/m2
Outstanding
|
Black brightness is important for low
ambient light,
which is seldom the case for mobile
devices.
|
|
Contrast Ratio at 0 lux
Relevant for Low Ambient Light
|
Infinite
Outstanding
|
Infinite
Outstanding
|
Infinite
Outstanding
|
Only relevant for Low Ambient Light,
which is seldom the case for mobile
devices.
|
|
High Ambient Light
|
|
Contrast Rating
for High Ambient Light
The Higher the Better
for Screen Readability
in High Ambient Light
|
61 – 88
Very Good
74 – 116
With Auto
Brightness
Excellent
|
59 – 77
Very Good
78– 110
With Auto
Brightness
Excellent
|
60 – 77
Very Good
78 – 110
With Auto
Brightness
Excellent
|
Depends on the Screen Reflectance and
Brightness.
Defined as Maximum Brightness / Average Reflectance.
Some displays including the Galaxy Tab S have
higher Brightness in Automatic Brightness Mode.
|
|
Screen Readability
in High Ambient Light
|
Very Good A –
Excellent A
With Auto Brightness
|
Very Good A –
Excellent A
With Auto Brightness
|
Very Good A –
Excellent A
With Auto Brightness
|
Indicates how easy it is to read the
screen
under high ambient lighting. Depends on
both the Screen Reflectance and Brightness.
See High
Ambient Light Screen Shots
|
|
Colors and Intensities
The Color Gamut, Intensity Scale, and White Point
determine the quality and accuracy of all displayed images and all
the image colors. Bigger is definitely Not Better
because the display needs to match all the standards that were used
when the content was produced. For LCDs a wider
Color Gamut reduces the power efficiency and the Intensity Scale
affects both image brightness and color mixture
accuracy.
The Galaxy Tab S Screen Modes that we
tested are calibrated for different applications and user preferences.
|
|
Both Tablets have the same
4 Screen Modes. Three were selected for
the article tests.
|
Galaxy
Tab S 8.4
Adaptive
Display
Wide Color
Gamut
|
Galaxy
Tab S 10.5
|
Comments
|
|
AMOLED
Photo mode
Adobe RGB
Gamut
|
Basic mode
sRGB/Rec.709
Gamut
|
|
Color of White
Color Temperature in degrees
Measured in the dark at 0 lux
See Figure 1
|
7,468 K
White is
Somewhat Bluish
Intentionally
Bluish Mode
For Some
Applications
the White
Point Will Vary
with the
Ambient Lighting
|
6,320 K
Close to
Standard White
Accurate
Pro Photo Mode
See Figure 1
|
6,326 K
Close to
Standard White
Accurate
Std Mode
See Figure 1
|
D65 with 6,500 K is the standard color
of White
for most Consumer Content and needed for
accurate color reproduction of all
images.
See Figure 1
for the plotted White Points.
|
|
Color Gamut
Measured in the dark at 0 lux
See Figure 1
|
138
percent
sRGB /
Rec.709
Colors More
Saturated
Wide Color
Gamut Mode
See Figure 1
|
106
percent
Adobe RGB
Close to
Adobe RGB Gamut
Accurate
Pro Photo Mode
See Figure 1
|
113
percent
sRGB /
Rec.709
Slightly
Too High
Accurate
Std Mode
See Figure 1
|
sRGB / Rec.709 is the color standard for
most
content and needed for accurate color
reproduction.
Many advanced digital cameras use Adobe
RGB.
A Wide Color Gamut is useful in High
Ambient Light
and for some applications. It can be used
with Color
Management to dynamically change the
Gamut.
|
|
Color Accuracy
|
|
Absolute Color Accuracy
Average Color Error at 0 lux
For 21 Reference Colors
Just Noticeable Color Difference
See Figure 2
|
Average
Color Shift
From
sRGB/Rec.709
Δ(u’v’)
= 0.0351
8.8 JNCD
Colors More
Saturated
Wide Color
Gamut Mode
See Figure 2
|
Average
Color Error
From Adobe
RGB
Δ(u’v’)
= 0.0126
3.2 JNCD
Very Good
Accuracy
Accurate
Pro Photo Mode
See Figure 2
|
Average
Color Error
From
sRGB/Rec.709
Δ(u’v’)
= 0.0085
2.1 JNCD
Excellent
Accuracy
Accurate
Std Mode
See Figure 2
|
JNCD is a Just Noticeable Color Difference.
See Figure 2 for the
definition of JNCD and for
Accuracy Plots showing
the measured Color Errors.
Average Errors below 3.5 JNCD are Very
Good.
Average Errors 3.5 to 7.0 JNCD are
Good.
Average Errors above 7.0 JNCD are
Poor.
|
|
Absolute Color Accuracy
Largest Color Error at 0 lux
For 21 Reference Colors
Just Noticeable Color Difference
See Figure 2
|
Largest Color Shift
From
sRGB/Rec.709
Δ(u’v’)
= 0.0652
16.3 JNCD
for Cyan-Blue
Colors More
Saturated
Wide Color
Gamut Mode
See Figure 2
|
Largest Color Error
From Adobe
RGB
Δ(u’v’)
= 0.0361
9.0 JNCD
for 50% Red
Good
Accuracy
Accurate
Pro Photo Mode
See Figure 2
|
Largest Color Error
From
sRGB/Rec.709
Δ(u’v’)
= 0.0161
4.0 JNCD
for Red
Very Good
Accuracy
Accurate
Std Mode
See Figure 2
|
JNCD is a Just Noticeable Color Difference.
See Figure 2 for the
definition of JNCD and for
Accuracy Plots showing
the measured Color Errors.
Largest Errors below 7.0 JNCD are
Very Good.
Largest Errors 7.0 to 14.0 JNCD are
Good.
Largest Errors above 14.0 JNCD are
Poor.
This is twice the limit for the Average
Error.
|
|
Intensity Scale
|
|
Dynamic Brightness
Luminance Decrease with
Average Picture Level APL
|
31 percent
Decrease
Good
|
23 percent
Decrease
Good
|
23 percent
Decrease
Good
|
This is the percent Brightness decrease
with APL
Average Picture Level. Ideally should be
0 percent.
|
|
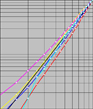
Intensity Scale and
Image Contrast
See Figure 3
|
Smooth and
Straight
Slightly
Too Steep
See Figure 3
|
Smooth and
Straight
Slightly
Too Steep
See Figure 3
|
Smooth ad
Straight
Slightly
Too Steep
See Figure 3
|
The Intensity Scale controls image
contrast needed
for accurate Image Contrast and Color
reproduction.
See Figure 3
|
|
Gamma for the Intensity Scale
Larger has more Image Contrast
See Figure 3
|
2.44
Gamma
Slightly Too High
|
2.37
Gamma
Slightly Too High
|
2.37
Gamma
Slightly Too High
|
Gamma is the log slope of the Intensity
Scale.
Gamma of 2.20 is the standard and needed
for
accurate Image Contrast and Color
reproduction.
See Figure 3
|
|
Image Contrast Accuracy
|
Very Good
|
Very Good
|
Very Good
|
See Figure 3
|
|
Viewing Angles
The variation of
Brightness, Contrast, and Color with Viewing Angle is especially important
for Tablets because
of their larger screen
and multiple viewers. The typical manufacturer 176+ degree specification for
LCD Viewing Angle
is nonsense because that
is where the Contrast Ratio falls to a miniscule 10. For most LCDs there are
substantial
degradations at less
than ±30 degrees, which is not an atypical Viewing Angle for Tablets and
Smartphones.
Note that the Viewing
Angle performance is also very important for a single viewer because the
Viewing Angle can vary
significantly based on
how the Tablet is held. The Viewing Angle can be very large if resting on a
table or desk.
The
Viewing Angle variations are essentially identical for all of the Screen
Modes on a Tablet.
|
|
Both Tablets have the same
4 Screen Modes. Three were selected for
the article tests.
|
Galaxy
Tab S 8.4
Adaptive Display
Wide Color
Gamut
|
Galaxy
Tab S 10.5
|
Comments
|
|
AMOLED Photo mode
Adobe RGB
Gamut
|
Basic mode
sRGB/Rec.709
Gamut
|
|
Brightness Decrease
at a 30 degree Viewing Angle
|
22
percent Decrease
Small
Decrease
|
21 percent
Decrease
Small
Decrease
|
21 percent
Decrease
Small
Decrease
|
Most screens become less bright when
tilted.
OLED decrease is due to optical
absorption..
LCD decrease is generally greater than 50 percent.
|
|
Contrast Ratio at 0 lux
at a 30 degree Viewing Angle
|
Infinite
Contrast Ratio
Outstanding
|
Infinite
Contrast Ratio
Outstanding
|
Infinite
Contrast Ratio
Outstanding
|
A measure of screen readability when the
screen
is tilted under low ambient lighting.
|
|
White Point Color Shift
at a 30 degree Viewing Angle
|
Small Color
Shift
Δ(u’v’)
= 0.0059
1.5 JNCD
|
Small Color
Shift
Δ(u’v’)
= 0.0055
1.4 JNCD
|
Small Color
Shift
Δ(u’v’)
= 0.0056
1.4 JNCD
|
JNCD is a Just Noticeable Color Difference.
See Figure 2 for the
definition of JNCD.
|
|
Primary Color Shifts
Largest Color Shift for R,G,B
at a 30 degree Viewing Angle
|
Medium
Color Shift
Largest Δ(u’v’) = 0.0327
for Red
8.2 JNCD
|
Medium
Color Shift
Largest Δ(u’v’) = 0.0276
for Red
6.9 JNCD
|
Medium
Color Shift
Largest Δ(u’v’) = 0.0257
for Red
6.4 JNCD
|
JNCD is a Just Noticeable Color Difference.
See Figure 2 for the
definition of JNCD.
|
|
Color Shifts for Color Mixtures
at a 30 degree Viewing Angle
Reference Brown (255, 128, 0)
|
Small Color
Shift
Δ(u’v’)
= 0.0146
3.6 JNCD
|
Small Color
Shift
Δ(u’v’)
= 0.0135
3.4 JNCD
|
Small Color
Shift
Δ(u’v’)
= 0.0117
2.9 JNCD
|
JNCD is a Just Noticeable Color Difference.
Color Shifts for non-IPS LCDs are about 10
JNCD.
Reference Brown is a good indicator of
color shifts
with angle because of unequal drive
levels and
roughly equal luminance contributions
from Red
and Green. See Figure 2 for the
definition of JNCD.
|
|
Display Power Consumption
The display power was measured using a Linear
Regression between Luminance and AC Power with a fully charged battery.
Since the displays all have different screen sizes
and maximum brightness, the values were also scaled to the
same screen brightness (Luminance) and same screen
area in order to compare their Relative Power Efficiencies.
LCDs are typically more power efficient for images with
mostly white content (like text screens, for example), while OLEDs
are more power efficient for mixed image content
because they are emissive displays so their power varies with the
Average Picture Level (average Brightness) of the image
content. For LCDs the display power is independent of image content.
Below we compare the Relative Power
Efficiencies of the OLED Tab S displays with the LCD Apple iPad Air using
data from
our Flagship Tablet
Display Technology Shoot-Out. These results are all scaled for the same
screen area and Luminance.
The OLED Tab S 8.4 with Diamond Pixels
is 27 percent more power efficient than the LCD Apple iPad Air for mixed
image content (that includes photos,
videos, and movies, for example) with a typical 50 percent Average Picture
Level.
Alternatively, the OLED Tab S 8.4 is
more power efficient than the LCD iPad Air for Average Picture Levels below
69 percent,
while the LCD iPad Air is more power
efficient for Average Picture Levels greater than 69 percent.
The OLED Tab S 8.4 with Diamond Pixels
is 32 percent more power efficient than the OLED Tab S 10.5 with RGB Stripe
Pixels.
So the OLED Tab S 10.4 is more power
efficient than the LCD iPad Air for Average Picture Levels below 47 percent
and
the LCD iPad Air is more power efficient
for Average Picture Levels greater than 47 percent.
|
|
|
Galaxy
Tab S 8.4
|
Galaxy
Tab S 10.5
|
Comments
|
|
Average Display Power
Maximum Brightness at
50% Average Picture Level
|
1.75 watts
328 cd/m2
|
3.60 watts
301 cd/m2
|
This measures the average display power
for
a wide range of image content.
|
|
Maximum Display Power
Full White Screen
at Maximum Brightness
|
3.10 watts
286 cd/m2
|
7.00 watts
280 cd/m2
|
This measures the display power for a
screen
that is entirely Peak White.
|
|
|
|
|
|
|
|
About the Author
Dr. Raymond Soneira is
President of DisplayMate Technologies Corporation of Amherst, New Hampshire,
which produces display calibration, evaluation, and diagnostic products for
consumers, technicians, and manufacturers. See www.displaymate.com. He is a research
scientist with a career that spans physics, computer science, and television
system design. Dr. Soneira obtained his Ph.D. in Theoretical Physics from
Princeton University, spent 5 years as a Long-Term Member of the world famous
Institute for Advanced Study in Princeton, another 5 years as a Principal
Investigator in the Computer Systems Research Laboratory at AT&T Bell
Laboratories, and has also designed, tested, and installed color television
broadcast equipment for the CBS Television Network Engineering and Development
Department. He has authored over 35 research articles in scientific journals in
physics and computer science, including Scientific American. If you have any
comments or questions about the article, you can contact him at dtso.info@displaymate.com.
DisplayMate Display Optimization Technology
All
Smartphone and Tablets displays can be significantly improved using
DisplayMate’s proprietary very advanced scientific analysis and mathematical
display modeling and optimization of the display hardware, factory calibration,
and driver parameters. We help manufacturers with expert display procurement,
prototype development, testing displays to meet contract specifications, and
production quality control so that they don’t make mistakes similar to those
that are exposed in our public Display Technology Shoot-Out series for
consumers. This article is a lite version of our advanced scientific analysis –
before the benefits of our DisplayMate
Display Optimization Technology, which can correct or improve all of these
issues. If you are a display or product manufacturer and want to significantly
improve display performance for a competitive advantage then Contact DisplayMate Technologies.
About DisplayMate Technologies
DisplayMate Technologies specializes in proprietary advanced
scientific display calibration and mathematical display optimization to deliver
unsurpassed objective performance, picture quality and accuracy for all types
of displays including video and computer monitors, projectors, HDTVs, mobile
displays such as smartphones and tablets, and all display technologies
including LCD, OLED, 3D, LED, LCoS, Plasma, DLP and CRT. This article is a lite version of
our intensive scientific analysis of Smartphone and Smartphone mobile displays
– before the benefits of our advanced mathematical DisplayMate Display Optimization
Technology, which can correct or improve many of the display deficiencies. We offer DisplayMate display
calibration software for consumers and advanced DisplayMate display diagnostic
and calibration software for technicians and test labs.
For
manufacturers we offer Consulting Services that include advanced Lab testing
and evaluations, confidential Shoot-Outs with competing products, calibration
and optimization for displays, cameras and their User Interface, plus on-site
and factory visits. We help manufacturers with expert display procurement,
prototype development, and production quality control so they don’t make
mistakes similar to those that are exposed in our Display Technology Shoot-Out
series. See our world renown Display
Technology Shoot-Out public article series for an introduction and preview.
DisplayMate’s
advanced scientific optimizations can make lower cost panels look as good or
better than more expensive higher performance displays. If you are a display or
product manufacturer and want to turn your display into a spectacular one to
surpass your competition then Contact
DisplayMate Technologies to learn more.
Article Links: Galaxy S5
OLED Display Technology Shoot-Out
Article Links: Flagship
Tablet LCD Display Technology Shoot-Out
Article Links: Mini Tablet
LCD Display Technology Shoot-Out.
Article Links: Display Technology Shoot-Out
Article Series Overview and Home Page
Copyright © 1990-2014 by DisplayMate
Technologies Corporation. All Rights Reserved.
This article, or any part
thereof, may not be copied, reproduced, mirrored, distributed or incorporated
into any other work without
the prior written permission of DisplayMate Technologies Corporation