iPad 2014 Display Technology Shoot-Out
iPad mini 3 and
iPad Air 2 with the iPad Air
Dr. Raymond M. Soneira
President, DisplayMate Technologies
Corporation
Copyright © 1990-2014 by DisplayMate
Technologies Corporation. All Rights Reserved.
This article, or any part
thereof, may not be copied, reproduced, mirrored, distributed or incorporated
into any other work without
the prior written permission of DisplayMate Technologies Corporation
Introduction
A key element for a great Tablet has always been a truly innovative and
top performing display, and the best leading edge Tablets have always flaunted
their beautiful high tech displays.
Apple iPads (and iPhones) were up until recently at the leading edge of
mobile displays: they were early adopters of high performance IPS LCDs, the
full 100 percent sRGB Color Gamut, and full 24-bit color, all of which
dramatically improve image and picture quality and display performance. Steve
Jobs and Apple also made display-quality a central theme for their product
marketing.
iPad 3: Their most
famous and aggressive innovation came with the introduction of the Retina
display in 2010 for the iPhone 4, where Apple doubled the pixel resolution and
Pixels Per Inch (ppi) up to where the screen appeared perfectly sharp for
normal 20/20 Vision at typical Tablet viewing distances of 10.5 inches or more.
In March 2012 the iPad 3 got its first Retina display, plus a full 100 percent
sRGB Color Gamut, which significantly improved color saturation and color
accuracy. Up until that time almost all LCD Tablets and Smartphones had 55-65
percent Color Gamuts, which produced washed out, under saturated and distorted
colors, so that red tomatoes, fire trucks, and Coke cans looked a bit orange
rather than deep red, for example. In my 2012 iPad Display Shoot-Out
I stated “with some minor calibration tweaks this new iPad would qualify as a
studio reference monitor” and was “most likely better and more accurate than
any display you own.” These were brilliant technical and marketing innovations,
and the competition was left in the dust…
iPad 4, iPad Air: But
then iPad display innovation slowed almost to a crawl: in November 2012 the
iPad 4 simply updated the hot, heavy and power hungry iPad 3 display and
battery into a nicer package. In November 2013 the original iPad Air display
was essentially unchanged and identical in performance to the iPad 4 introduced
in November 2012. It’s now 2½ years after the introduction of the innovative
iPad 3. What happened next?
Competition: While Apple display innovation
slowed, many other manufacturers just steadily pushed ahead to take the lead.
So recently Amazon, Google, Microsoft and Samsung have been launching Tablets
with the best and most innovative displays, as documented in our Display Technology Shoot-Out
article series and discussed below.
iPad mini, iPad mini with Retina display, iPad mini 3: Originally spurned, then introduced (in haste) in 2012, the
original iPad mini was a smaller version of the older 2011 iPad 2 with a
1024x768 resolution display and a reduced 62 percent Color Gamut, when the full
size iPads already had a 2048x1536 Retina display with a 100 percent Color
Gamut. In 2013 the mini was given a Retina display, but remained with a reduced
62 percent Color Gamut – the only current iPad or iPhone without a full Color
Gamut. We’ll examine in detail how much the iPad mini 3 has improved, if at
all…
iPad Air 2: Now in
October 2014, 2½ years after the introduction of the innovative iPad 3, it’s
nice to see Apple once again announcing a significantly enhanced display for
the iPad Air 2. But there are now over two years of catching up to do, and
there are many display performance issues to consider. We’ll examine how the
iPad Air 2 display has improved and compare to it to the competition.
We’ll cover these issues and much more, with in-depth comprehensive display
tests, measurements and analysis that you will find nowhere else.
The Display Shoot-Out
To examine the
performance of the new iPad mini 3 and iPad Air 2 displays we ran our in-depth series of Mobile Display Technology
Shoot-Out Lab tests and measurements in order to determine how these latest
LCD Tablet displays have improved. We take display quality very seriously and
provide in-depth objective analysis based on detailed laboratory tests and
measurements and extensive viewing tests with both test patterns, test images
and test photos. To see how far mobile displays have progressed in just four
years see our 2010
Smartphone Display Shoot-Out, and for a real history lesson see our
original 2006
Smartphone Display Shoot-Out.
Results Highlights
In this Results section we provide Highlights of the
comprehensive DisplayMate Lab tests and measurements and extensive visual
comparisons using test photos, test images, and test patterns that are covered
in the advanced sections. The main Display Shoot-Out Comparison
Table summarizes the iPad mini 3 and iPad Air 2 Lab measurements in the
following categories: Screen Reflections,
Brightness
and Contrast, Colors
and Intensities, Viewing Angles,
LCD Spectra,
Display
Power. You can also skip these Highlights and go directly to the iPad Conclusions.
Reducing Screen Reflections
A major innovation for the iPad Air 2 (that is not fully appreciated) is
an anti-reflection coating on the cover glass that reduces ambient light
reflections by about 3:1 over most other Tablets and Smartphones (including the
previous iPads), and about 2:1 over all of the very best competing Tablets and Smartphones
(including the new iPhone 6). We measured a 62 percent decrease in reflected
light glare compared to the previous iPads (Apple claims 56 percent) and agree
with Apple’s claim that the iPad Air 2 is “the least reflective display of any
Tablet in the world” – both are in fact understatements. While everyone has
been in situations where it is difficult or even impossible to see the screen
in very bright ambient lighting, where this obviously helps, it turns out that
even in moderate indoor lighting the image contrast and colors are being
noticeably washed out from reflections as well. For example, the Color Gamut is
typically reduced by 20 percent even at only 500 lux indoor lighting. To
visually compare the difference for yourself, hold two Tablets or Smartphones
side-by-side and turn off the displays so you just see the reflections. The
iPad Air 2 is dramatically darker than any other existing Tablet or Smartphone.
Those reflections are still there when you turn them on, and the brighter the
ambient light the brighter the reflections. It’s a major innovation and a big
deal with visually obvious benefits!!
The iPad Air 2 is the first iPad with an optically bonded cover glass –
all previous iPad models had high reflectance air gaps under the cover glass –
but they are simply catching up because almost all other leading Tablets have
had a bonded cover glass without an air gap for years. One minor but noticeable
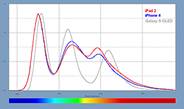
issue is that the screen Reflectance spectrum is heavily weighted towards blue,
which is may be noticeable for dark images or in bright ambient light. See the Spectrum Figure and
Screen
Reflections section for measurements and details.
iPad Display Evolution
Other than the new anti-reflection coating and bonded cover glass, the
display on the iPad Air 2 is essentially unchanged and identical in performance
to the iPad 4 introduced in 2012, and is actually slightly lower in performance
than the original iPad Air (for example 8% lower Brightness and 16% lower
display Power Efficiency) – most likely the result of an obsession with
producing a thinner Tablet forcing compromises in the LCD backlight. Similarly,
the display on the iPad mini 3 is essentially unchanged and identical in
performance to the iPad mini Retina Display introduced in 2013.
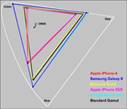
Color Gamut and Absolute Color Accuracy
In order to deliver accurate image colors, a display
needs a 100 percent sRGB / Rec.709 Standard Color Gamut that is used in
virtually all current consumer content for digital cameras, HDTVs, the
internet, and computers, including photos, videos, and movies. We measured a
slightly large 107 percent Color Gamut for the iPad Air 2 and a rather small 62
percent Color Gamut for the iPad mini 3, both almost identical with previous
iPad models. See this Figure
for the measured Color Gamuts.
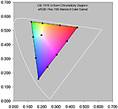
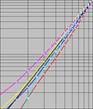
In order to produce high Absolute Color Accuracy a
display also needs an accurate (pure logarithmic power-law) Intensity Scale,
and an accurate White Point. The new iPads both have very accurate Intensity
Scales with Gammas very close to the 2.2 standard, however, they both have a
Slightly Bluish White Point, with Color Temperatures of 7,086K to 7,355K, which
is still (marginally) Very Good.
In our detailed Lab tests the measured Absolute Color
Accuracy for the for the iPad Air is 3.8 JNCD, which falls into our Good
(rather than Very Good) Color Accuracy rating. On the other hand, for the iPad
mini 3, the much smaller 62 percent Color Gamut resulted in a much higher error
of 6.8 JNCD going up as high as 22.6 JNCD, which resulted in a Good to Poor
Absolute Color Accuracy rating.
See this Figure for an explanation
and visual definition of JNCD and the Color Accuracy Plots
showing the measured display Color Errors.. See the Color
Accuracy section and the Color
Accuracy Plots for measurements and details.
Screen Brightness and
Performance in High Ambient Lighting
Mobile displays are often used under relatively bright
ambient light, which washes out the image colors and contrast, reducing picture
quality and making it harder to view or read the screen. To be usable in high
ambient light a display needs a dual combination of high screen Brightness and
low screen Reflectance – the iPad Air 2 has both. The screen Reflectance for
the iPad Air 2 is 2.5 percent, by far the lowest value that we have ever
measured due to an anti-reflection screen coating and optically bonded cover
glass without an air gap.
Our Contrast Rating for High
Ambient Light quantitatively measures screen visibility under bright
Ambient Light – the higher the better. As a result of its high Brightness and
very low Reflectance, the iPad Air 2 has a Contrast Rating for High Ambient
Light of 166, the highest that we have ever measured.
On the other hand, the
iPad mini 3 lacks the anti-reflection coating and has an air gap beneath the
cover glass, which results in a moderately high
screen Reflectance of 6.5 percent, almost triple that of iPad Air 2, so its Contrast Rating for High Ambient Light is 61, which further washes out its image colors in
ambient light…
See the Brightness
and Contrast, the High
Ambient Light and the Screen
Reflections sections for measurements and details.
Display Power Efficiency
The iPad Air 2 has 16%
lower display Power Efficiency than the (original) iPad Air – most likely the
result of an obsession with producing a thinner Tablet forcing compromises in
the LCD backlight. Other LCD Tablets have much higher display power efficiency.
For example, the Kindle Fire HDX
8.9 (with a Low Temperature Poly Silicon IPS LCD) is 27 percent more power
efficient than the iPad Air 2 for the same Luminance and screen area. See the Display
Power section for measurements and details.
Viewing Angle Performance
While Tablets are
primarily single viewer devices, the variation in display performance with
viewing angle is still very important because single viewers frequently hold
the display at a variety of viewing angles. The angle is often up to 30
degrees, more if it is resting on a table or desk.
The iPads all have IPS LCD
displays, so we expected them to show very small color shifts with Viewing
Angle, and our lab measurements confirmed their excellent Viewing Angle
performance, with no visually noticeable color shifts. However, all LCDs, do
have a strong decrease in Brightness (Luminance) with Viewing Angle, and the
iPads all showed (as expected) about a 60 percent decrease in Brightness at a
modest 30 degree viewing angle. Note that the iPads do not perform as well with
viewing angle as the iPhone 6 and iPhone 6 Plus, which have higher performance
Dual Domain pixels and Improved Polarizers. See the Viewing
Angles section for measurements and details.
Viewing Tests
The iPad Air 2 provides very nice, pleasing and fairly
accurate colors and picture quality. Although its White Point is (intentionally)
slightly too Blue, the Absolute Color Accuracy is mostly Very Good except in
the Blue to Magenta regions, which decrease its overall Color Accuracy rating.
None-the-less, the very challenging set of DisplayMate Test and Calibration
Photos that we use to evaluate picture quality looked Beautiful,
even to my experienced hyper-critical eyes.
On the other hand, for the iPad mini 3, the much smaller
62 percent Color Gamut produced visibly washed out, under saturated and
distorted colors, so that red tomatoes, fire trucks, and Coke cans looked a bit
orange rather than deep red, for example. See Figure 1 and Figure 2 and the Colors
and Intensities section for quantitative details.
iPad Air 2 and iPad mini 3 Conclusions:
One Major Innovation and One Major Disappointment…
The primary goal of this Display Technology Shoot-Out
article series has always been to point out which manufactures and display
technologies are leading and advancing the state-of-the-art of displays by
performing comprehensive and objective Lab tests and measurements together with
in-depth analysis. We point out who is leading, who is behind, who is
improving, and sometimes (unfortunately) who is back pedaling… all based solely
on the extensive objective measurements that we also publish, so that everyone
can judge the data for themselves as well… See the main Display Shoot-Out
Comparison Table for all of the measurements and details.
iPad Air 2: A Very Good Display with a Major Innovation
A major innovation for the iPad Air 2 (that is not fully appreciated) is
an anti-reflection coating on the cover glass that reduces ambient light
reflections by about 3:1 over most other Tablets and Smartphones (including the
previous iPads), and about 2:1 over all of the very best competing Tablets and Smartphones
(including the new iPhone 6). We measured a 62 percent decrease in reflected
light glare compared to the previous iPads (Apple claims 56 percent) and agree
with Apple’s claim that the iPad Air 2 is “the least reflective display of any
Tablet in the world” – both are in fact understatements. While everyone has
been in situations where it is difficult or even impossible to see the screen
in very bright ambient lighting, where this obviously helps, it turns out that
even in moderate indoor lighting the image contrast and colors are being
noticeably washed out from reflections as well. For example, the Color Gamut is
typically reduced by 20 percent even at only 500 lux indoor lighting. To
visually compare the difference for yourself, hold two Tablets or Smartphones
side-by-side and turn off the displays so you just see the reflections. The
iPad Air 2 is dramatically darker than any other existing Tablet or Smartphone.
Those reflections are still there when you turn them on, and the brighter the
ambient light the brighter the reflections. It’s a major innovation and a big
deal with visually obvious benefits!!
The iPad Air 2 is the first iPad with an optically bonded cover glass –
all previous iPad models had high reflectance air gaps under the cover glass –
but they are simply catching up because almost all other leading Tablets have
had a bonded cover glass without an air gap for years. One minor but noticeable
issue is that the screen Reflectance spectrum is heavily weighted towards blue,
which is may be noticeable for dark images or in bright ambient light. See the Spectrum Figure and
Screen
Reflections section for measurements and details.
However, other than the new anti-reflection coating and bonded cover
glass, the display on the iPad Air 2 is essentially unchanged and identical in
performance to the iPad 4 introduced in 2012, and is actually slightly lower in
performance than the original iPad Air (for example 8% lower Brightness and 16%
lower display Power Efficiency) – most likely the result of an obsession with
producing a thinner Tablet forcing compromises in the LCD backlight.
Much more significant is that the iPad Air 2 does Not have the same high
performance display technology enhancements that we measured for the new iPhone
6 and iPhone 6 Plus, which we rated the best
performing Smartphone LCD Display that we have ever tested. While the iPad Air 2 has an all around Very Good Top Tier display,
and most buyers will be happy with its performance, the displays on the Amazon, Google, Microsoft and Samsung
Tablets that we have tested (see below) have better display performance in
Absolute Color Accuracy, Brightness, Contrast Ratio, Viewing Angle, and Power
Efficiency. However, the iPad Air 2
matches or breaks new records in Tablet (and Smartphone) display performance
for: the most accurate (pure logarithmic power-law) Intensity Scale and Gamma, most accurate Image Contrast, (by far) the Lowest Screen
Reflectance, and the Highest Contrast Rating for Ambient Light. See the
main Display
Shoot-Out Comparison Table for all of the measurements and details.
Hopefully, Apple (and other manufacturers) will apply the same (or
similar) anti-reflection coatings that are on the iPad Air 2, and the same or
similar display technology enhancements on the iPhone 6 and 6 Plus to all of
their displays. As we discuss below, the most important future advancements for
displays will come with the implementation of very wide Color Gamuts with Color
Management that will dynamically compensate for the loss of color saturation in
ambient light. For LCDs that will requite Quantum Dots…
iPad mini 3: A Major Disappointment
The iPad mini can only be described as the perpetual Runt of the litter…
Originally spurned, then introduced (in haste) in 2012, it was a mini version
of the older 2011 iPad 2 with a 1024x768 resolution display and a reduced 62
percent Color Gamut, when the full size iPads already had a 2048x1536 Retina
display with a 100 percent Color Gamut. In 2013 the mini was given a Retina
display, but remained with a reduced 62 percent Color Gamut – the only current
iPad or iPhone without a full Color Gamut. Now, in 2014 the new iPad mini 3
still only has a 62 percent Color Gamut, plus it was denied the new enhanced
anti-reflection coating and bonded cover glass of the iPad Air 2. So in
addition to washed out, under saturated and distorted colors (red tomatoes,
fire trucks, and Coke cans look a bit orange rather than deep red, for example)
it continues with a moderately high screen Reflectance of 6.5 percent, almost
triple that of its favored littermate, which further washes out its image
colors in ambient light…
The mini size Tablets
from other manufacturers like Amazon, Google, and Samsung that we have tested
(see below) have excellent and significantly better mini displays. On top of
that Apple charges a premium $399 for the mini 3, just $100 less than the much
larger and higher performance iPad Air 2, and considerably more than other
competing mini Tablets. For a company like Apple that
prides itself on producing great products, the iPad mini 3 is embarrassingly
mediocre and way overpriced…
Comparing the iPad mini 3 and iPad Air 2 with other Tablets
You can compare the iPad mini 3 and iPad Air 2 display
performance with other Tablets in detail by using a tabbed web browser with our
comprehensive Lab measurements and analysis for each of the displays. Click on
each Link below. The entries are mostly identical with only minor formatting
differences, so it’s easy to make detailed comparisons.
iPad mini 3 and iPad
Air 2 Lab Measurements Comparison Table
Samsung OLED
Tab S Lab Measurements Comparison Table
Microsoft
Surface Pro 3 Lab Measurements Comparison Table
2013 Flagship
Tablets Lab Measurements Comparison Table
2013 Mini Tablets
Lab Measurements Comparison Table
The Best Tablet Display
While
the iPad Air 2 has an all around Very Good Top Tier display, the displays on
the Amazon, Google, Microsoft and Samsung Tablets that we have tested have
better overall display performance as discussed above. We recently gave the
Samsung Galaxy Tab S our overall Best Tablet
Display award, and for the time being that continues for all of the reasons
originally mentioned there. In
particular, for implementing Color Management to provide multiple Color Gamuts,
and then using the Color Management to provide the Highest Absolute Color Accuracy
for Standard (sRGB/Rec.709) consumer content of any Tablet display that we have
ever measured (in one of its four available screen modes, which many reviewers
seem to overlook). As we discuss next, dynamic Color Management is something
that every display will need to provide in the future.
With
display technology advancing rapidly on many different fronts, things can
change again in the next generation of displays – so best wishes to all of the
manufacturers and technologies in innovating and developing the next generation
of even higher-performance displays!
The Next Generation of Best
Mobile Displays
The best performing LCD and OLED displays are now
delivering impressive sharpness, brightness, low reflectance, high color
accuracy, accurate image contrast, and great viewing angles. So what comes
next? Essentially all published display specifications and factory calibrations
are based on performance in absolute darkness 0 lux, but mobile displays (and
even TVs) are seldom viewed in the dark. Even low levels of ambient light
significantly affect the image and picture quality. For example, the 100
percent sRGB Color Gamut specified by many manufacturers only applies at 0 lux.
At 500 lux, which corresponds to typical indoor office lighting, the on-screen
colors are washed out by the reflected ambient light, typically reducing the
on-screen Color Gamut from 100 percent down to 80 percent, plus the image
contrast is also significantly affected. And it gets worse as the ambient light
levels increase. So here is what needs to come next…
The most important improvements for both LCD and OLED
mobile displays will come from improving their image and picture quality and
screen readability in ambient light, which washes out the screen images,
resulting in reduced image contrast, color saturation, and color accuracy. The
key will be in implementing automatic real-time modification of the display’s
Color Gamut and Intensity Scales based the measured Ambient Light level in
order to have them compensate for the reflected light glare and image wash out
from ambient light as discussed in our 2014
Innovative Displays and Display Technology and SID
Display Technology Shoot-Out articles. LCDs will need Quantum
Dots in order to implement the necessary wide Color Gamuts. The displays, technologies, and manufacturers that succeed in
implementing this new high ambient light performance strategy will take the lead
in the next generations of mobile displays… Follow DisplayMate on Twitter to learn
about these developments and our upcoming display technology coverage.
DisplayMate Display Optimization Technology
All Tablet
and Smartphone displays can be significantly improved using DisplayMate’s
proprietary very advanced scientific analysis and mathematical display modeling
and optimization of the display hardware, factory calibration, and driver
parameters. We help manufacturers with expert display procurement, prototype
development, testing displays to meet contract specifications, and production
quality control so that they don’t make mistakes similar to those that are
exposed in our public Display Technology Shoot-Out series for consumers. This
article is a lite version of our advanced scientific analysis – before the
benefits of our DisplayMate
Display Optimization Technology, which can correct or improve all of these
issues. If you are a display or product manufacturer and want to significantly
improve display performance for a competitive advantage then Contact DisplayMate Technologies.
Display Shoot-Out Comparison Table
Below we
examine in-depth the LCD displays on the Apple iPad
mini 3 and
iPad Air 2 based on objective Lab
measurement data and criteria. For comparisons and additional background
information refer to these comparable Tablet displays: Samsung OLED Tab S
Display Technology Shoot-Out, Microsoft Surface
Pro 3 Display Technology Shoot-Out, 2013 Flagship Tablet
Display Technology Shoot-Out, and 2013 Mini Tablet
Display Technology Shoot-Out. For comparisons with the other leading
Tablet, Smartphone, and Smart Watch displays see our Mobile Display Technology
Shoot-Out series.
|
Categories
|
iPad
mini 3
|
iPad
Air
|
iPad Air
2
|
Comments
|
|
Display Technology
|
7.9 inch
Diagonal
IPS LCD
|
9.7 inch
Diagonal
IPS LCD
|
9.7 inch
Diagonal
IPS LCD
|
Liquid Crystal Display
In Plane Switching
|
|
Screen Shape
|
4:3 =
1.33
Aspect
Ratio
|
4:3 =
1.33
Aspect
Ratio
|
4:3 =
1.33
Aspect
Ratio
|
The iPads have the same shape as 8.5x11
paper.
|
|
Screen Size
|
6.3 x 4.7
inches
|
7.8 x 5.8
inches
|
7.8 x 5.8
inches
|
Display Width and Height in inches.
|
|
Screen Area
|
29.6
Square Inches
|
45.2
Square Inches
|
45.2
Square Inches
|
A better measure of size than the
diagonal length.
|
|
Relative Screen Area
|
66 percent
|
100
percent
|
100
percent
|
Relative screen areas compared to the
iPad Air.
|
|
Display Resolution
|
2048 x
1536 pixels
Full High
Definition+
Very Good
|
2048 x
1536 pixels
Full High
Definition+
Very Good
|
2048 x
1536 pixels
Full High
Definition+
Very Good
|
Screen Pixel Resolution.
|
|
Total Number of Pixels
|
3.1 Mega
Pixels
Very Good
|
3.1 Mega
Pixels
Very Good
|
3.1
Mega Pixels
Very Good
|
Total Number of Pixels.
|
|
Pixels Per Inch
|
326 PPI
Very Good
|
264 PPI
Very Good
|
264 PPI
Very Good
|
Sharpness depends on the viewing distance
and PPI.
See this on
the visual acuity for a true Retina Display
|
|
20/20 Vision Distance
where Pixels or Sub-Pixels
are Not Resolved
|
10.5
inches
with 20/20
Vision
|
13.0
inches
with 20/20
Vision
|
13.0
inches
with 20/20
Vision
|
For 20/20 Vision the minimum Viewing
Distance
where the screen appears perfectly sharp
to the eye.
At 14 inches from the screen 20/20 Vision
is 246 PPI.
|
|
Display Sharpness
at Typical Viewing Distances
|
Display
normally appears Perfectly Sharp
Pixels are
not Resolved with 20/20 Vision
|
Display
normally appears
Perfectly
Sharp
Pixels are
not Resolved
with 20/20
Vision
|
Display
normally appears
Perfectly
Sharp
Pixels are
not Resolved with 20/20 Vision
|
The Typical Viewing Distances for these
screen sizes are 12 inches or more for
the iPad mini
and 14 inches or more for the iPad Air.
|
|
Appears Perfectly Sharp
at Typical Viewing Distances
|
Yes
|
Yes
|
Yes
|
Typical Viewing Distances are 12 inches
or more for
the iPad mini and 14 inches or more for
the iPad Air.
|
|
Photo Viewer Color Depth
|
Full
24-bit Color
No
Dithering Visible
256
Intensity Levels
|
Full
24-bit Color
No
Dithering Visible
256
Intensity Levels
|
Full
24-bit Color
No
Dithering Visible
256
Intensity Levels
|
Many Android Tablets still have some
form of 16-bit color
depth in the Gallery Viewer.
The iPads do not have this issue.
|
|
Overall Assessments
This section summarizes
the results for all of the extensive Lab Measurements and Viewing Tests
performed on the display
See Screen
Reflections, Brightness
and Contrast, Colors
and Intensities, Viewing
Angles, LCD
Spectra, Display
Power.
|
Categories
|
iPad
mini 3
|
iPad
Air
|
iPad Air
2
|
Comments
|
|
Viewing Tests
in Subdued Ambient Lighting
|
Good
Images
Photos and
Videos
have Good
Color
and
Accurate Contrast
|
Very Good
Images
Photos and
Videos
have Very
Good Color
and
Accurate Contrast
|
Very Good
Images
Photos and
Videos
have Very
Good Color
and
Accurate Contrast
|
The Viewing Tests examine the accuracy
of
photographic images by comparing the
displays
to an calibrated studio monitor and
HDTV.
|
|
Variation with Viewing Angle
Colors and Brightness
See Viewing
Angles
|
Small
Color Shifts
with
Viewing Angle
Large
Brightness Shift
with
Viewing Angle
Typical
for all LCDs
|
Small
Color Shifts
with
Viewing Angle
Large
Brightness Shift
with
Viewing Angle
Typical
for all LCDs
|
Small
Color Shifts
with
Viewing Angle
Large
Brightness Shift
with
Viewing Angle
Typical
for all LCDs
|
The iPad displays all have a relatively
large
decrease in Brightness with Viewing
Angle and
relatively small Color Shifts with
Viewing Angle.
See the Viewing
Angles
section for details.
|
|
Overall Display Assessment
Lab Tests and Measurements
|
Good LCD Display
Small Color
Gamut
|
Very Good LCD Display
|
Very Good LCD Display
|
The iPad Air displays both performed
very well in the Lab Tests and
Measurements.
|
|
|
|
Color Gamut
|
62 percent
sRGB /
Rec.709
|
108
percent
sRGB /
Rec.709
|
107
percent
sRGB /
Rec.709
|
sRGB
/ Rec.709 is the color standard for most
content
and needed for accurate color reproduction.
|
|
Absolute Color Accuracy
Measured over Entire Gamut
See Figure 2 and Colors
|
Poor
Absolute
Color Accuracy
Large
Color Errors
6.8 up to
22.6 JNCD
|
Very Good
Absolute
Color Accuracy
Small
Color Errors
3.2 JNCD
|
Good
Absolute
Color Accuracy
Medium
Color Errors
3.9 JNCD
|
Absolute
Color Accuracy is measured with a
Spectroradiometer
for 21 Reference Colors
uniformly
distributed within the entire Color Gamut.
See
Figure 2 and Colors
and Intensities for details.
|
|
Image Contrast Accuracy
See Figure 3 and Contrast
|
Excellent
Image
Contrast Accuracy
Close to
Standard
Gamma 2.21
|
Excellent
Image
Contrast Accuracy
Close to
Standard
Gamma 2.23
|
Excellent
Image
Contrast Accuracy
Close to
Standard
Gamma 2.25
|
The
Image Contrast Accuracy is determined by
measuring
the Log Intensity Scale and Gamma.
See
Figure 3 and Brightness
and Contrast for details.
|
|
Performance in Ambient Light
Display Brightness
Screen Reflectance
Contrast Rating
See Brightness
and Contrast
See Screen
Reflections
|
High
Display Brightness
394 nits
Medium
Reflectance
6.5
percent
Medium Contrast
Rating
for High
Ambient Light
61 Good
|
High
Display Brightness
449 nits
Medium
Reflectance
6.5
percent
Medium
Contrast Rating
for High
Ambient Light
69 Good
|
High
Display Brightness
415 nits
Very Low
Reflectance
2.5
percent
Very High
Contrast Rating
for High
Ambient Light
166 Excellent
|
Tablets
are seldom used in the dark.
Screen
Brightness and Reflectance determine
the
Contrast Rating for High Ambient Light.
See
the Brightness
and Contrast section for details.
See
the Screen
Reflections section for details.
|
|
Overall Display Calibration
Image and Picture Quality
Lab Tests and Viewing Tests
|
Good Calibration
White Point
Slightly Too
Blue
7,086 K
|
Very Good Calibration
White Point
Slightly Too
Blue
7,041 K
|
Very Good Calibration
White Point
Somewhat Too
Blue
7,355 K
|
All of the iPads have a slightly Bluish
White.
Some people prefer that but it does
affect all of
the Low Saturation Colors.
|
|
|
Overall Display Grade
Overall Assessment
|
Good
Display B
Small Color
Gamut
|
Very Good
Display A–
Same as the
iPad 4
|
Very Good
Display A–
Innovative
Anti-Reflection
|
The iPad Air Displays have Very Good all
around
Top Tier Display Performance. The iPad
Air 2 has
a very Innovative Anti-Reflection screen
coating.
The iPad mini 3 has a poor Small Color
Gamut.
|
|
|
iPad
mini 3
|
iPad
Air
|
iPad Air
2
|
Comments
|
|
Screen Reflections
All display screens are mirrors good enough to use
for personal grooming – but that is actually a very bad feature…
We measured the light reflected from all directions
and also direct mirror (specular) reflections, which are much more
distracting and cause more eye strain. Many Tablets
still have greater than 6 percent reflections that make the
screen much harder to read even in moderate ambient
light levels, requiring ever higher brightness settings that waste
precious battery power. Hopefully manufacturers
will reduce the mirror reflections with anti-reflection coatings and
matte or haze surface finishes.
Our Lab Measurements include Average Reflectance
for Ambient Light from All Directions and for Mirror Reflections.
The iPad mini 3 and original iPad Air
have an Air Gap under the Cover Glass, which increases Screen Reflectance.
The iPad Air 2 has a bonded Cover Glass
without an Air Gap like most other current premium Tablets.
The iPad Air 2 has a very innovative
Anti-Reflection screen coating that produces the
Lowest Reflectance that we have ever
measured for a Tablet or Smartphone.
|
Categories
|
iPad
mini 3
|
iPad
Air
|
iPad
Air 2
|
Comments
|
|
Average Screen Reflection
Light From All Directions
|
6.5
percent
Ambient
Light Reflections
Good
|
6.5
percent
Ambient
Light Reflections
Good
|
2.5 percent
Ambient
Light Reflections
Outstanding
|
Measured using an Integrating Hemisphere
and
a Spectroradiometer. The best value we
have
ever measured for a Tablet is 2.5
percent.
|
|
Relative Brightness of the
Reflected Ambient Light
|
2.6 times
the Lowest
|
2.6 times
the Lowest
|
Lowest
62 percent
Lower Glare
|
Relative Brightness of the Reflected
Ambient Light
Expressed as a percentage of the lowest
amount.
|
|
Mirror Reflections
Percentage of Light Reflected
|
8.3 percent
for Mirror Reflections
Good
|
8.5 percent
for Mirror Reflections
Good
|
2.9 percent
for Mirror Reflections
Outstanding
|
These are the most annoying types of
Reflections.
Measured using a Spectroradiometer and a
narrow
collimated pencil beam of light
reflected off the screen.
|
|
Cover Glass with Display
|
Cover Glass has Air
Gap
Increases Reflectance
|
Cover Glass has Air
Gap
Increases Reflectance
|
Bonded Cover Glass
Anti-Reflection
Coating
|
The Cover Glass and other optical layers
above the
Display have a significant impact on the
Reflectance.
|
|
Brightness and Contrast
The Contrast Ratio
is the specification that gets the most attention, but it only applies for
low ambient light, which is seldom
the case for mobile displays. Much more important
is the Contrast Rating, which indicates how
easy it is to read the screen
under high ambient lighting and depends on both
the Maximum Brightness and the Screen Reflectance. The larger the better.
All of the iPads have Very Good
Brightness in the range of about 400 to 450 nits.
The iPad mini 3 has a 20 percent lower
Contrast Ratio than the iPad Air and Air 2.
The iPad Air 2 has the Highest Contrast
Rating for High Ambient Light that we have ever measured as the result of Low
Reflectance.
|
Categories
|
iPad
mini 3
|
iPad
Air
|
iPad Air
2
|
Comments
|
|
Measured Average Brightness
50% Average Picture Level
|
Brightness
394 cd/m2
Very Good
|
Brightness
449 cd/m2
Very Good
|
Brightness
415 cd/m2
Very Good
|
This is the Brightness for typical
screen content
that has a 50% Average Picture Level.
|
|
Measured Full Brightness
100% Full Screen White
|
Brightness
394 cd/m2
Very Good
|
Brightness
449 cd/m2
Very Good
|
Brightness
415 cd/m2
Very Good
|
This is the Brightness for a screen that
is entirely
all white with 100% Average Picture
Level.
|
|
Measured Peak Brightness
1% Full Screen White
|
Brightness
394 cd/m2
Very Good
|
Brightness
449 cd/m2
Very Good
|
Brightness
415 cd/m2
Very Good
|
This is the Peak Brightness for a screen
that
has only a tiny 1% Average Picture
Level.
|
|
Measured Auto Brightness
in High Ambient Light
with Automatic Brightness On
|
Max Auto
Brightness
394 cd/m2
Very Good
|
Max Auto
Brightness
449 cd/m2
Very Good
|
Max Auto
Brightness
415 cd/m2
Very Good
|
Some displays have a higher Maximum
Brightness
in Automatic Brightness Mode.
|
|
Low Ambient Light
|
|
Lowest Peak Brightness
Brightness Slider to Minimum
|
6 cd/m2
Very Good
For Very
Low Light
|
6 cd/m2
Very Good
For Very
Low Light
|
5 cd/m2
Very Good
For Very
Low Light
|
This is the Lowest Brightness with the
Slider set to
Minimum. This is useful for working in
very dark
environments. Picture Quality remained
Excellent.
|
|
True Black Brightness at 0 lux
at Maximum Brightness Setting
|
0.44 cd/m2
Very Good
for Mobile
|
0.39 cd/m2
Very Good
for Mobile
|
0.39 cd/m2
Very Good
for Mobile
|
Black brightness is important for low
ambient light,
which is seldom the case for mobile
devices.
|
|
True Contrast Ratio at 0 lux
Relevant for Low Ambient Light
|
895
Very Good
for Mobile
|
1,151
Very Good
for Mobile
|
1,064
Very Good
for Mobile
|
Only relevant for Low Ambient Light,
which is seldom the case for mobile
devices.
|
|
High Ambient Light
|
|
Contrast Rating
for High Ambient Light
The Higher the Better
for Screen Readability
in High Ambient Light
|
61
Good
61
With Auto
Brightness
Good
|
69
Good
69
With Auto
Brightness
Good
|
166
Excellent
166
With Auto
Brightness
Excellent
|
Depends on the Screen Reflectance and
Brightness.
Defined as Maximum Brightness / Average Reflectance.
Some displays have a higher maximum Brightness
in Automatic Brightness Mode.
|
|
Screen Readability
in High Ambient Light
|
Good B
Good B
With Auto Brightness
|
Good B
Good B
With Auto Brightness
|
Excellent A
Excellent A
With Auto Brightness
|
Indicates how easy it is to read the
screen
under high ambient lighting. Depends on
both the Screen Reflectance and
Brightness.
See High
Ambient Light Screen Shots
|
|
Colors and Intensities
The Color Gamut, Intensity Scale, and White Point
determine the quality and accuracy of all displayed images and all
the image colors. Bigger is definitely Not Better
because the display needs to match all the standards that were used
when the content was produced. For LCDs a wider
Color Gamut reduces the power efficiency and the Intensity Scale
affects both image brightness and color mixture
accuracy.
All of the iPads continue with a
Slightly Bluish White Point. The White Point Accuracy is more critical than
for other
colors because it affects all of the low
saturation colors and white is more noticeable because it often fills the
screen.
The Bluish White Point and the shifted
Blue Primary result in somewhat higher Absolute Color Errors.
The iPad mini 3 performs poorly as the
result of its small 62 percent sRGB/Rec.709 Color Gamut.
|
Categories
|
iPad
mini 3
|
iPad
Air
|
iPad Air
2
|
Comments
|
|
Color of White
Color Temperature in degrees
See Figure 2 for JNCD
Measured in the dark at 0 lux
For the Plotted White Points
See Figure 1
|
7,086 K
1.6 JNCD
from D65 White
White is
Slightly Bluish
See Figure 1
See Figure 2 for JNCD
|
7,041 K
1.4 JNCD
from D65 White
White is
Slightly Bluish
See Figure 1
See Figure 2 for JNCD
|
7,355 K
2.4 JNCD
from D65 White
White is
Somewhat Bluish
See Figure 1
See Figure 2 for JNCD
|
D65 with 6,500 K is the standard color
of White
for most Consumer Content and needed for
accurate color reproduction of all
images.
JNCD is a Just Noticeable Color Difference.
White Point Accuracy is more critical than
other Colors.
See Figure 2 for the
definition of JNCD.
|
|
Color Gamut
Measured in the dark at 0 lux
See Figure 1
|
62 percent
sRGB /
Rec.709
Gamut Too
Small
See Figure 1
|
108
percent
sRGB /
Rec.709
Fairly
Close to Standard
See Figure 1
|
107
percent
sRGB /
Rec.709
Fairly
Close to Standard
See Figure 1
|
sRGB / Rec.709 is the color standard for
most
content and needed for accurate color
reproduction.
|
|
Color Accuracy
|
|
Absolute Color Accuracy
Average Color Error at 0 lux
For 21 Reference Colors
Just Noticeable Color Difference
See Figure 2
|
Average
Color Shift
From
sRGB/Rec.709
Δ(u’v’)
= 0.0274
6.8 JNCD
Good Accuracy
See Figure 2
|
Average
Color Error
From
sRGB/Rec.709
Δ(u’v’)
= 0.0129
3.2 JNCD
Very Good
Accuracy
See Figure 2
|
Average
Color Error
From
sRGB/Rec.709
Δ(u’v’)
= 0.0155
3.9 JNCD
Good
Accuracy
See Figure 2
|
JNCD is a Just Noticeable Color Difference.
See Figure 2 for the definition
of JNCD and for
Accuracy Plots showing
the measured Color Errors.
Average Errors below 3.5 JNCD are Very
Good.
Average Errors 3.5 to 7.0 JNCD are
Good.
Average Errors above 7.0 JNCD are Poor.
|
|
Absolute Color Accuracy
Largest Color Error at 0 lux
For 21 Reference Colors
Just Noticeable Color Difference
See Figure 2
|
Largest Color Shift
From
sRGB/Rec.709
Δ(u’v’)
= 0.0906
22.6 JNCD
for Blue
Poor
Accuracy
See Figure 2
|
Largest Color Error
From
sRGB/Rec.709
Δ(u’v’)
= 0.0316
7.9 JNCD
for Magenta
Good
Accuracy
See Figure 2
|
Largest Color Error
From
sRGB/Rec.709
Δ(u’v’)
= 0.0350
8.8 JNCD
for Magenta
Good
Accuracy
See Figure 2
|
JNCD is a Just Noticeable Color Difference.
See Figure 2 for the
definition of JNCD and for
Accuracy Plots showing
the measured Color Errors.
Largest Errors below 7.0 JNCD are
Very Good.
Largest Errors 7.0 to 14.0 JNCD are
Good.
Largest Errors above 14.0 JNCD are
Poor.
This is twice the limit for the Average
Error.
|
|
Intensity Scale
|
|
Dynamic Brightness
Luminance Decrease with
Average Picture Level APL
|
0 percent
Decrease
Excellent
|
0 percent
Decrease
Excellent
|
0 percent
Decrease
Excellent
|
This is the percent Brightness decrease
with APL
Average Picture Level. Ideally should be
0 percent.
|
|
Intensity Scale and
Image Contrast
See Figure 3
|
Very
Smooth and Straight
Excellent
Image Contrast
See Figure 3
|
Very
Smooth and Straight
Excellent
Image Contrast
See Figure 3
|
Very
Smooth and Straight
Excellent
Image Contrast
See Figure 3
|
The Intensity Scale controls image
contrast needed
for accurate Image Contrast and Color
reproduction.
See Figure 3
|
|
Gamma for the Intensity Scale
Larger has more Image Contrast
See Figure 3
|
2.21
Excellent
Close to
Perfect
|
2.23
Excellent
Close to
Perfect
|
2.25
Excellent
Very Close
to Standard
|
Gamma is the log slope of the Intensity
Scale.
Gamma of 2.20 is the standard and needed
for
accurate Image Contrast and Color
reproduction.
See Figure 3
|
|
Image Contrast Accuracy
|
Excellent
|
Excellent
|
Excellent
|
See Figure 3
|
|
Viewing Angles
The variation of
Brightness, Contrast, and Color with Viewing Angle is especially important
for Tablets because
of their larger screen
and multiple viewers. The typical manufacturer 176+ degree specification for
LCD Viewing Angle
is nonsense because that
is where the Contrast Ratio falls to a miniscule 10. For most LCDs there are
substantial
degradations at less
than ±30 degrees, which is not an atypical Viewing Angle for Tablets and
Smartphones.
Note that the Viewing
Angle performance is also very important for a single viewer because the
Viewing Angle can vary
significantly based on
how the Tablet is held. The Viewing Angle can be very large if resting on a
table or desk.
All
of the iPads perform as expected for IPS LCDs.
|
Categories
|
iPad
mini 3
|
iPad
Air
|
iPad Air
2
|
Comments
|
|
Brightness Decrease
at a 30 degree Viewing Angle
|
–59
percent Portrait
–57
percent Landscape
Very Large
Decrease
Typical for
all LCDs
|
–62
percent Portrait
–60
percent Landscape
Very Large
Decrease
Typical for
all LCDs
|
–62 percent Portrait
–58
percent Landscape
Very Large
Decrease
Typical for
all LCDs
|
Most screens become less bright when
tilted.
LCD decrease is due to optical
absorption.
LCD decrease is generally greater than 50
percent.
|
|
Contrast Ratio at 0 lux
at a 30 degree Viewing Angle
|
550
Portrait
501 Landscape
Very Good
for Mobile
|
665
Portrait
478 Landscape
Very Good
for Mobile
|
650
Portrait
500 Landscape
Very Good
for Mobile
|
A measure of screen readability when the
screen
is tilted under low ambient lighting.
|
|
White Point Color Shift
at a 30 degree Viewing Angle
|
Small
Color Shift
Δ(u’v’)
= 0.0066
1.7 JNCD Excellent
|
Small
Color Shift
Δ(u’v’)
= 0.0049
1.2 JNCD Excellent
|
Small
Color Shift
Δ(u’v’)
= 0.0033
0.8 JNCD Excellent
|
JNCD is a Just Noticeable Color Difference.
See Figure 2 for the
definition of JNCD.
Same Rating Scale as Absolute Color
Accuracy.
|
|
Primary Color Shifts
Largest Color Shift for R,G,B
at a 30 degree Viewing Angle
|
Largest Color Shift
Δ(u’v’)
= 0.0105
for Blue
2.6 JNCD Very Good
|
Largest Color Shift
Δ(u’v’)
= 0.0027
for Blue
0.7 JNCD Excellent
|
Largest Color Shift
Δ(u’v’)
= 0.0053
for Blue
1.3 JNCD Excellent
|
JNCD is a Just Noticeable Color Difference.
See Figure 2 for the
definition of JNCD.
Same Rating Scale as Absolute Color
Accuracy.
|
|
Color Shifts for Color Mixtures
at a 30 degree Viewing Angle
Reference Brown (255, 128, 0)
|
Small
Color Shift
Δ(u’v’)
= 0.0074
1.9 JNCD Very Good
|
Small
Color Shift
Δ(u’v’)
= 0.0038
1.0 JNCD Excellent
|
Small
Color Shift
Δ(u’v’)
= 0.0097
2.4 JNCD Very Good
|
JNCD is a Just Noticeable Color Difference.
Color Shifts for non-IPS LCDs are about 10
JNCD.
Reference Brown is a good indicator of
color shifts
with angle because of unequal drive
levels and
roughly equal luminance contributions
from Red
and Green. See Figure 2 for the
definition of JNCD.
|
|
Display Power Consumption
The display power was measured using a Linear
Regression between Luminance and AC Power with a fully charged battery.
Since the displays all have different screen sizes
and maximum brightness, the values were also scaled to the
same screen brightness (Luminance) and same screen
area in order to compare their Relative Power Efficiencies.
Below we compare the Relative Display
Power Efficiencies of the Tablets.
The results are all scaled for the same
brightness (Luminance) and same screen area as the iPad Air 2.
The iPad Air 2 has 16% lower display Power Efficiency than
the (original) iPad Air – most likely the result of an obsession with
producing a thinner Tablet forcing compromises in the LCD backlight.
Comparison with Other Tablets
The Kindle Fire HDX
8.9 (with a Low Temperature Poly Silicon IPS LCD) is 27 percent more
power efficient
than the iPad Air 2 for the same
Luminance and screen area.
|
|
Categories
|
iPad
mini 3
|
iPad
Air
|
iPad Air
2
|
Comments
|
|
Average Display Power
Maximum Brightness at
50% Average Picture Level
|
3.4 watts
394 cd/m2
|
4.8 watts
449 cd/m2
|
5.1 watts
415 cd/m2
|
This measures the average display power
for
a wide range of image content.
|
|
Maximum Display Power
Full White Screen
at Maximum Brightness
|
3.4 watts
394 cd/m2
|
4.8 watts
449 cd/m2
|
5.1 watts
415 cd/m2
|
This measures the display power for a
screen
that is entirely Peak White.
|
|
Relative Power Efficiency
Same Luminance 415 cd/m2
Same 45.2 inch screen area
|
Relative Power 125%
Relative Efficiency 80%
5.5 watts
62% Color Gamut
|
Relative Power 100%
Relative Efficiency
100%
4.4 watts
108% Color Gamut
|
Relative Power 116%
Relative Efficiency 84%
5.1 watts
107% Color Gamut
|
This compares the Maximum Power
Efficiency
by scaling to the same screen brightness
and
same screen area as the iPad Air.
The Power Efficiency is also dependent
on the ppi
and size of the Color Gamut,
particularly for LCDs.
|
About the Author
Dr. Raymond Soneira is
President of DisplayMate Technologies Corporation of Amherst, New Hampshire,
which produces display calibration, evaluation, and diagnostic products for
consumers, technicians, and manufacturers. See www.displaymate.com. He is a research
scientist with a career that spans physics, computer science, and television
system design. Dr. Soneira obtained his Ph.D. in Theoretical Physics from
Princeton University, spent 5 years as a Long-Term Member of the world famous
Institute for Advanced Study in Princeton, another 5 years as a Principal
Investigator in the Computer Systems Research Laboratory at AT&T Bell
Laboratories, and has also designed, tested, and installed color television
broadcast equipment for the CBS Television Network Engineering and Development
Department. He has authored over 35 research articles in scientific journals in
physics and computer science, including Scientific American. If you have any
comments or questions about the article, you can contact him at dtso.info@displaymate.com.
DisplayMate Display Optimization Technology
All Tablet
and Smartphone displays can be significantly improved using DisplayMate’s
proprietary very advanced scientific analysis and mathematical display modeling
and optimization of the display hardware, factory calibration, and driver
parameters. We help manufacturers with expert display procurement, prototype
development, testing displays to meet contract specifications, and production
quality control so that they don’t make mistakes similar to those that are
exposed in our public Display Technology Shoot-Out series for consumers. This article
is a lite version of our advanced scientific analysis – before the benefits of
our DisplayMate Display
Optimization Technology, which can correct or improve all of these issues.
If you are a display or product manufacturer and want to significantly improve
display performance for a competitive advantage then Contact DisplayMate Technologies.
About DisplayMate Technologies
DisplayMate Technologies specializes in proprietary advanced
scientific display calibration and mathematical display optimization to deliver
unsurpassed objective performance, picture quality and accuracy for all types
of displays including video and computer monitors, projectors, HDTVs, mobile
displays such as Tablets and Smartphones, and all display technologies
including LCD, LCD, 3D, LED, LCoS, Plasma, DLP and CRT. This article is a lite version of
our intensive scientific analysis of Tablet and Smartphone mobile displays –
before the benefits of our advanced mathematical DisplayMate Display Optimization
Technology, which can correct or improve many of the display deficiencies. We offer DisplayMate display
calibration software for consumers and advanced DisplayMate display diagnostic
and calibration software for technicians and test labs.
For
manufacturers we offer Consulting Services that include advanced Lab testing and
evaluations, confidential Shoot-Outs with competing products, calibration and
optimization for displays, cameras and their User Interface, plus on-site and
factory visits. We help manufacturers with expert display procurement,
prototype development, and production quality control so they don’t make
mistakes similar to those that are exposed in our Display Technology Shoot-Out
series. See our world renown Display
Technology Shoot-Out public article series for an introduction and preview.
DisplayMate’s
advanced scientific optimizations can make lower cost panels look as good or
better than more expensive higher performance displays. If you are a display or
product manufacturer and want to turn your display into a spectacular one to
surpass your competition then Contact
DisplayMate Technologies to learn more.
Article Links: Samsung
OLED Tab S Display Technology Shoot-Out
Article Links: Microsoft
Surface Pro 3 Display Technology Shoot-Out
Article Links: 2013 Flagship
Tablet Display Technology Shoot-Out
Article Links: 2013 Mini
Tablet Display Technology Shoot-Out
Article Links: Display Technology Shoot-Out
Article Series Overview and Home Page
Copyright © 1990-2014 by DisplayMate
Technologies Corporation. All Rights Reserved.
This article, or any part
thereof, may not be copied, reproduced, mirrored, distributed or incorporated
into any other work without
the prior written permission of DisplayMate Technologies Corporation