Surface Pro Display Technology Shoot-Out
Microsoft Surface Pro 4
Dr. Raymond M. Soneira
President, DisplayMate Technologies
Corporation
Copyright © 1990-2015 by DisplayMate
Technologies Corporation. All Rights Reserved.
This article, or any part
thereof, may not be copied, reproduced, mirrored, distributed or incorporated
into any other work without
the prior written permission of DisplayMate Technologies Corporation
Introduction
The key element for a great Tablet has always been a truly innovative
and top performing display, and the best leading edge Tablets have always
flaunted their beautiful high tech displays.
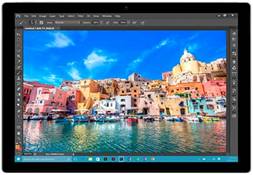
With the latest fourth generation Surface Pro 4, Microsoft has produced
another excellent professional grade high performance display for Windows that
breaks a number of LCD Tablet performance records. In fact, based on our
extensive lab tests and measurements, the Surface Pro 4 has one of the very
best and most accurate displays available on any mobile platform and OS. It
joins near the top of a small set of Tablets that have excellent top tier
displays – for professionals that need a very accurate and high performance
display for their work, and for consumers that want and appreciate a really
nice and beautiful display.
The display on the Surface Pro 4 is actually a major upgrade and
enhancement to the already excellent display on the Surface Pro 3, with
significantly higher screen resolution (2736x1824 to 2160x1440), 24 percent
higher Pixels Per Inch (267 to 216 ppi), and 60 percent more total pixels (5.0
to 3.1 million). In addition, every display performance metric has been
improved over the already excellent Surface Pro 3, including the display’s
Maximum Brightness, Contrast Ratio, Absolute Color Accuracy, Viewing Angle
Performance, and with lower screen Reflectance, resulting in much better
performance in Ambient Light. We’ll cover these issues and much more, with
in-depth comprehensive display tests, measurements and analysis that you will
find nowhere else.
Microsoft provided
DisplayMate Technologies with a production unit of the Surface Pro 4 so that we
could perform our well known objective and comprehensive display Lab tests,
measurements, and analysis, explaining the in-depth display performance results
for consumers, reviewers, and journalists.
The Display Shoot-Out
To examine the
performance of the Microsoft Surface Pro 4 Display
we ran our in-depth series of Mobile
Display Technology Shoot-Out Lab tests and measurements in order to
determine how it performs compared to other leading Tablets. We take display
quality very seriously and provide in-depth objective analysis based on
detailed laboratory tests and measurements and extensive viewing tests with
both test patterns, test images and test photos. To see how far LCD and OLED
mobile displays have progressed in just five years see our 2010 Smartphone
Display Shoot-Out, and for a real history lesson see our original 2006 Smartphone
Display Shoot-Out.
Results Highlights
In this Results section we provide Highlights of the
comprehensive DisplayMate Lab tests and measurements and extensive visual
comparisons using test photos, test images, and test patterns that are covered
in the advanced sections. The Display
Shoot-Out Comparison Table summarizes the Lab measurements in the following
categories: Screen
Reflections, Brightness
and Contrast, Colors
and Intensities, Viewing
Angles, LCD
Spectra, Display
Power. You can also skip these Highlights and go directly to the Conclusions.
12.3 inch Display with 3:2
Aspect Ratio
The Surface Pro 4 is
designed to perform both as a large Tablet and a small Laptop with its
detachable keyboard. With a 12.3 inch screen diagonal it is considerably larger
than most Tablets, with a screen area that is 54% larger than the Apple iPad
Air 2, and 40% larger than the Samsung Galaxy Tab S 10.5, but 13% smaller than
the iPad Pro. With its adjustable kickstand, the angle of the display can be
adjusted in the same way as a Laptop, an important viewing and working
advantage.
The Screen’s 3:2 (1.50) Aspect Ratio is an excellent
compromise between the 4:3 (1.33) Aspect Ratio for most documents (the same as
8.5x11 inch paper with 0.5 inch borders, and also the iPad’s 4:3 (1.33) Aspect
Ratio) and 16:9 (1.78) Aspect Ratio for widescreen video content (and similar
to Android Tablets that have a 16:10 (1.60) Aspect Ratio).
Display Sharpness and
Sub-Pixel Rendering
The display’s 2736x1824 pixel resolution has 5.0 Mega
Pixels, 2.4 times the number of pixels on an HDTV, but on a 12.3 inch screen.
The screen’s 267 pixels per inch (ppi) is Excellent for a full size Tablet, a
trifle higher than the 264 ppi for the Apple iPad Air 2 and iPad Pro (so the
Surface Pro 4 is what Apple classifies as a Retina Display), but slightly lower
than the record high 287 ppi for the Samsung Galaxy Tab S 10.5 inch Tablet. The
larger the screen the further away its typical viewing distance. The Surface
Pro 4 pixels are not resolved with normal 20/20 Vision at viewing distances of
13 inches or more, so the display appears perfectly sharp for typical viewing
distances of 16 inches or more. In addition, the Surface Pro 4 uses Sub-Pixel
Rendering (called ClearType in Microsoft’s implementation) that significantly
improves the visual sharpness of text over standard Pixel Rendering that is
used in most mobile displays. For black and white and gray images with
sub-pixel rendering, there is up to a factor of 3 improvement in image
sharpness.
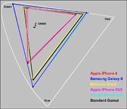
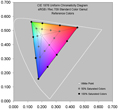
Color Gamut and Absolute Color Accuracy
The Surface Pro 4 has the most accurate on-screen colors
of any Tablet display that we have ever measured for the sRGB/Rec.709 Standard
that is used for virtually all current consumer content for digital cameras,
HDTVs, the internet, and computers, including photos, videos, and movies. The
Color Gamut is 102 percent, very close to the Standard Gamut as shown in this Figure. The Average
Absolute Color Accuracy over the entire Color Gamut is an Excellent 1.9 JNCD,
which is typically visually indistinguishable from perfect. It is the most
color accurate display that we have ever measured for a Tablet. The Maximum
Color Error of 4.1 JNCD is larger, but it is centered on Blue, which is less
visually important as explained in this article.
See this Figure for an
explanation and visual definition of JNCD and
the Color Accuracy Figures
showing the measured Color Errors. See the Color
Accuracy section, the Color
Gamut Figure, and the Color
Accuracy Figures for measurements and details.
Producing high Absolute Color Accuracy is incredibly
difficult because everything on the display has to be done just right. In
addition, Microsoft itself individually calibrates every Surface Pro 4 display
on the production line to optimize the Color Gamut and White Point. Color
Accuracy is especially important for professional imaging applications when you
must be sure of the on-screen image colors, when viewing photos from family and
friends (because you often know exactly what they actually should look like),
for some TV shows, movies, and sporting events with image content and colors
that you are familiar with, and also for viewing online merchandise, so you
have a very good idea of exactly what colors you are buying and are less likely
to return them.
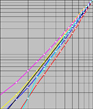
Intensity Scale and Accurate
Image Contrast
The
Intensity Scale (sometimes called the Gray Scale) not only controls the
contrast within all displayed images but it also controls how the Red, Green
and Blue primary colors mix to produce all of the on-screen colors. So if the
Intensity Scale doesn't follow the Standard that is used to produce virtually
all consumer content then the colors and intensities will be wrong everywhere
in all images. Unfortunately, many manufacturers are quite sloppy with the
Intensity Scale on their displays (because it is logarithmic and not linear).
Fortunately, the Intensity Scale on Surface Pro 4 is a close match to the
sRGB/Rec.709 Standard – very smooth and (logarithmically) straight, but
slightly less steep, with a slope Gamma of 2.13 compared to the Standard 2.20.
See Figure 3 for a plot of the
measured Intensity Scale and the Colors
and Intensities section for measurements and
details.
Display Brightness
The Surface Pro 4 has a measured Peak Brightness of 436
cd/m2 (nits), which is Very Good, and among the highest for full
size Tablets that are 9 inches or larger, but still lower than many Smartphones
and smaller Tablets. High screen Brightness is only needed when in High Ambient
Light, but since the Surface Pro 4 is larger it is less likely to be opened
outdoors in unshielded high ambient light environments like Smartphones and
smaller Tablets, so its Peak Brightness should not be an issue for most users
and applications. See the Brightness
and Contrast section for measurements and details.
Display Contrast Ratio
The Display’s Maximum Contrast is the Ratio between its
Peak White Brightness (Luminance) and its darkest Black Luminance, one of the
more important measures of LCD performance quality. We measured the Black
Luminance at 0.31 nits, giving the Surface Pro 4 a True Contrast Ratio of 1406,
higher than Microsoft’s own specification of 1300, and among the highest we
have ever measured for a mobile LCD display. Note that some manufacturers list
a much higher (Dynamic) Contrast Ratio for their LCDs, but that is just
meaningless marketing puffery. The Contrast Ratio changes with Viewing Angle,
and the Surface Pro 4 has the highest we have ever measured for an LCD Tablet
(see below).
Screen Reflectance and Performance in Ambient Lighting
Displays are seldom used in absolute darkness, so their
Screen Reflectance and performance in Ambient Lighting is very important. For
the Surface Pro 4 it is not as critical as with Smartphones and smaller Tablets
because its larger 12.3 inch screen is less likely to be opened outdoors in
unshielded high ambient light environments. The adjustable kickstand is
particularly useful for adjusting the display angle in order to minimize
reflections.
The Surface Pro 4 has a Gorilla Glass 4 cover that is
optically bonded to the PixelSense Pen and Touch Interface and the LCD panel
without any air gaps. The measured Screen Reflectance for the Surface Pro 4 is
5.6 percent, which is Very Good and lower than most other Tablets and
Smartphones, but also much higher than the iPad Air 2, which has an
Anti-Reflection coating that provides 2.5 percent Reflectance.
The display’s Contrast Rating
for High Ambient Light measures the screen’s readability in Ambient
Light and depends on both the Screen Reflectance and Maximum Brightness. For
the Surface Pro 4 it is 78, which is Very Good and 24 percent higher than the
Surface Pro 3, and better than most full size Tablets, but also much lower than
the 166 for iPad Air 2 with its low Reflectance coating. However, the
adjustable kickstand for the Surface Pro 4 can be used to reduce reflections,
and its larger 12.3 inch screen is less likely to be opened outdoors in
unshielded high ambient light environments. See the Screen
Reflections and Brightness
and Contrast sections for measurements and details.
Viewing Angle Performance
While Tablets are
primarily single viewer devices, the variation in display performance with
Viewing Angle is still very important because single viewers frequently hold
the display at a variety of viewing angles, plus they are large enough for
sharing the screen with others. One important advantage of the Surface Pro 4 is
its adjustable kickstand, which makes it possible to adjust the Viewing Angle
of the display in the same way as a Laptop. That is not only convenient but
also reduces any Viewing Angle effects.
The Surface Pro 4 has a
high performance IPS / PLS LCD display, so we expected it to show very small
color shifts with Viewing Angle, and our lab measurements confirmed its
excellent Viewing Angle performance, with no visually noticeable color shifts.
The Contrast Ratio also changes with Viewing Angle, and at 30 degrees the
Surface Pro 4 Contrast Ratio is 809 in Landscape mode and 865 in Portrait mode,
the highest we have ever measured for an LCD Tablet. However, all LCDs, do have
a strong decrease in Brightness (Luminance) with Viewing Angle, and the Surface
Pro 4 showed (as expected) slightly more than a 50 percent decrease in
Brightness at a modest 30 degree viewing angle. See the Viewing
Angles section for measurements and details.
Viewing Tests
With its accurate Intensity Scale and high Color Accuracy
the Surface Pro 4 provides very nice, pleasing and accurate image colors and
picture quality. The very challenging set of DisplayMate Test and Calibration
Photos that we use to evaluate picture quality looked Beautiful,
even to my experienced hyper-critical eyes. However, viewers that instead like
vivid or exaggerated colors and image contrast may find the accurate Surface
Pro 4 images to appear somewhat subdued.
Display Power Efficiency
While the Surface Pro 4 display is considerably larger in
area than the other top tier Tablets and would normally be expected to require
considerably more power, its display is more power efficient and it actually
uses less power than many smaller Tablets (including the iPad Air 2). The
Surface Pro 4 has a Display Power Efficiency comparable to the Surface Pro 3,
but considerably better than the iPad Air 2. On the other hand, the higher
Pixels Per Inch lowers the Display Power Efficiency because at higher densities
the LCD Backplane circuitry proportionally blocks more of the Backlight.
However, the IGZO Metal Oxide Backplane in the Surface Pro 4 reduces this
effect and increases the light output improving its power efficiency. See the Display
Power section for measurements and details.
Surface Pro 4 Conclusions: An Excellent
Top Tier Display…
The primary goal of this Display Technology Shoot-Out
article series has always been to publicize and promote display excellence
so that consumers, journalists and even manufacturers are aware of and
appreciate the very best in displays and display technology. We point out which
manufactures and display technologies are leading and advancing the
state-of-the-art for displays by performing comprehensive and objective
scientific Lab tests and measurements together with in-depth analysis. We point
out who is leading, who is behind, who is improving, and sometimes
(unfortunately) who is back pedaling… all based solely on the extensive
objective careful Lab measurements that we also publish, so that everyone can
judge the data for themselves as well…
The Conclusions below summarize all the major results.
See the main Display
Shoot-Out Comparison Table for all the DisplayMate Lab measurements and
test details, and see the Results Highlights section
above for a more detailed introduction and overview with expanded discussions
and explanations.
An Excellent Top Tier Display
Based on our extensive Lab tests and measurements on the display for the
Surface Pro 4, Microsoft has produced an excellent professional grade high
performance display for Windows that breaks a number of LCD Tablet performance
records. In fact, the Surface Pro 4 has one of the very best and most accurate
displays available on any mobile platform and OS. It joins near the top of a
small set of Tablets that have excellent top tier displays – ideal for
professionals that need a very accurate high performance display for their
work, and for consumers that want and appreciate a really nice and beautiful
display.
In addition, what is particularly significant and impressive is that
Microsoft has systematically improved every display performance metric over the
already excellent Surface Pro 3, including the display’s Maximum Brightness,
Contrast Ratio, Absolute Color Accuracy, Viewing Angle Performance, and with
lower screen Reflectance, resulting in much better performance in Ambient
Light.
The Surface Pro 4 delivers uniformly consistent all around Top Tier
display performance: it is only one of a few displays to ever to get all Green
(Very Good to Excellent) Ratings in all test and measurement categories (except
for Brightness variation with Viewing Angle, which is the case for all LCDs)
since we started the Display Technology Shoot-Out article Series in 2006, an
impressive achievement for a display. See the Shoot-Out
Comparison Table for the detailed test and measurement results.
Most Accurate Colors
The Surface Pro 4 also
has the most accurate on-screen colors of any Tablet display that we have ever
measured for the sRGB/Rec.709 Standard that is used for virtually all current
consumer content for digital cameras, HDTVs, the internet, and computers,
including photos, videos, and movies. That is another impressive achievement
because everything in the display has to perform just right in order to produce
very accurate colors – it is the single most challenging and important
performance characteristic for a display. The Average Absolute Color Accuracy
for the Surface Pro 4 is an Excellent 1.9 JNCD, which is typically visually
indistinguishable from perfect. It is the most color accurate display that we
have ever measured for a Tablet. The Maximum Color Error of 4.1 JNCD is larger,
but it is centered on Blue, which is less visually important as explained in
this article.
See the Color
Accuracy section and Color
Accuracy Figures for measurements and details.
Color Accuracy is especially important for professional
imaging applications when you must be sure of the on-screen image colors, when
viewing photos from family and friends (because you often know exactly what
they actually should look like), for some TV shows, movies, and sporting events
with image content and colors that you are familiar with, and also for viewing
online merchandise, so you have a very good idea of exactly what colors you are
buying and are less likely to return them.
There are many other applications that require or would
benefit from much better Absolute Color Accuracy, such as in sales and
marketing presentations, and especially in medical imaging, where it can
improve diagnostic accuracy for doctors, hospitals and patients. For digital
photography, the Surface Pro 4 is an excellent large mobile display that has
much better picture quality and color accuracy than the camera's own display,
for reviewing your photos as you are taking them or for showing them off.
Comparing Tablet Displays
You can
directly compare all of the display performance measurements and results for
many other Tablets by referring our Mobile Display Technology Shoot-Out article series by using a
Tabbed web browser on the Comparison Table for each article. The entries for
all the articles are mostly identical with only minor formatting differences,
so it’s easy to make detailed side-by-side comparisons by simply clicking
through the Tabs for each Tablet.
Below are
links for the Tablet Comparison Tables mentioned in the article:
Microsoft
Surface Pro 4 Display Technology Shoot-Out
Microsoft
Surface Pro 3 Display Technology Shoot-Out
Apple iPad Air 2
Display Technology Shoot-Out
Samsung OLED
Tablet Display Technology Shoot-Out
The Next Generation of Mobile Displays – Better Performance in Ambient
Light
The most important improvements for both LCD and OLED
mobile displays will come from improving their image and picture quality and
screen readability in real world ambient light, which washes out the screen
images, resulting in reduced image contrast, color saturation, and color
accuracy. The key will be in lowering screen Reflectance and implementing
Dynamic Color Management with automatic real-time modification of the display’s
native Color Gamut and Intensity Scales based the measured Ambient Light level
in order to have them compensate for the reflected light glare and image wash
out from ambient light as discussed in our 2014
Innovative Displays and Display Technology and SID
Display Technology Shoot-Out articles.
The displays, technologies, and manufacturers that
succeed in implementing this new real world high ambient light performance
strategy will take the lead in the next generations of mobile displays… Follow DisplayMate
on Twitter to learn about these developments and our upcoming display
technology coverage.
DisplayMate Display Optimization Technology
All
Smartphone and Tablet displays can be significantly improved using
DisplayMate’s proprietary very advanced scientific analysis and mathematical
display modeling and optimization of the display hardware, factory calibration,
and driver parameters. We help manufacturers with expert display procurement,
prototype development, testing displays to meet contract specifications, and
production quality control so that they don’t make mistakes similar to those
that are exposed in our public Display Technology Shoot-Out series for
consumers. This article is a lite version of our advanced scientific analysis –
before the benefits of our DisplayMate
Display Optimization Technology, which can correct or improve all of these
issues. If you are a display or product manufacturer and want to significantly
improve display performance for a competitive advantage then Contact DisplayMate Technologies.
Display Shoot-Out Comparison Table
Below we
examine in-depth the display on the Microsoft Surface
Pro 4 based on objective Lab
measurement data and criteria. For comparisons and additional background
information see our Surface Pro 3
Display Technology Shoot-Out, our Surface 3 Display
Technology Shoot-Out, our iPad Air 2 Display
Technology Shoot-Out and our OLED Tablet
Display Technology Shoot-Out articles.
For
comparisons with the other leading Tablets, Smartphones and Smart Watch
displays see our Mobile
Display Technology Shoot-Out series.
Display Specifications
|
Categories
|
Microsoft
Surface Pro 4
|
Comments
|
|
Display Technology
|
12.3 inch
diagonal
IPS / PLS
LCD
IGZO Metal
Oxide LCD Backplane
with a
PixelSense Pen and Touch Interface
|
The diagonal screen size.
In Plane Switching / Plane to Line Switching
Indium Gallium Zinc Oxide
|
|
Screen Shape
|
3:2 =
1.50
Aspect
Ratio
|
The 3:2 Aspect Ratio is between 4:3 for
documents
and 16:9 for widescreen video content.
|
|
Screen Area
|
69.8
Square inches
|
A better measure of size than the
diagonal length.
|
|
Display Pixel Resolution
|
2736 x
1824 pixels
|
Screen Pixel Resolution.
|
|
Total Number of Pixels
|
5.0 Mega
Pixels
|
Total Number of Pixels.
|
|
Pixels Per Inch
|
267 ppi
RGB Stripe
Pixels
with
ClearType Sub-Pixel Rendering
Very Good
|
Sharpness depends on the viewing distance
and ppi.
See this on
the visual acuity for a true Retina Display
|
|
20/20 Vision Distance
where Pixels or Sub-Pixels
are Not Resolved
|
Individual
Pixels are Not Resolved at 12.9 inches or more
|
For 20/20 Vision the minimum Viewing
Distance
where the screen appears perfectly sharp
to the eye.
|
|
Display Sharpness
at Typical Viewing Distances
|
Display
Appears Perfectly Sharp
Pixels are
not Resolved with 20/20 Vision
at Typical
Viewing Distances of
16 inches
or more
The
Sub-Pixel Rendering significantly improves Display Sharpness
|
The Typical Viewing Distances for this
screen size
are 16 inches or more.
|
|
Appears Perfectly Sharp
at Typical Viewing Distances
|
Yes
|
Typical Viewing Distances are 16 inches
or more.
|
|
Photo Viewer Color Depth
|
Full 24-bit Color
No
Dithering Visible
256
Intensity Levels
|
Many Android Smartphones and Tablets
still have some form of 16-bit color
depth in the Gallery Viewer.
The Surface Pro 4 does not have this issue.
|
|
Overall Assessments
This section summarizes
the results for all of the extensive Lab Measurements and Viewing Tests
performed on the display
See Screen
Reflections, Brightness
and Contrast, Colors
and Intensities, Viewing
Angles, LCD
Spectra, Display
Power.
|
|
|
Surface
Pro 4
|
Comments
|
|
Viewing Tests
in Subdued Ambient Lighting
|
Very Good
Images
Photos and
Videos
have
Excellent Color
and
Accurate Contrast
|
The Viewing Tests examine the accuracy
of
photographic images by comparing the
displays
to a calibrated studio monitor and HDTV.
|
|
Variation with Viewing Angle
Colors and Brightness
See Viewing
Angles
|
Small Color
Shifts
with Viewing
Angle
Large
Brightness Shift
with
Viewing Angle
Typical for
all LCDs
|
The Surface Pro 4 display has small
Color Shifts
with Viewing Angle.
All LCDs show a large Brightness shift
with angle.
See the Viewing
Angles
section for details.
|
|
Overall Display Assessment
Lab Tests and Measurements
|
Excellent
LCD Display
|
The Surface Pro 4 display performed very
well
in the Lab Tests and Measurements.
|
|
|
|
Color Gamut
|
102 percent
sRGB /
Rec.709
|
sRGB
/ Rec.709 is the color standard for most
content
and needed for accurate color reproduction.
|
|
Absolute Color Accuracy
Measured over Entire Gamut
See Figure 2 and Colors
|
Excellent
Color Accuracy
Color
Errors are Small
Average
1.9 JNCD
Very
Accurate Display
|
Absolute
Color Accuracy is measured with a
Spectroradiometer
for 21 Reference Colors
uniformly
distributed within the entire Color Gamut.
See
Figure 2 and Colors
and Intensities for details.
|
|
Image Contrast Accuracy
See Figure 3 and Contrast
|
Very Good
Contrast Accuracy
Image
Contrast
Slightly
Too Low
|
The
Image Contrast Accuracy is determined by
measuring
the Log Intensity Scale and Gamma.
See
Figure 3 and Brightness
and Contrast for details.
|
|
Performance in Ambient Light
Display Brightness
Screen Reflectance
Contrast Rating
See Brightness
and Contrast
See Screen
Reflections
|
High
Display Brightness
436 nits
Medium
Reflectance
5.6
percent
Contrast
Rating
in High
Ambient Light
78 Very Good
|
Tablets
are seldom used in the dark.
Screen
Brightness and Reflectance determine
the
Contrast Rating for High Ambient Light.
See
the Brightness
and Contrast section for details.
See
the Screen
Reflections section for details.
|
|
Overall Display Calibration
Image and Picture Quality
Lab Tests and Viewing Tests
|
Excellent
Calibration
|
The Surface Pro 4 factory calibration
delivers
very accurate colors and excellent
overall
image and picture quality.
|
|
|
Overall Display Grade
Overall
Assessment
|
Overall Surface Pro 4 Display
Grade is A
Excellent Top Tier Mobile Display
|
The Surface Pro 4 is an excellent Top Tier
professional grade high performance
display
that has one of the very best and most
accurate
displays available on any mobile platform
and OS.
|
|
|
Surface Pro 4
|
Comments
|
|
Screen Reflections
All display screens are mirrors good enough to use
for personal grooming – but that is actually a very bad feature…
We measured the light reflected from all directions
and also direct mirror (specular) reflections, which are much more
distracting and cause more eye strain. Many Tablets
still have greater than 10 percent reflections that make the
screen much harder to read even in moderate ambient
light levels, requiring ever higher brightness settings that waste
precious battery power. Hopefully manufacturers
will reduce the mirror reflections with anti-reflection coatings and
matte or haze surface finishes.
Our Lab Measurements include Average Reflectance
for Ambient Light from All Directions and for Mirror Reflections.
|
|
|
Surface
Pro 4
|
Comments
|
|
Average Screen Reflection
Light From All Directions
|
5.6
percent
Ambient
Light Reflections
Very Good
|
Measured using an Integrating Hemisphere
and
a Spectroradiometer. The best value we
have
ever measured for a full size Tablet is
2.5 percent.
|
|
Mirror Reflections
Percentage of Light Reflected
|
6.3 percent
for Mirror Reflections
Very Good
|
These are the most annoying types of
Reflections.
Measured using a Spectroradiometer and a
narrow
collimated pencil beam of light
reflected off the screen.
|
|
Brightness and Contrast
The Contrast Ratio
is the specification that gets the most attention, but it only applies for
low ambient light, which is seldom
the case for mobile displays. Much more important
is the Contrast Rating, which indicates how
easy it is to read the screen
under high ambient lighting and depends on both
the Maximum Brightness and the Screen Reflectance. The larger the better.
|
|
|
Surface
Pro 4
|
Comments
|
|
Measured Maximum Brightness
100% Full Screen White
|
Brightness
436 cd/m2
Very Good
|
This is the Brightness for a screen that
is entirely
all white with 100% Average Picture Level.
|
|
Measured Peak Brightness
1% Full Screen White
|
Brightness
436 cd/m2
Very Good
|
This is the Peak Brightness for a screen
that
has only a tiny 1% Average Picture
Level.
|
|
Low Ambient Light
|
|
Lowest Peak Brightness
Brightness Slider to Minimum
|
7 cd/m2
Very Good
for Low Light
|
The Lowest Brightness with the Slider
set to Minimum. This is useful for working in very dark environments.
|
|
Black Brightness at 0 lux
at Maximum Brightness Setting
|
0.31 cd/m2
Very Good
for Mobile
|
Black brightness is important for Low
Ambient Light,
which is seldom the case for mobile
devices.
|
|
Contrast Ratio at 0 lux
Relevant for Low Ambient Light
|
1,406
Very Good
for Mobile
|
Only relevant for Low Ambient Light,
which is seldom the case for mobile
devices.
|
|
High Ambient Light
|
|
Contrast Rating
for High Ambient Light
|
78
Very Good
|
Depends on the Screen Reflectance and
Brightness.
Defined as Maximum Brightness / Average Reflectance.
|
|
Screen Readability
in High Ambient Light
|
Very Good A –
|
Indicates how easy it is to read the
screen
under high ambient lighting. Depends on
both the Screen Reflectance and
Brightness.
See High
Ambient Light Screen Shots
|
|
Colors and Intensities
The Color Gamut, Intensity Scale, and White Point
determine the quality and accuracy of all displayed images and all
the image colors. Bigger is definitely Not Better
because the display needs to match all the standards that were used
when the content was produced. For LCDs a wider
Color Gamut reduces the power efficiency and the Intensity Scale
affects both image brightness and color mixture
accuracy.
|
|
|
Surface
Pro 4
|
Comments
|
|
Color of White
Color Temperature in degrees
Measured in the dark at 0 lux
See Figure 1
|
6,886 K
Close to
Standard
1.5 JNCD
from D65 White
See Figure 1
|
D65 with 6,500 K is the standard color of
White
for most Consumer Content and needed for
accurate color reproduction of all
images.
See Figure 1
for the plotted White Points.
|
|
Color Gamut
Measured in the dark at 0 lux
See Figure 1
|
102
percent
sRGB /
Rec.709
Close to
Standard
See Figure 1
|
sRGB / Rec.709 is the color standard for
most
content and needed for accurate color
reproduction.
|
|
Color Accuracy
|
|
Absolute Color Accuracy
Average Color Error at 0 lux
For 21 Reference Colors
Just Noticeable Color Difference
See Figure 2
|
Average
Color Error
From sRGB
/ Rec.709
Δ(u’v’)
= 0.0076
1.9 JNCD
Excellent
Accuracy
See Figure 2
|
JNCD is a Just Noticeable Color Difference.
See Figure 2 for the
definition of JNCD and for
Accuracy Plots showing
the measured Color Errors.
Average Errors below 3.5 JNCD are Very
Good.
Average Errors 3.5 to 7.0 JNCD are
Good.
Average Errors above 7.0 JNCD are
Poor.
|
|
Absolute Color Accuracy
Largest Color Error at 0 lux
For 21 Reference Colors
Just Noticeable Color Difference
See Figure 2
|
Largest Color Error
From sRGB
/ Rec.709
Δ(u’v’)
= 0.0165
4.1 JNCD
for Blue
Very Good
Accuracy
See Figure 2
|
JNCD is a Just Noticeable Color Difference.
See Figure 2 for the
definition of JNCD and for
Accuracy Plots showing
the measured Color Errors.
Largest Errors below 7.0 JNCD are
Very Good.
Largest Errors 7.0 to 14.0 JNCD are
Good.
Largest Errors above 14.0 JNCD are
Poor.
This is twice the limit for the Average
Error.
|
|
Intensity Scale
|
|
Dynamic Brightness
Luminance Decrease with
Average Picture Level APL
|
No
Decrease
Excellent
|
This is the percent Brightness decrease
with APL
Average Picture Level. Ideally should be
0 percent.
|
|
Intensity Scale and
Image Contrast
See Figure 3
|
Very
Smooth and Straight
But
Slightly Too Low
See Figure 3
|
The Intensity Scale controls image
contrast needed
for accurate Image Contrast and Color
reproduction.
See Figure 3
|
|
Gamma for the Intensity Scale
Larger has more Image Contrast
See Figure 3
|
Average
Gamma is 2.13
Close to
2.20 Standard
But
Slightly Too Low
|
Gamma is the log slope of the Intensity
Scale.
Gamma of 2.20 is the standard and needed
for
accurate Image Contrast and Color
reproduction.
See Figure 3
|
|
Image Contrast Accuracy
|
Very Good
Contrast Accuracy
|
See Figure 3
|
|
Viewing Angles
The variation of
Brightness, Contrast, and Color with Viewing Angle is especially important
for Tablets because
of their larger screen
and multiple viewers. The typical manufacturer 176+ degree specification for
LCD Viewing Angle
is nonsense because that
is where the Contrast Ratio falls to a miniscule 10. For most LCDs there are
substantial
degradations at less
than ±30 degrees, which is not an atypical Viewing Angle for Tablets and
Smartphones.
Note that the Viewing
Angle performance is also very important for a single viewer because the
Viewing Angle can vary
significantly based on
how the Tablet is held. The Viewing Angle can be very large if resting on a
table or desk.
|
|
|
Surface
Pro 4
|
Comments
|
|
Brightness Decrease
at a 30 degree Viewing Angle
|
55
percent Decrease
Large
Decrease
Typical
for all LCDs
|
Most screens become less bright when tilted.
LCD decrease is generally greater than 50
percent.
|
|
Contrast Ratio at 0 lux
at a 30 degree Viewing Angle
|
809
for Landscape
865 for
Portrait
Very Good
for Mobile
|
A measure of screen readability when the
screen
is tilted under low ambient lighting.
|
|
White Point Color Shift
at a 30 degree Viewing Angle
|
Small Color
Shift
Δ(u’v’)
= 0.0069
1.7 JNCD
White
moves closer to D65 within 0.2 JNCD
|
JNCD is a Just Noticeable Color Difference.
See Figure 2 for the
definition of JNCD.
|
|
Primary Color Shifts
Largest Color Shift for R,G,B
at a 30 degree Viewing Angle
|
Small Color
Shift
Largest Δ(u’v’) = 0.0056
for Blue
1.4 JNCD
|
JNCD is a Just Noticeable Color Difference.
See Figure 2 for the
definition of JNCD.
|
|
Color Shifts for Color Mixtures
at a 30 degree Viewing Angle
Reference Brown (255, 128, 0)
|
Small Color
Shift
Δ(u’v’)
= 0.0058
1.4 JNCD
|
JNCD is a Just Noticeable Color Difference.
Color Shifts for non-IPS LCDs are about 10
JNCD.
Reference Brown is a good indicator of
color shifts
with angle because of unequal drive
levels and
roughly equal luminance contributions
from Red
and Green. See Figure 2 for the
definition of JNCD.
|
|
Display Power Consumption
The display power was
measured using a Linear Regression between Luminance and AC Power with a
fully charged battery.
Since the displays all have different screen sizes
and maximum brightness, the values were also scaled to the
same screen brightness (Luminance) and same screen
area in order to compare their Relative Power Efficiency.
LCDs are typically more power efficient for images with
mostly white content (like text screens, for example), while OLEDs
are more power efficient for mixed image content
because they are emissive displays so their power varies with the
Average Picture Level (average Brightness) of the image
content. For LCDs the display power is independent of image content.
The Surface Pro 4 has a
Display Power Efficiency comparable to the Surface Pro 3, but considerably
better than the iPad Air 2.
The higher Pixels Per Inch lowers the Display
Power Efficiency because the Backplane circuitry proportionally blocks more
of the Backlight.
The IGZO Metal Oxide Backplane in the
Surface Pro 4 reduces this effect and increases the light output improving
its power efficiency.
|
|
|
Microsoft
Surface
Pro 3
|
Microsoft
Surface
Pro 4
|
Apple
iPad Air
2
|
Comments
|
|
Maximum Display Power
Full White Screen
at Maximum Brightness
|
3.5 watts
371 cd/m2
66.5 inch2
Screen Area
|
4.8 watts
436 cd/m2
69.8 inch2
Screen Area
|
5.1 watts
415 cd/m2
45.2 inch2
Screen Area
|
This measures the display power for a
screen that
is entirely at Peak White for Maximum
Brightness.
|
|
Relative Power Efficiency
Display Power Scaled to the:
Same Luminance 436 cd/m2 Same
Screen Area 69.8 inch2
|
4.3 watts
216 Pixels
Per Inch
|
4.8 watts
267 Pixels Per Inch
|
8.3 watts
264 Pixels Per Inch
|
This compares the Relative Power
Efficiency
by scaling to the same screen brightness
and
same screen area as the Surface Pro 4.
Higher Pixels Per Inch lowers the Power
Efficiency.
|
|
|
|
|
|
|
|
|
About the Author
Dr. Raymond Soneira is
President of DisplayMate Technologies Corporation of Amherst, New Hampshire,
which produces display calibration, evaluation, and diagnostic products for
consumers, technicians, and manufacturers. See www.displaymate.com. He is a research
scientist with a career that spans physics, computer science, and television
system design. Dr. Soneira obtained his Ph.D. in Theoretical Physics from
Princeton University, spent 5 years as a Long-Term Member of the world famous
Institute for Advanced Study in Princeton, another 5 years as a Principal
Investigator in the Computer Systems Research Laboratory at AT&T Bell
Laboratories, and has also designed, tested, and installed color television
broadcast equipment for the CBS Television Network Engineering and Development
Department. He has authored over 35 research articles in scientific journals in
physics and computer science, including Scientific American. If you have any
comments or questions about the article, you can contact him at dtso.info@displaymate.com.
DisplayMate Display Optimization Technology
All
Smartphone and Tablets displays can be significantly improved using
DisplayMate’s proprietary very advanced scientific analysis and mathematical
display modeling and optimization of the display hardware, factory calibration,
and driver parameters. We help manufacturers with expert display procurement,
prototype development, testing displays to meet contract specifications, and
production quality control so that they don’t make mistakes similar to those
that are exposed in our public Display Technology Shoot-Out series for
consumers. This article is a lite version of our advanced scientific analysis –
before the benefits of our DisplayMate
Display Optimization Technology, which can correct or improve all of these
issues. If you are a display or product manufacturer and want to significantly
improve display performance for a competitive advantage then Contact DisplayMate Technologies.
About DisplayMate Technologies
DisplayMate Technologies specializes in proprietary advanced
scientific display calibration and mathematical display optimization to deliver
unsurpassed objective performance, picture quality and accuracy for all types
of displays including video and computer monitors, projectors, HDTVs, mobile
displays such as Smartphones and Tablets, and all display technologies
including LCD, OLED, 3D, LED, LCoS, Plasma, DLP and CRT. This article is a lite version of
our intensive scientific analysis of Smartphone and Tablet mobile displays –
before the benefits of our advanced mathematical DisplayMate Display Optimization
Technology, which can correct or improve many of the display deficiencies. We offer DisplayMate display
calibration software for consumers and advanced DisplayMate display diagnostic
and calibration software for technicians and test labs.
For
manufacturers we offer Consulting Services that include advanced Lab testing
and evaluations, confidential Shoot-Outs with competing products, calibration
and optimization for displays, cameras and their User Interface, plus on-site
and factory visits. We help manufacturers with expert display procurement,
prototype development, and production quality control so they don’t make
mistakes similar to those that are exposed in our Display Technology Shoot-Out
series. See our world renown Display
Technology Shoot-Out public article series for an introduction and preview.
DisplayMate’s
advanced scientific optimizations can make lower cost panels look as good or
better than more expensive higher performance displays. If you are a display or
product manufacturer and want to turn your display into a spectacular one to
surpass your competition then Contact
DisplayMate Technologies to learn more.
Article Links: Surface
Pro 3 Display Technology Shoot-Out
Article Links: Surface 3
Display Technology Shoot-Out
Article Links: iPad Air 2
Display Technology Shoot-Out
Article Links: OLED
Tablet Display Technology Shoot-Out
Article Links: Display Technology Shoot-Out
Article Series Overview and Home Page
Copyright © 1990-2015 by DisplayMate
Technologies Corporation. All Rights Reserved.
This article, or any part
thereof, may not be copied, reproduced, mirrored, distributed or incorporated
into any other work without
the prior written permission of DisplayMate Technologies Corporation