Mini Tablet Display Technology Shoot-Out
Amazon Kindle Fire HDX 7 –
Apple iPad mini Retina Display – new Google Nexus 7
Dr. Raymond M. Soneira
President, DisplayMate Technologies
Corporation
Copyright © 1990-2013 by DisplayMate
Technologies Corporation. All Rights Reserved.
This article, or any part
thereof, may not be copied, reproduced, mirrored, distributed or incorporated
into any other work without
the prior written permission of DisplayMate Technologies Corporation
Introduction
A new generation of Mini 7 to 8 inch Tablets from three of the major
manufacturers has just completed with the belated launch of the Apple iPad mini with Retina Display. Together with the Amazon
Kindle Fire HDX 7 and new Google Nexus 7 (2013)
they all should be, in principle, a notch down from the Large Size Flagship
Tablets that we recently tested. But the Mini Tablets are growing rapidly in
popularity and market share, so it’s a fiercely competitive category. As a
result, they have some of the very highest technology displays with Quantum
Dots, Low Temperature Poly Silicon, IGZO and/or high efficiency Backlight LEDs,
all of which have a major impact on real image quality that we examine below.
The 7 inch tablet format was pioneered by the Barnes & Noble Nook
Color, Amazon Kindle Fire, and (original) Google Nexus 7. After dismissing the
smaller 7 inch tablets, Apple subsequently introduced in 2012 its own iPad
mini, with a 7.9-inch 1024×768 display with a (surprisingly) much smaller Color
Gamut and higher screen Reflectance than the existing models of the Kindle Fire
and Nexus 7. A lot has happened to displays and display technology over the
past year so this is much more than a rematch…
These new Mini Tablets all have higher than Full High Definition displays
that have about 325 PPI Pixels Per Inch. At normal viewing distances a person
with 20/20 Vision can’t resolve the individual pixels, so the displays appear
to be perfectly sharp. With high resolution and sharpness taken care of (for
now), there are many other equally important and even more challenging issues
for Mini Tablets displays:
1. Picture quality as
good or better than your HDTV (to entice you to watch downloaded content).
2. Excellent true color
accuracy and accurate image contrast for high fidelity images of all viewed
content.
3. Improved screen
performance in high ambient light since Tablets aren’t used in the dark.
We’ll cover these issues and much more, with in-depth comprehensive
display tests, measurements and analysis that you will find nowhere else.
Amazon provided DisplayMate Technologies with a production unit of the
Kindle Fire HDX 7 to test and analyze for this Display Technology Shoot-Out
article.
The Shoot-Out
To examine the display performance of the Amazon Kindle Fire HDX 7, the
Apple iPad mini Retina Display, and the new Google Nexus 7 (2013) we ran our in-depth series
of Mobile Display Technology
Shoot-Out Lab tests. We take display quality very seriously and provide
in-depth objective analysis and side-by-side comparisons based on detailed
laboratory measurements and extensive viewing tests with both test patterns and
test images. To see how far mobile displays have progressed in just three years
see our 2010
Smartphone Display Shoot-Out and 2011 Tablet Display
Shoot-Out, and for a real history lesson see our original 2006 Smartphone
Display Shoot-Out.
Results Highlights
In this Results section we provide Highlights of the
comprehensive Lab measurements and extensive side-by-side visual comparisons
using test photos, test images and test patterns that are presented below. The Comparison Table
section summarizes the Lab measurements in the following categories: Screen
Reflections, Brightness
and Contrast, Colors
and Intensities, Viewing Angles,
Display White
Spectrum, Display
Power Consumption, Running
Time on Battery. You can also skip the Highlights and go directly to the Conclusions.
For
additional background and information see our 2013 Flagship Tablet
Display Shoot-Out, our 2012 Mini Tablet
Display Shoot-Out, and our SID
Tablet Display Technology Shoot-Out.
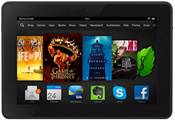
Overview of the Kindle Fire
HDX 7
The Kindle Fire HDX 7 is Amazon’s 3rd generation LCD
Tablet, and their displays have been improving by leaps and bounds since we
first tested them back in 2011. Their Full Size Flagship Kindle Fire HDX 8.9 is
the best performing Tablet display that we have ever tested, due in part to
using the highest performance LCDs with Low Temperature Poly Silicon LTPS. But
the Mini Kindle Fire HDX 7 that we test here is also incredibly innovative
because it is the first Tablet display to use super high technology Quantum
Dots, which produce highly saturated primary colors for LCDs that are similar
to those produced by OLED displays. They not only significantly increase the
Color Gamut to 100 percent but also improve the power efficiency at the same
time. It’s a very impressive display with very impressive technology. More on
these issues below.
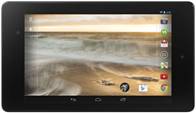
Overview of the new Google
Nexus 7
The new Google Nexus 7 (manufactured for Google by Asus)
has a very impressive display that uses the highest performance LCDs with Low
Temperature Poly Silicon LTPS, the same technology used in the iPhone 4 and 5,
but on the new Nexus 7 with more than 3 times the screen area – it’s currently
the second largest LTPS on a mobile display after the Kindle Fire HDX 8.9
mentioned above. The very high efficiency LTPS technology allows the new Nexus
7 display to provide a full 100 percent Color Gamut and at the same time
produce the brightest Tablet display that we have measured so far in this
Shoot-Out series. More on these issues below.
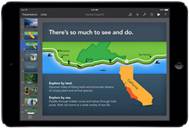
Overview of the iPad mini
Retina Display
The iPad mini with Retina Display is Apple’s second
generation Mini Tablet. The first generation iPad mini was disappointing
because not only did it have a low resolution low PPI display, but its small 62
percent Color Gamut was the same as the older iPad 2, instead of the 100
percent Color Gamut on the iPad 3 and iPad 4 (and the new iPad Air). The new
iPad mini with Retina Display has a high resolution high PPI display like the
other two Mini Tablets that we test here. But shockingly, it still has the same
small 63 percent Color Gamut as the original iPad mini and even older iPad 2.
As a result, the iPad mini with Retina Display comes in with a distant 3rd
place finish behind the innovative displays on the Kindle Fire HDX 7 and new
Nexus 7. More on these issues below.
IGZO and LTPS
For
the last two years one of the most talked about developments in display
technology has been the introduction of IGZO (Indium Gallium Zinc Oxide). For
both LCD and OLED displays, IGZO can be used to make the electronic circuitry
in their Backplanes, which controls all of the pixels and sub-pixels. IGZO’s
higher electron mobility allows the circuitry to be much smaller compared to
traditional amorphous Silicon a-Si, which is currently what is used in most LCD
displays. That allows the brightness and power efficiency of the display to
significantly increase, which is very important. But the introduction of IGZO
has been repeatedly delayed as the result of production and yield issues.
Although all of the major display manufacturers are working on IGZO, Sharp has
been the biggest advocate, and it is currently shipping some IGZO displays,
including in the current iPads. LG is also shipping IGZO displays, including in
its OLED TV, but not currently for the iPads.
This
has created a production problem where Apple is using both IGZO and a-Si
displays in the current iPads. The problem is that a-Si has much lower power
efficiency than IGZO, so it uses much more power and also needs bigger
batteries. So how can Apple use both display technologies in the same product?
I’ve been told by using much higher performance (and cost) White LEDs in the
Backlight of the a-Si panels, which equalizes the power efficiency for both
types of displays in different ways. As a result, both types of displays can be
engineered into the same Tablet and can provide comparable results for the
consumer.
All
of this reliance on IGZO is really bad planning… Right now there is a readily
available display technology that has much higher performance than IGZO. It’s
Low Temperature Poly Silicon LTPS, and it is used in all of the iPhones and in
all of Samsung OLEDs (so it’s available in large quantities). Two innovative
Tablet manufacturers, Amazon and Google, have significantly leapfrogged Apple
by introducing Tablet displays using LTPS (in the Kindle Fire HDX 8.9 and the
new Nexus 7), and they are significantly outperforming the IGZO and a-Si
displays in the current iPads. Apple is now lagging in displays, an area where
it was once the leader…
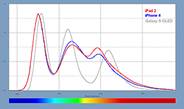
Quantum Dots
While
IGZO has been getting most of the attention, a dark horse called Quantum Dots
has emerged as a new and truly revolutionary super high-tech advancement for
LCD displays – and it is showing up for the first time in the Kindle Fire HDX
7, which we test here.
Quantum
Dots are almost magical because they use Quantum Physics to produce highly
saturated primary colors for LCDs that are similar to those produced by OLED
displays. They not only significantly increase the size of the Color Gamut by
40-50 percent but also improve the power efficiency by an additional 15-20
percent. Instead of using White LEDs (which have yellow phosphors) that produce
a broad light spectrum that makes it hard to efficiently produce saturated
colors, Quantum Dots directly convert the light from Blue LEDs into highly
saturated primary colors for LCDs. You can see the remarkable difference in
their light spectra in Figure
4. Quantum Dots are going to revolutionize LCDs for the next 5+ years. To
learn more about Quantum Dots read this from Nanosys.
Congratulations to Amazon for leading the way and being the first to
incorporate this revolutionary new display technology in Tablets! It will be
interesting to see how rapidly other manufacturers adopt Quantum Dots. See Figure 1 and Figure 2 and the Colors
and Intensities section for details.
Display Sharpness
These Mini Tablets all have almost exactly 326 Pixels Per
Inch PPI (the same as the Retina Display iPhones). For 20/20 Vision the pixels
are not resolved for viewing distances of 10.5 inches or more, which is less
than the typical viewing distance of 12 inches or more. As expected, all were
incredibly and impressively razor sharp, especially noticeable with text and
graphics (and significantly sharper than the previous models).
Display Brightness
All of these Mini Tablets have fairly bright displays,
with the Nexus 7 the brightest Tablet that we have measured so far in this
Shoot-Out series, with an impressive Maximum Brightness of 572 cd/m2
(sometimes called nits). Part of this is due to its high performance and high
efficiency LTPS LCD display discussed above. The Kindle HDX 7 has a very bright
494 cd/m2, and the iPad mini a much lower but still very good 414
cd/m2 (but the Nexus 7 is 38 percent brighter). Note that it is
important to appropriately adjust the display brightness in order to preserve
battery power and running time, and also to reduce eye strain from looking at
too bright a display. See the Brightness
and Contrast section for details.
Accurate Factory Display Calibration
The raw LCD panel hardware first needs to be adjusted and
calibrated at the factory with specialized firmware and software data that are
downloaded into the device in order for the display to produce a usable image –
let alone an accurate and beautiful one. This is actually a science but most
manufacturers seem to treat it as if it were a modern art form, so few Tablets,
Smartphones, and even HDTVs produce accurate high quality images. The iPad mini
actually has an excellent and accurate calibration considering its small Color
Gamut (below) because each unit receives individual display factory
calibration. Each Kindle Fire HDX 7 also receives individual unit display
calibration for the Color Gamut and White Point. For the Nexus 7 we don’t have
any specific calibration information.
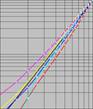
Intensity Scale and Accurate Image Contrast
The
Intensity Scale (sometimes called the Gray Scale) not only controls the
contrast within all displayed images but it also controls how the Red, Green
and Blue primary colors mix to produce all of the on-screen colors. So if the
Intensity Scale doesn't accurately follow the Standard that is used to
produce virtually all consumer content then the colors and intensities will be
wrong everywhere in all images. Unfortunately, many manufacturers are quite
sloppy with the Intensity Scales on their displays.
The
iPad mini has a virtually perfect Intensity Scale as the result of its detailed
individual unit factory calibration. The Intensity Scale for the Kindle Fire 7
is a bit too steep, which increases the Image Contrast somewhat higher than it
should be. That’s not always bad, because high ambient lighting winds up
reducing Image Contrast, so the extra steepness can be beneficial. On the other
hand, the Nexus 7 like all Nexus Tablets that we have tested, has a
non-standard and too shallow Intensity Scale. That is always bad because it
reduces precious Image Contrast, reduces Color Saturation, and introduces
additional Color Errors. See Figure 3 and the Colors
and Intensities section for details.
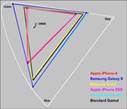
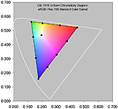
Color Gamut
The Color Gamut is the range of colors that a display can
produce. In order to show accurate on-screen colors the display must match the
Standard sRGB/Rec.709 Color Gamut that is used to produce virtually all
consumer content. Note that consumer content does not include colors outside of
the Standard Gamut, so a display with a wider Color Gamut cannot show colors
that aren't in the original and will only produce inaccurate exaggerated
on-screen colors – so in this instance, bigger than 100 percent is not better.
The measured Color Gamuts for these Mini Tablets are shown in Figure 1.
The Kindle Fire HDX 7 and Nexus 7 both have Color Gamuts
close to the sRGB/Rec.709 Standard, in the range of 97 to 103 percent, which is
very good. However, the iPad mini Retina Display has a much smaller 63 percent
Color Gamut, which is incredibly disappointing because it produces noticeably
subdued image colors. In fact, it’s almost identical to the Gamuts on the much
older iPad 2 and the original iPad mini. That is inexcusable for a current
generation premium Tablet. It’s way below the Kindle Fire HDX 7 and 8.9, the
iPad 3, iPad 4, iPad Air, and just about all current generation premium Tablets
and Smartphones – see our
Mobile Shoot-Out series. Compare the Color Gamuts in Figure 1 and in the Colors
and Intensities section.
Absolute Color Accuracy
Getting
very accurate screen image colors is very important and also very difficult
because the display and calibration all need to be done extremely well at the
factory. We have performed a set of detailed Lab spectroradiometer measurements
of the Tablet displays to see how accurately they reproduce a set of 21
Reference Colors within the Standard sRGB/Rec.709 Color Gamut. The Reference
Colors and the colors actually reproduced by the Mini Tablets are shown in Figure 2. The iPad mini is
shown separately because its small Color Gamut results in very large errors
within the plot.
The
Color Accuracy Errors are examined in terms of JNCD (Just Noticeable Color
Difference). The Kindle Fire has the best overall accuracy with an Average
Color Error of 3.0 JNCD, which is Very Good. The Nexus 7 came in a close second
at 3.1 JNCD, and the iPad mini came in a distant third with 6.6 JNCD. The Peak
Color Accuracy Errors are much higher, particularly for the iPad mini, with
23.4 JNCD. The iPad mini does have some Color Management that improves the
Color Accuracy for low saturation colors, but it can’t fix the higher saturated
colors. See Figure 2
for a discussion of JNCD with plots of the Reference Colors and the actually
reproduced colors, and the Colors
and Intensities section for the numerical results.
Screen Reflectance and Performance in High Ambient Lighting
The
screens on almost all Tablets and Smartphones are mirrors good enough to use
for personal grooming. Even in moderate ambient lighting the sharpness and
colors can noticeably degrade from light reflected by the screen, especially
objects like your face and any bright lighting behind you. Screen Reflectance
has been steadily decreasing. These Mini Tablets have around 6.5 percent
Reflectance, ranging from 24 to 36 percent higher than the Flagship Kindle Fire
HDX 8.9, which has the lowest Reflectance screen that we’ve measured for a
Tablet. The iPad mini is the highest Mini Reflectance at 6.8 percent –
considerably lower than the original iPad mini, which had 9.0 percent
Reflectance, so this is a large improvement. This article
has screen shots that show how screen images degrade from reflections in bright
ambient light. See the Screen
Reflections section for details.
Viewing Angle Performance
While Tablets are
primarily single viewer devices, the variation in display performance with
viewing angle is still very important because single viewers frequently hold
the display at a variety of viewing angles, plus they are large enough for
sharing the screen with others. All of these Tablets have displays with high
performance IPS or FFS LCD technology, so they were expected to show very
little color shift with viewing angle, and our Lab measurements confirmed their
excellent Viewing Angle performance, with no visually noticeable color shifts.
However, all LCDs, do have a strong decrease in brightness (Luminance) with
Viewing Angle, and these Mini displays all showed, as expected, more than a 50
percent decrease in brightness at a modest 30 degree Viewing Angle. See the Viewing
Angles section for details.
Viewing Tests
The big differences in Color Gamut between the Kindle
Fire HDX 7 and Nexus 7, and the much smaller Gamut in the iPad mini Retina
Display were quite obvious and easy to see in the side-by-side Viewing Tests.
The Kindle Fire had the best color accuracy and overall picture quality, with
slightly too much Color Saturation and Image Contrast due too a slightly too
steep Intensity Scale. The Nexus 7 was a close second, primarily as the result
of too shallow an Intensity Scale. The iPad mini Retina Display came in a very
distant 3rd place finish with significantly undersaturated colors –
particularly noticeable are reds that appear too orange, together with greens
and blues that appear weak and washed out. See Figure 1 and Figure 2 and the Colors
and Intensities section for quantitative details.
Display Power Efficiency
We measured the Power Consumption
of all three displays. The Relative Power Efficiency (for the same Luminance
and screen area) is highest for the Nexus 7, which has the highest performance
and most efficient LTPS Low Temperature Poly Silicon LCD. Second is the Kindle
Fire HDX 7, which has a Backlight using Quantum Dots that increases the power
efficiency by 20 percent while at the same time increasing the Color Gamut by
up to 50 percent as discussed above.
The iPad mini Retina
Display has the lowest Power Efficiency of the tested Mini Tablets. It uses 30
percent more display power than the original (Non-Retina) iPad mini. But that
means there has been a significant enhancement in its power efficiency (from
either IGZO or high performance White LEDs as discussed above), because the
jump up to Retina Display from the iPad 2 to iPad 3 resulted in more than a 100
percent display power increase. See the IGZO
discussion above and our iPad 3 Display
Shoot-Out for more information on LTPS, IGZO and a-Si power efficiency. See
the Display
Power Consumption section for details.
Conclusions: Two Very Impressive Tablet
Displays and One Disappointment…
These Mini Tablets include some of the most impressive
and innovative displays and display technologies, which is perhaps not that
surprising given how popular and competitive this mobile category has become.
First, they all have high resolution displays, with more
pixels than your 50 inch HDTV, but on a 7-8 inch screen, which is certainly
impressive. With about 325 Pixels Per Inch, at normal viewing distances a
person with 20/20 Vision can’t resolve the individual pixels, so the displays
all appear to be perfectly sharp.
Even more
impressive is that the Kindle Fire HDX 7 and new Google Nexus 7 displays also
deliver a full 100 percent Color Gamut, with color accuracy and picture quality
that is probably better than most HDTVs, laptops, and monitors. They accomplish this in
two very different ways…
The new Google Nexus 7 has a very impressive display that uses
the highest performance LCDs with Low Temperature Poly Silicon LTPS. The very
high efficiency LTPS technology allows the new Nexus 7 display to provide a
full 100 percent Color Gamut and at the same time produce the brightest Tablet
display that we have measured so far in this Shoot-Out series.
Most
impressive of all is the Kindle fire HDX 7 –
the first Tablet display to use super high technology Quantum Dots, which
produce highly saturated primary colors that are similar to those produced by
OLED displays. They not only significantly increase the Color Gamut to 100
percent but also improve the power efficiency at the same time. Instead of using White LEDs (which have yellow phosphors)
that produce a broad light spectrum that makes it hard to efficiently produce
saturated colors, Quantum Dots directly convert the light from Blue LEDs into
highly saturated primary colors for LCDs. You can see the remarkable difference
in their light spectra in Figure
4. Quantum Dots are going to revolutionize LCDs for the next 5+ years. To
learn more about Quantum Dots read this from Nanosys.
Congratulations to Amazon for leading the way and being the first to
incorporate this revolutionary display technology in Tablets! It will be
interesting to see how rapidly other manufacturers adopt Quantum Dots. This
level of display competition and excellence is great to see! Consumers will
come to appreciate and then demand this new high level of display performance
excellence, which will hopefully spur other manufacturers into improving their
display performance in order to remain competitive.
And
finally… the iPad mini with Retina Display
unfortunately comes in with a distant 3rd place finish behind the innovative
displays on the Kindle Fire HDX 7 and new Nexus 7 because it still has the same
small 63 percent Color Gamut as the original iPad mini and even older iPad 2.
That is inexcusable for a current generation premium Tablet. The big
differences in Color Gamut between the Kindle Fire HDX 7 and Nexus 7 and the
much smaller 63 percent Gamut in the iPad mini Retina Display were quite
obvious and easy to see in the side-by-side Viewing Tests. See Figure
1 to compare the widely disparate Color Gamuts and Figure 2 to see the very
large Color Errors that result. This all appears to be due to incredibly poor
planning. Instead of moving up to the higher performance (and cost) Low
Temperature Poly Silicon LCDs, Apple chose to continue gambling on IGZO, which
has resulted in both production shortages and inferior products.
Two
innovative Tablet manufacturers, Amazon and Google, have significantly
leapfrogged Apple by introducing Tablet displays using LTPS (in the Kindle Fire
HDX 8.9 and the new Nexus 7), and they are significantly outperforming the IGZO
and a-Si displays in the current iPads. Apple was once the leader in mobile displays,
unfortunately it has fallen way behind in both Tablets and Smartphones. This
should be a wakeup call…
What’s Next…
There is still tremendous room for improvement and
innovation in display technology, which I have covered in recent articles on super high density
440+ PPI displays, curved and
flexible displays, OLED mobile
displays and OLED
TV displays.
The most important developments for the upcoming
generations of mobile displays will come from improvements in their image and
picture quality in ambient light, which washes out screen images, resulting in
reduced readability, image contrast, and color saturation and accuracy. The key
will be in dynamically changing the display’s color management and intensity
scales in order to automatically compensate for reflected glare and image wash
out from ambient light. See
this article on display performance in ambient light. The displays and
technologies that succeed in implementing this new strategy will take the lead
in the next generations of mobile displays…
DisplayMate Display Optimization Technology
All
Smartphone and Tablets displays can be significantly improved using DisplayMate’s
advanced scientific analysis and mathematical display modeling and optimization
of the display hardware, factory calibration, and driver parameters. We help
manufacturers with expert display procurement, prototype development, and
production quality control so they don’t make mistakes similar to those that
are exposed in our Display Technology Shoot-Out series. We can also improve the
performance of any specified set of display parameters. This article is a lite
version of our intensive scientific analysis – before the benefits of our DisplayMate Display Optimization
Technology, which can correct or improve all of these issues. If you are a
display or product manufacturer and want to significantly improve display
performance for a competitive advantage then Contact DisplayMate Technologies.
Display Shoot-Out Comparison Table
Below we
compare the displays on the Amazon Kindle Fire HDX 7, the Apple iPad mini
Retina Display,
and the new
Google Nexus 7 (2013) based on objective Lab measurement data and
criteria. For additional background and information see our Flagship Tablet Display
Shoot-Out, our 2012
Mini Tablet Display Shoot-Out, and our SID
Tablet Display Technology Shoot-Out.
|
Categories
|
Amazon
Kindle
Fire HDX 7
|
Apple
iPad
mini Retina
|
Google
new
Nexus 7
|
Comments
|
|
Display Technology
|
7.0 inch
IPS LCD
a-Si
Backplane
Quantum
Dots
|
7.9 inch
IPS / FFS
LCD
IGZO /
a-Si Backplane
|
7.0 inch
IPS LCD
LTPS
Backplane
|
Liquid Crystal Display
In Plane Switching / Fringe Field Switching
Low Temperature Poly Silicon
Indium Gallium Zinc Oxide
amorphous Silicon
|
|
Screen Shape
|
16:10 =
1.60
Aspect
Ratio
|
4:3 = 1.33
Aspect
Ratio
|
16:10 =
1.60
Aspect
Ratio
|
The iPad screen has the same shape as
8.5x11 paper.
The Kindle and Nexus have a shape about
half way between 8.5x11 paper and Widescreen TV.
|
|
Screen Area
|
22.0
Square Inches
|
29.6
Square Inches
|
22.0
Square Inches
|
A better measure of size than the
diagonal length.
|
|
Relative Screen Area
|
100
percent
|
135
percent
|
100
percent
|
Screen Area relative to the Google Nexus
7.
|
|
Display Pixel Resolution
|
1920 x
1200 pixels
|
2048 x
1536 pixels
|
1920 x
1200 pixels
|
Screen Pixel Resolution.
|
|
Total Number of Pixels
|
2.3 Mega
Pixels
|
3.1 Mega
Pixels
|
2.3 Mega
Pixels
|
Total Number of Pixels.
|
|
Pixels Per Inch
|
323 PPI
Excellent
|
326 PPI
Excellent
|
323 PPI
Excellent
|
Sharpness depends on the viewing distance
and PPI.
See this on
the visual acuity for a true Retina Display
|
|
20/20 Vision Distance
where Pixels are Not Resolved
|
10.6
inches
or more
|
10.5
inches
or more
|
10.6
inches
or more
|
For 20/20 Vision the minimum Viewing
Distance
where the screen appears perfectly sharp
to the eye.
At 12 inches from the screen 20/20 Vision
is 287 PPI.
|
|
Appears Perfectly Sharp
at Typical Viewing Distances
|
Yes
|
Yes
|
Yes
|
Typical Viewing Distances are 12 inches
or more.
|
|
Photo Viewer Color Depth
|
Full
24-bit color
No
Dithering Visible
256
Intensity Levels
|
Full
24-bit color
No
Dithering Visible
256
Intensity Levels
|
Full
24-bit color
No
Dithering Visible
256
Intensity Levels
|
Many Android devices still have some
form
of 16-bit color depth
in the Gallery Photo Viewer.
The Nexus 7 and Kindle Fire do not have
this issue.
|
|
Overall Assessments
This section summarizes the results of all of the
extensive Lab measurements and viewing tests performed on the displays.
|
|
|
Kindle Fire HDX 7
|
iPad
mini Retina
|
new
Nexus 7
|
Comments
|
|
Viewing Tests
in Subdued Ambient Lighting
|
Very Good
Images
Photos and
Videos
have
accurate color
and
slightly high contrast
|
Good
Images
Photos and
Videos
have
reduced color
and
accurate contrast
|
Very Good
Images
Photos and
Videos
have
accurate color
slightly
reduced contrast
|
The Viewing Tests examined the accuracy
of
photographic images by comparing the
displays
to a calibrated studio monitor and HDTV.
|
|
Variation with Viewing Angle
|
Small
Color Shifts
with
Viewing Angle
Large
Brightness Shift
with
Viewing Angle
|
Small
Color Shifts
with
Viewing Angle
Large
Brightness Shift
with
Viewing Angle
|
Small
Color Shifts
with
Viewing Angle
Large
Brightness Shift
with
Viewing Angle
|
All three displays have Small Color
Shifts
and a Large Brightness decrease with
Viewing Angle, which is typical for
high performance LCDs.
|
|
Overall Lab Assessment
Lab Tests and Measurements
|
Very Good Display
|
Very Good Display
But
Small Color
Gamut
|
Very Good Display
|
These Mini Tablets all tested very well,
except for the intentional Small Color
Gamut
of the iPad mini.
|
|
Absolute Color Accuracy
|
Very Good Accuracy
|
Good Accuracy
Small Color
Gamut
|
Very Good Accuracy
|
See Figure 2 and Colors
and Intensities for details.
|
|
Image Contrast Accuracy
|
Very Good Accuracy
But Image Contrast is
Slightly Too High
|
Excellent Accuracy
Close To Perfect
|
Good Accuracy
Reduced
Image Contrast
|
See Figure 3 and Brightness
and Contrast for details.
|
|
Overall Display Calibration
Lab Tests and Viewing Tests
|
Very Good
Calibration
|
Very Good Calibration
But
Small Color
Gamut
|
Very Good Calibration
But
Reduced
Image Contrast
|
The Kindle Fire and Nexus 7 are very well
calibrated, which was easy to see in both
the Lab Tests and the Viewing Tests.
|
|
Overall Display Assessment
|
Very Good A –
|
Good B
Small Color
Gamut
|
Very Good A –
Reduced
Image Contrast
|
The displays on the Kindle Fire and Nexus
7
Mini Tablets are both all around Very
Good.
The iPad mini has a Small Color Gamut that
performs well below the other Mini
Tablets.
|
|
Screen Reflections
All of these screens are large mirrors good enough
to use for personal grooming – but it’s actually a very bad feature…
We measured the light reflected from all directions
and also direct mirror (specular) reflections, which are much more
distracting and cause more eye strain. Many Tablets
still have greater than 10 percent reflections that make the
screen much harder to read even in moderate ambient
light levels, requiring ever higher brightness settings that
waste precious battery power. Hopefully
manufacturers will continue to reduce the mirror reflections with
anti-reflection
coatings and matte or haze surface finishes.
|
|
|
Kindle
Fire HDX 7
|
iPad
mini Retina
|
new
Nexus 7
|
Comments
|
|
Average Screen Reflection
Light From All Directions
|
Reflects
6.3 percent
Very Good
|
Reflects
6.8 percent
Very Good
|
Reflects
6.2 percent
Very Good
|
Measured using an Integrating
Hemisphere.
The best value we have measured is 4.4
percent
and the current worst is 14.8 percent.
|
|
Relative Brightness of the
Reflected Ambient Light
|
102
percent
|
110
percent
|
100
percent
|
Relative Brightness of the Reflected
Ambient Light
expressed as a percentage of the lowest
amount.
|
|
Mirror Reflections
Percentage of Light Reflected
|
7.1 percent
Very Good
|
8.4 percent
Good
|
6.9 percent
Very Good
|
These are the most annoying types of
reflections.
Measured using a narrow collimated
pencil beam
of light reflected off the screen.
|
|
Brightness and Contrast
The Contrast Ratio is the specification that gets
the most attention, but it only applies for low ambient light, which is
seldom
the case for mobile displays. Much more important
is the Contrast Rating, which indicates how easy it is to read the screen
under high ambient lighting and depends on both the
Maximum Brightness and the Screen Reflectance.
|
|
|
Kindle
Fire HDX 7
|
iPad
mini Retina
|
new
Nexus 7
|
Comments
|
|
Measured Maximum Brightness
Peak Luminance for White
|
Brightness
494 cd/m2
Excellent
|
Brightness
414 cd/m2
Very Good
|
Brightness
572 cd/m2
Excellent
|
This is the Brightness for a screen that
is entirely
all white with 100% Average Picture
Level.
|
|
Relative Maximum Brightness
|
86 percent
|
72 percent
Much Lower
|
100
percent
|
Relative Maximum Brightness expressed as
a percentage of the Brightest display.
|
|
|
|
Dynamic Black Level
at Maximum Brightness
For Full Screen Black Only
|
0.33 cd/m2
Very Good
for Mobile
|
0.43 cd/m2
Very Good
for Mobile
|
0.43 cd/m2
Very Good
for Mobile
|
Dynamic Brightness can reduce or even turn off
the Backlight during Full Screen Black.
|
|
True Black Level
at Maximum Brightness
For Typical Screen Content
|
0.44 cd/m2
Very Good
for Mobile
|
0.43 cd/m2
Very Good
for Mobile
|
0.43 cd/m2
Very Good
for Mobile
|
This is the True Black Level for most images
rather than the Dynamic Black on a full screen.
|
|
True Contrast Ratio
Relevant for Low Ambient Light
|
1,123
Very Good
for Mobile
|
963
Very Good
for Mobile
|
1,330
Very Good
for Mobile
|
Only relevant for Low Ambient Light
levels,
which is seldom the case for mobile devices.
|
|
|
|
Contrast Rating
for High Ambient Light
|
78
Very Good
|
61
Very Good
|
92
Very Good
|
Depends on the Screen Reflectance and
Brightness.
Defined as Maximum Brightness / Average Reflectance.
See this SID
article for a detailed explanation.
|
|
Relative Contrast Rating
for High Ambient Light
|
85 percent
Somewhat
Lower
|
66
percent
Much Lower
|
100
percent
Best
|
Relative Contrast Rating for High
Ambient Light
expressed as a percentage of the highest
value.
|
|
Screen Viewability
in High Ambient Light
|
Very Good
A –
|
Very Good
A –
|
Very Good
A
|
Indicates how easy it is to view the
screen
under high ambient lighting. Depends on
both the Screen Reflectance and
Brightness.
See High
Ambient Light Screen Shots
|
|
Colors and Intensities
The Color Gamut, Intensity Scale, and White Point
determine the quality and accuracy of all displayed images and all
the image colors. Bigger is definitely Not Better
because the display needs to match all the standards that were used
when the content was produced. For LCDs a wider
Color Gamut reduces the power efficiency and the Intensity Scale
affects both image brightness and color mixture
accuracy. See the above Figures for detailed explanations.
|
|
|
Kindle
Fire HDX 7
|
iPad
mini Retina
|
new
Nexus 7
|
Comments
|
|
White Color Temperature
Degrees Kelvin
See Figure 1
|
6,904 K
Close to
Standard
See Figure 1
|
6,885 K
Close to
Standard
See Figure 1
|
7,106 K
Slightly
Too Blue
See Figure 1
|
D65 with 6,500 K is the standard color
of White
for most Content and needed for accurate
color
reproduction.
See Figure 1
for the plotted White Points.
|
|
Color Gamut
Percent of Standard Gamut
Measured in the dark at 0 lux
See Figure 1
|
97 percent
Fairly
Close to Standard
See Figure 1
|
63 percent
Gamut Too
Small
See Figure 1
|
103
percent
Fairly
Close to Standard
See Figure 1
|
sRGB / Rec.709 is the color standard for
most
content and needed for accurate color
reproduction.
Note that Too Large a Color Gamut can be
visually
worse than Too Small.
|
|
|
|
Absolute Color Accuracy
Average Color Error
for 21 Reference Colors
See Figure 2
|
Average Error
3.0 JNCD
Very Good
See Figure 2
|
Average
Error 6.6 JNCD
Good
See Figure 2
|
Average
Error 3.1 JNCD
Very Good
See Figure 2
|
JNCD is a Just Noticeable Color Difference.
See Figure 2 for the
definition of JNCD.
Average Errors below 3.5 JNCD are Very
Good.
|
|
Absolute Color Accuracy
Largest Color Error
for 21 Reference Colors
See Figure 2
|
Largest
Error 5.4 JNCD
Very Good
See Figure 2
|
Largest
Error 23.4 JNCD
Poor
See Figure 2
|
Largest
Error 6.5 JNCD
Very Good
See Figure 2
|
JNCD is a Just Noticeable Color Difference.
See Figure 2 for the
definition of JNCD.
Largest Errors below 7.0 JNCD are Very
Good.
This is twice the limit for the Average
Error.
|
|
|
|
Dynamic Brightness
Luminance Reduction with
Average Picture Level APL
|
0 percent
Excellent
|
0 percent
Excellent
|
0 percent
Excellent
|
This is the percent Brightness reduction
with APL
Average Picture Level. Ideally should be
0 percent.
|
|
Intensity Scale and
Image Contrast
See Figure 3
|
Smooth but
Too Steep
Contrast
Somewhat High
See Figure 3
|
Very
Smooth
Contrast
is Excellent
See Figure 3
|
Smooth but
Concave
Contrast
is Somewhat Low
See Figure 3
|
The Intensity Scale controls Image
Contrast needed
for accurate image reproduction. See Figure 3.
|
|
Gamma for the Intensity Scale
Larger has more Image Contrast
See Figure 3
|
Average
2.43
Varies
2.17 to 2.61
Somewhat
Variable
Somewhat
Too High
|
Gamma is
2.22
Excellent
Straight
and Constant
Close to
Perfect
|
Average
2.01
Varies
1.86 to 2.15
Concave
and Variable
Gamma Too
Low
|
Gamma is the slope of the Intensity
Scale.
Gamma of 2.20 is the standard and needed
for
accurate image reproduction. See Figure 3.
|
|
Viewing Angles
The variation of
Brightness, Contrast, and Color with Viewing Angle is especially important
for Tablets because of
their large screen and
multiple viewers. The typical manufacturer 176+ degree specification for LCD
Viewing Angle
is nonsense because that
is where the Contrast Ratio falls to a miniscule 10. For most LCDs there are
substantial
degradations at less
than ±30 degrees, which is not an atypical Viewing Angle for Smartphones and
Tablets.
Note that the Viewing
Angle performance is also very important for a single viewer because the
Viewing Angle varies
based on how the display
is held. The angle can be very large if resting on a table or desk.
|
|
|
Kindle
Fire HDX 7
|
iPad
mini Retina
|
new
Nexus 7
|
Comments
|
|
Brightness Decrease
at a 30 degree Viewing Angle
|
58 percent
Decrease
Very Large
Decrease
|
57
percent Decrease
Very Large
Decrease
|
57 percent
Decrease
Very Large
Decrease
|
All LCDs appear much less bright when
tilted.
LCD decrease is generally greater than
50 percent.
|
|
True Contrast Ratio
at a 30 degree Viewing Angle
|
732
Portrait
603
Landscape
Very Good
for Mobile
|
623
Portrait
470
Landscape
Very Good
for Mobile
|
719
Portrait
502
Landscape
Very Good
for Mobile
|
A measure of screen readability when the
screen
is tilted under low ambient lighting.
|
|
White Point Color Shift
at a 30 degree Viewing Angle
|
Small
Color Shift
Δ(u’v’)
= 0.0033
0.8 times
JNCD
|
Small
Color Shift
Δ(u’v’)
= 0.0020
0.5 times
JNCD
|
Small
Color Shift
Δ(u’v’)
= 0.0035
0.9 times
JNCD
|
JNCD is a Just Noticeable Color Difference.
See Figure 3 for the
definition of JNCD.
|
|
Primary Color Shifts
Largest Shift for R,G,B
at a 30 degree Viewing Angle
|
Small
Color Shift
Δ(u’v’)
= 0.0118 for
3.0 times
JNCD
|
Small
Color Shift
Δ(u’v’)
= 0.0051 for
1.3 times
JNCD
|
Small
Color Shift
Δ(u’v’)
= 0.0026 for
0.7 times JNCD
|
JNCD is a Just Noticeable Color Difference.
See Figure 3 for the
definition of JNCD.
|
|
Color Shifts for Color Mixtures
at a 30 degree Viewing Angle
Reference Brown (255, 128, 0)
|
Small
Color Shift
Δ(u’v’)
= 0.0045
1.1 times
JNCD
|
Small
Color Shift
Δ(u’v’)
= 0.0032
0.8 times
JNCD
|
Small
Color Shift
Δ(u’v’)
= 0.0047
1.2 times
JNCD
|
JNCD is a Just Noticeable Color Difference.
Color Shifts for non-IPS LCDs are about 10
JNCD.
Reference Brown is a good indicator of
color shifts
with angle because of unequal drive
levels and
roughly equal luminance contributions
from Red
and Green. See Figure 3 for the
definition of JNCD.
|
|
Display Power
Consumption
The display power was measured using a Linear
Regression between Luminance and AC Power with a fully charged battery.
Since the displays have different screen sizes and
maximum brightness, the values were also scaled to the
same screen brightness (Luminance) and screen area
in order to compare their relative Power Efficiencies.
The Relative Power Efficiency of the displays is
highest for the Nexus 7, which has an LTPS Low Temperature
Poly Silicon LCD Backplane, next is the Kindle Fire
HDX 7, which has Quantum Dots, and lowest is the iPad mini.
|
|
|
Kindle
Fire HDX 7
|
iPad
mini Retina
|
new
Nexus 7
|
Comments
|
|
Maximum Display Power
Full White Screen
at Maximum Brightness
|
2.3 watts
|
3.3 watts
|
1.8 watts
|
This measures the display power for a
screen
that is entirely Peak White.
|
|
Relative Power Efficiency
same Luminance 414 cd/m2
same 7.9 inch screen area
|
2.6 watts
|
3.3 watts
|
1.7 watts
|
This compares the Maximum Power
Efficiency
by scaling to the same screen brightness
and
same screen area as the iPad mini.
|
|
Running Time on Battery
The running time on battery was determined with the
Brightness sliders at the Maximum setting, in Airplane Mode,
with no running applications, and with Automatic
Brightness turned off.
This determines the how the display can affect the
Running Time on Battery.
Note that Automatic Brightness can have a
considerable impact on running time but we found poor performance
in our BrightnessGate analysis of Ambient Light Sensors
and Automatic Brightness. We plan on retesting several
new models in the near future.
|
|
|
Kindle
Fire HDX 7
|
iPad
mini Retina
|
new
Nexus 7
|
Comments
|
|
Running Time on Battery
At Maximum Brightness Setting
|
Not Yet
Available
|
Not Yet
Available
|
Not Yet Available
|
Display always On at the Maximum setting
with
Airplane Mode and no running
applications.
|
About the Author
Dr. Raymond Soneira is
President of DisplayMate Technologies Corporation of Amherst, New Hampshire,
which produces video calibration, evaluation, and diagnostic products for
consumers, technicians, and manufacturers. See www.displaymate.com. He is a research
scientist with a career that spans physics, computer science, and television
system design. Dr. Soneira obtained his Ph.D. in Theoretical Physics from
Princeton University, spent 5 years as a Long-Term Member of the world famous
Institute for Advanced Study in Princeton, another 5 years as a Principal
Investigator in the Computer Systems Research Laboratory at AT&T Bell
Laboratories, and has also designed, tested, and installed color television
broadcast equipment for the CBS Television Network Engineering and Development
Department. He has authored over 35 research articles in scientific journals in
physics and computer science, including Scientific American. If you have any
comments or questions about the article, you can contact him at dtso.info@displaymate.com.
DisplayMate Display Optimization Technology
All
Smartphone and Tablet displays can be significantly improved using
DisplayMate’s advanced scientific analysis and mathematical display modeling
and optimization of the display hardware, factory calibration, and driver
parameters. We help manufacturers with expert display procurement, prototype
development, and production quality control so they don’t make mistakes similar
to those that are exposed in our Display Technology Shoot-Out series. We can
also improve the performance of any specified set of display parameters. This
article is a lite version of our intensive scientific analysis – before the
benefits of our DisplayMate
Display Optimization Technology, which can correct or improve all of these
issues. If you are a display or product manufacturer and want to significantly
improve display performance for a competitive advantage then Contact DisplayMate Technologies.
About DisplayMate Technologies
DisplayMate Technologies specializes in proprietary
sophisticated scientific display calibration and mathematical display
optimization to deliver unsurpassed objective performance, picture quality and
accuracy for all types of displays including video and computer monitors,
projectors, HDTVs, mobile displays such as smartphones and tablets, and all
display technologies including LCD, OLED, 3D, LED, LCoS, Plasma, DLP and CRT. This article is a lite version of
our intensive scientific analysis of Smartphone and Smartphone mobile displays
– before the benefits of our advanced mathematical DisplayMate Display Optimization
Technology, which can correct or improve many of the display deficiencies. We offer DisplayMate display
calibration software for consumers and advanced DisplayMate display diagnostic
and calibration software for technicians and test labs.
For
Manufacturers we offer Consulting Services that include advanced Lab testing,
analysis and evaluations, confidential Shoot-Outs with competing products,
calibration and optimization for displays, improving the User Interface for the
entire display system, plus on-site and factory visits. We help manufacturers
with expert display procurement, prototype development, optimization, and
production quality control so they don’t make mistakes similar to those that
are exposed in our Display Technology Shoot-Out series. See our world renown Display Technology Shoot-Out
public article series for an introduction and preview. DisplayMate’s advanced
scientific optimizations can make lower cost panels look as good or better than
more expensive higher performance displays. If you are a display or product
manufacturer and want to turn your display into a spectacular one to surpass
your competition then Contact
DisplayMate Technologies to learn more.
Article Links: Display Technology Shoot-Out
Article Series Overview and Home Page
Copyright © 1990-2013 by DisplayMate
Technologies Corporation. All Rights Reserved.
This article, or any part
thereof, may not be copied, reproduced, mirrored, distributed or incorporated
into any other work without
the prior written permission of DisplayMate Technologies Corporation