Flagship Tablet Display Technology Shoot-Out
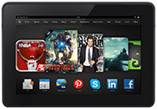
Amazon Kindle Fire HDX 8.9”
– Apple iPad Air – Google Nexus 10
Dr. Raymond M. Soneira
President, DisplayMate Technologies
Corporation
Copyright © 1990-2013 by DisplayMate
Technologies Corporation. All Rights Reserved.
This article, or any part
thereof, may not be copied, reproduced, mirrored, distributed or incorporated
into any other work without
the prior written permission of DisplayMate Technologies Corporation
Introduction
A new generation of full-size Flagship Tablets has just started with the
near simultaneous launch of the Apple iPad Air and Amazon Kindle Fire HDX
8.9. They both have top-of-the-line and
state-of-the-art displays that have been significantly improved (in different
ways) from the 2012 models. The Google Nexus 10 is another innovative Flagship
Tablet that launched at the beginning of November 2012, so it’s now a bit
overdue for an annual makeover, which is rumored to be happening sometime
during November 2013. We’ve included it here even though it’s at the end of its
product cycle because it has been a leader in this class, and will illustrate
the changes in Tablet displays that have taken place in just the last year.
When the new 2013 Nexus 10 launches we will update this Flagship Shoot-Out.
These are all full size Tablets that have 9 to10 inch displays, each
with 3 to 4 Mega Pixels, and around 300 Pixels Per Inch PPI. At normal viewing
distances a person with 20/20 Vision can’t resolve the individual pixels, so
the displays will appear to be perfectly sharp. 2012 was the year of high PPI
Tablets, with Apple bringing its “Retina Display” to the iPad, and Google later
introducing its even higher 4 Mega Pixel Nexus 10.
With sharpness taken care of (for now), there are many other equally
important and even more challenging issues for Tablets displays:
1. Picture quality as
good or better than your HDTV.
2. Excellent true color
accuracy and accurate image contrast for high fidelity images of all viewed
content.
3. Improved screen
performance in high ambient light since Tablets aren’t used in the dark.
We’ll cover these issues and much more, with in-depth comprehensive
display tests, measurements and analysis that you will find nowhere else.
Amazon provided DisplayMate Technologies with a pre-release production
unit of the Kindle Fire HDX 8.9 to test and analyze for this Display Technology
Shoot-Out article.
The Shoot-Out
To examine the display performance of the Amazon Kindle Fire HDX 8.9, the Apple iPad Air, and Google Nexus 10 we ran our in-depth series of Mobile Display Technology
Shoot-Out Lab tests. We take display quality very seriously and provide
in-depth objective analysis side-by-side comparisons based on detailed
laboratory measurements and extensive viewing tests with both test patterns and
test images. To see how far mobile displays have progressed in just three years
see our 2010
Smartphone Display Shoot-Out and 2011 Tablet Display
Shoot-Out, and for a real history lesson see our original 2006 Smartphone
Display Shoot-Out.
Results Highlights
In this Results section we provide Highlights of the
comprehensive Lab measurements and extensive side-by-side visual comparisons
using test photos, test images and test patterns that are presented below. The Comparison Table
section summarizes the Lab measurements in the following categories: Screen
Reflections, Brightness
and Contrast, Colors
and Intensities, Viewing Angles,
Display White
Spectrum, Display
Power Consumption, Running
Time on Battery. You can also skip the Highlights and go directly to the Conclusions.
Overview of the Kindle Fire
HDX 8.9
The Kindle Fire HDX 8.9 is Amazon’s 3rd
generation LCD Tablet, and their displays have been improving by leaps and
bounds since we first tested them back in 2011. The new Kindle Fire HDX 8.9 has
now jumped into the impressive category as the best performing Tablet display
we have ever tested. It has very high brightness, very low Reflectance,
excellent high ambient light performance, and excellent factory calibration
with the best Absolute Color Accuracy and accurate Image Contrast. More on
these topics below. The most important and impressive under the hood
improvement is the use of the highest performance LCDs with Low Temperature
Poly Silicon LTPS, the same technology used in the iPhone 4 and 5, but on the
Kindle with more than 5 times the screen area – the largest LTPS on a mobile
display. The backlight has White LEDs, and its LTPS display has 30 percent
higher power efficiency than the IGZO display in the iPad Air. More on these
issues below.
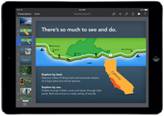
Overview of the iPad Air
The iPad Air has mostly incremental but still significant
improvements over the excellent 3rd and 4th generation
iPad displays. Compared to the 4th generation, the screen
Reflectance decreased by 23 percent, the Peak Brightness increased by 7
percent, and the Contrast Rating for High Ambient Light increased by 32 percent
– all good. Absolute Color Accuracy and Image Contrast fidelity are both very
good (but somewhat below the Kindle Fire) and are discussed in detail below.
The emphasis for the iPad Air is in reduced size, thickness, and weight. The
most important under the hood display improvement is the switch from a-Si amorphous
Silicon LCDs up to a much higher performance IGZO LCD backplane, which was
discussed in our iPad
3 Display Shoot-Out article last year. The switch to IGZO produces an
impressive 57 percent improvement in display power efficiency from previous
Retina Display iPads – so the iPad Air doesn’t get uncomfortably warm like the
earlier iPads. More on these issues below.
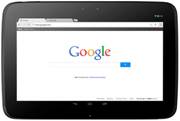
Overview of the Google Nexus
10
Although now close to the end of its product cycle, the
Google Nexus 10 is a very innovative Tablet introduced in November 2012. It was
the first mainstream Tablet to deliver an impressive 2560x1600 display
resolution, the highest at the time. But its Color Gamut is on the small side,
comparable to the older iPad 2, iPad mini, Microsoft Surface RT, and many other
Tablets up to that time. As a result it has never been a good choice when color
accuracy is important. And like the Nexus 7 (2012 and 2013) it has a
non-standard Intensity Scale that reduces precious Image Contrast and
introduces additional color errors in the display. Hopefully, Google has been
reading these Shoot-Outs and the 2013 Nexus 10 will correct them. More on these
issues below. When the new 2013 Nexus 10 launches we will update this article.
Display Sharpness
As
expected, all of these Flagship displays were incredibly and impressively razor
sharp, especially noticeable with text and graphics. The iPad Air actually has
the lowest pixel resolution and PPI of these Flagship Tablets, but that is
perfectly fine for all normal applications and normal viewing because Apple’s
Retina Displays have PPIs high enough so that the pixels are not resolved with
20/20 Vision at normal viewing distances. Note that standard FHD 1920x1080 content
will not appear sharper when upscaled to higher screen resolutions, and will
instead actually degrade slightly due to the digital rescaling.
Display Brightness
All of these Flagship Tablets have fairly bright
displays, with the Kindle Fire HDX 8.9 the brightest full size Tablet that we
have measured so far in this Shoot-Out series, with an impressive Peak
Brightness of 527 cd/m2 (sometimes called nits). Part of this is due
to its high performance and high efficiency LTPS LCD display discussed above.
The iPad Air has a very Good 449 cd/m2 and the Nexus 10 has a somewhat
lower but still very good 398 cd/m2. Note that it is important to
appropriately adjust the display brightness in order to preserve battery power
and running time, and also to reduce eye strain from too bright a display. See
the Brightness
and Contrast section for details.
Accurate Factory Display Calibration
The
raw LCD panel hardware first needs to be adjusted and calibrated at the factory
with specialized firmware and software data that are downloaded into the device
in order for the display to produce a usable image – let alone an accurate and
beautiful one. This is actually a science but most manufacturers seem to treat
it as if it were a modern art form, so few Tablets, Smartphones, and even HDTVs
produce accurate high quality images. On the other hand, the Kindle Fire HDX 8.9 and iPad Air
achieve their excellent picture quality and absolute accuracy through
individual detailed factory calibrations of each and every display for both
color and intensity scale, which we examine next…
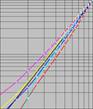
Intensity Scale and Accurate Image Contrast
The
Intensity Scale (sometimes called the Gray Scale) not only controls the
contrast within all displayed images but it also controls how the Red, Green
and Blue primary colors mix to produce all of the on-screen colors. So if the
Intensity Scale doesn't follow the Standard that is used to produce virtually
all consumer content then the colors and intensities will be wrong everywhere
in all images. Unfortunately, many manufacturers are quite sloppy with the
Intensity Scales on their displays. Fortunately, both Amazon and Apple have
done an excellent job with the Intensity Scales on the Kindle Fire HDX 8.9 and
iPad Air. Unfortunately, the Google Nexus 10 has a non-standard Intensity Scale
that reduces precious Image Contrast and introduces additional color errors.
See Figure 3 and the Colors
and Intensities section for details.
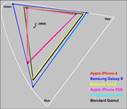
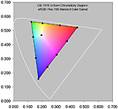
Color Gamut
The Color Gamut is the range of colors that a display can
produce. In order to show accurate on-screen colors the display must match the
Standard sRGB/Rec.709 Color Gamut that is used to produce virtually all
consumer content. Note that consumer content does not include colors outside of
the Standard Gamut, so a display with a wider Color Gamut cannot show colors
that aren't in the original and will only produce inaccurate exaggerated
on-screen colors – so in this instance, bigger is not better. The measured
Color Gamuts for the Flagship Tablets are shown in Figure 1. The Kindle Fire
HDX 8.9 and iPad Air have Color Gamuts close to the sRGB/Rec.709 Standard, in
the range of 105 to 108 percent. However, the 2012 Nexus 10 has a much smaller
58 percent Color Gamut, which is comparable to the older iPad 2, iPad mini, and
Microsoft Surface RT. Compare the Color Gamuts in Figure 1 and in the Colors
and Intensities section.
Absolute Color Accuracy
Getting
very accurate screen image colors is very important and also very difficult
because the display and calibration all need to be done really well at the
factory. We have performed a set of detailed Lab spectroradiometer measurements
of the Tablet displays to see how accurately they reproduce a set of 21
Reference Colors within the sRGB/Rec.709 Color Gamut. The Reference Colors and
the colors actually reproduced by the Kindle Fire HDX 8.9 and iPad Air are
shown in Figure 2. The
Nexus 10 is not shown in the Figure because its small Color Gamut would result
in very large errors within the plot.
The
Color Accuracy Errors are examined in terms of JNCD (Just Noticeable Color
Difference). The Kindle Fire has the best overall accuracy with an Average
Error of 2.7 JNCD, which is Very Good. The iPad Air came in a close second at
3.2 JNCD, and the Nexus 10 came in a distant third with 8.2 JNCD. The Peak
Color Accuracy Errors are much higher, particularly for the Nexus 10, at 29.4
JNCD. See Figure 2 for
a discussion of JNCD with plots of the Reference Colors and the actually
reproduced colors, and the Colors
and Intensities section for the numerical results.
Screen Reflectance and Performance in High Ambient Lighting
The
screens on almost all Tablets and Smartphones are mirrors good enough to use
for personal grooming. Even in moderate ambient lighting the sharpness and
colors can noticeably degrade from light reflected by the screen, especially
objects like your face and any bright lighting behind you. Screen Reflectance
has been steadily decreasing. The Kindle Fire HDX 8.9 has a Reflectance of 5.0
percent, the lowest we have yet measured for a full size Tablet. Like all
previous iPads, the iPad Air still has an Air Gap between the display and the
cover glass, which increases the Reflectance as a result of the additional
optical interfaces due to the Air Gap. The iPad Air has a Reflectance of 6.5
percent, which is a significant improvement over previous iPads, but is still
30 percent higher than the Kindle Fire. The Nexus 10 has the highest
Reflectance of 7.7 percent, which is 54 percent higher than the Kindle Fire.
This article
has screen shots that show how screen images degrade from reflections in bright
ambient light. See the Screen
Reflections section for details.
Viewing Angle Performance
While Tablets are primarily
single viewer devices, the variation in display performance with viewing angle
is still very important because single viewers frequently hold the display at a
variety of viewing angles, plus they are large enough for sharing the screen
with others. All of these Tablets have displays with high performance IPS, PLS
or FFS LCD technology, so they were expected to show very little color shift
with viewing angle, and our lab measurements confirmed their excellent Viewing
Angle performance, with no visually noticeable color shifts. However, all LCDs,
do have a strong decrease in brightness (Luminance) with Viewing Angle, and the
Flagship displays all showed, as expected, more than a 50 percent decrease in
brightness at a modest 30 degree viewing angle. See the Viewing
Angles section for details.
Viewing Tests
What makes the Kindle Fire HDX 8.9 and iPad Air really
shine are their very accurate colors, image contrast, and picture quality. They
are most likely better and more accurate than any display you own (unless it’s
a calibrated professional display). In fact, with some minor calibration tweaks
they both would qualify as studio reference monitors. For proof, see the measurements
in the Brightness
and Contrast and Colors
and Intensities sections, plus the plotted data in Figure 1, Figure 2, and Figure 3.
Display Power Efficiency
We measured the Power Consumption
of all three displays. The Relative Power Efficiency (for the same Luminance
and screen area) is highest for the Kindle Fire HDX 8.9, which has the highest
performance and most efficient LTPS Low Temperature Poly Silicon LCD. Second is
the iPad Air, which has a new higher efficiency metal oxide IGZO LCD that is a
57 percent improvement over the previous iPads, which used a-Si amorphous
Silicon, but it still needs 30 percent more display power than the LTPS Kindle
Fire. Coming in last in Relative Power Efficiency is the Nexus 10 with an a-Si
amorphous Silicon backplane that is used in most current LCD displays, which
requires 73 percent more display power than the LTPS Kindle Fire. See this
discussion in our iPad 3 Display
Shoot-Out for more information on LTPS, IGZO and a-Si power efficiency. See
the Display
Power Consumption section for details.
Conclusions: Some Very Impressive Tablet
Displays…
All three
of these Flagship Tablets have the most impressive mobile displays currently
available. First, they are all very high resolution, with up to twice the
number pixels as your 50 inch HDTV, but on a 9 to 10 inch screen, which is
truly impressive. The 2012 Google Nexus 10, which is at the end of its annual
product cycle, has a small Color Gamut that is comparable to the older iPad 2,
iPad mini, and Microsoft Surface RT, so it has never actually been a good
choice when color accuracy is important. Presumably the soon to be introduced
2013 Nexus 10 will take care of that (and we’ll update this article).
The Amazon
Kindle Fire HDX 8.9 and Apple iPad Air are both even more impressive on another
performance level because in addition they deliver top notch picture quality,
absolute color accuracy, and accurate image contrast that is not only much
better than any other Tablet, they are also much better than most HDTVs,
laptops, and monitors. In fact, with some minor calibration tweaks they both
would qualify as studio reference monitors. For proof, see the measurements in
the Brightness
and Contrast and Colors
and Intensities sections, plus the plotted data in Figure 1, Figure 2, and Figure 3.
Most
impressive of all is the Kindle Fire HDX 8.9, which has leapfrogged into the
best performing Tablet display that we have ever tested, significantly
out-performing the iPad Air in Brightness, Screen Reflectance, and high ambient
light contrast, plus a first place finish in the very challenging category of
Absolute Color Accuracy.
None of
these impressive display performance accomplishments happened accidentally… The
Kindle Fire HDX 8.9 and iPad Air both have impressive display hardware and
impressive factory calibration. The Kindle Fire HDX 8.9 has high performance
Low Temperature Poly Silicon LTPS LCDs and the iPad Air high performance IGZO
Metal Oxide LCDs, significantly better than the a-Si amorphous Silicon LCDs
being used in most current displays. Both achieve their excellent picture
quality and absolute accuracy through individual detailed factory calibrations
of each and every display for both color and intensity scale – truly
impressive.
This level
of display competition and excellence is great to see! Consumers will come to
appreciate and then demand this new high level of display performance
excellence, which will hopefully spur other manufacturers into improving their
display performance in order to remain competitive.
What’s Next…
There is still tremendous room for improvement and
innovation in display technology, which I have covered in recent articles on super high density
440+ PPI displays, curved and
flexible displays, OLED mobile
displays and OLED
TV displays.
The most important developments for the upcoming
generations of mobile displays will come from improvements in their image and
picture quality in ambient light, which washes out screen images, resulting in
reduced readability, image contrast, and color saturation and accuracy. The key
will be in dynamically changing the display’s color management and intensity
scales in order to automatically compensate for reflected glare and image wash
out from ambient light. See
this article on display performance in ambient light. The displays and
technologies that succeed in implementing this new strategy will take the lead
in the next generations of mobile displays…
DisplayMate Display Optimization Technology
All
Smartphone and Tablets displays can be significantly improved using
DisplayMate’s advanced scientific analysis and mathematical display modeling
and optimization of the display hardware, factory calibration, and driver
parameters. We help manufacturers with expert display procurement, prototype
development, and production quality control so they don’t make mistakes similar
to those that are exposed in our Display Technology Shoot-Out series. We can
also improve the performance of any specified set of display parameters. This
article is a lite version of our intensive scientific analysis – before the
benefits of our DisplayMate
Display Optimization Technology, which can correct or improve all of these
issues. If you are a display or product manufacturer and want to significantly
improve display performance for a competitive advantage then Contact DisplayMate Technologies.
Display Shoot-Out Comparison Table
Below we
compare the displays on the Amazon Kindle Fire HDX 8.9, the Apple iPad Air, and Google Nexus 10 based
on objective Lab measurement data and criteria. For additional background and
information see our iPad
3rd Generation Display Shoot-Out and SID
Tablet Display Technology Shoot-Out.
|
Categories
|
Amazon
Kindle
Fire HDX 8.9
|
Apple
iPad Air
|
Google
Nexus 10
|
Comments
|
|
Display Technology
|
8.9 inch
IPS LCD
LTPS
Backplane
|
9.7 inch
IPS / FFS
LCD
IGZO
Backplane
|
10.1 inch
PLS LCD
a-Si
Backplane
|
Liquid Crystal Display
In Plane Switching / Fringe Field Switching
Plane to Line Switching
Low Temperature Poly Silicon
Indium Gallium Zinc Oxide
amorphous Silicon
|
|
Screen Shape
|
16:10 = 1.60
Aspect
Ratio
|
4:3 = 1.33
Aspect
Ratio
|
16:10 = 1.60
Aspect
Ratio
|
The iPad screen has the same shape as
8.5x11 paper.
The Kindle and Nexus have a shape about
half way between 8.5x11 paper and Widescreen TV.
|
|
Screen Area
|
35.6
Square Inches
|
45.2
Square Inches
|
45.4
Square Inches
|
A better measure of size than the
diagonal length.
|
|
Relative Screen Area
|
78 percent
|
100
percent
|
100
percent
|
Screen Area relative to the Google Nexus
10.
|
|
Display Pixel Resolution
|
2560 x
1600 pixels
|
2048 x
1536 pixels
|
2560 x
1600 pixels
|
Screen Pixel Resolution.
|
|
Total Number of Pixels
|
4.1 Mega
Pixels
|
3.1 Mega
Pixels
|
4.1 Mega
Pixels
|
Total Number of Pixels.
|
|
Pixels Per Inch
|
339 PPI
Excellent
|
264 PPI
Excellent
|
300 PPI
Excellent
|
Sharpness depends on the viewing distance
and PPI.
See this on
the visual acuity for a true Retina Display
|
|
20/20 Vision Distance
where Pixels are Not Resolved
|
10.1
inches
or more
|
13.0
inches
or more
|
11.5
inches
or more
|
For 20/20 Vision the minimum Viewing
Distance
where the screen appears perfectly sharp
to the eye.
At 14 inches from the screen 20/20 Vision
is 246 PPI.
|
|
Appears Perfectly Sharp
at Typical Viewing Distances
|
Yes
|
Yes
|
Yes
|
Typical Viewing Distances are 14 inches
or more.
|
|
Photo Viewer Color Depth
|
Full
24-bit color
No
Dithering Visible
256
Intensity Levels
|
Full
24-bit color
No
Dithering Visible
256
Intensity Levels
|
Full
24-bit color
No
Dithering Visible
256
Intensity Levels
|
Many Android Smartphones and Tablets
still have some
form of 16-bit color depth
in the Gallery Photo Viewer.
The Nexus 10 and Kindle Fire do not have
this issue.
|
|
Overall Assessments
This section summarizes the results of all of the
extensive Lab measurements and viewing tests performed on the displays.
|
|
|
Kindle Fire HDX 8.9
|
iPad Air
|
Nexus 10
|
Comments
|
|
Viewing Tests
in Subdued Ambient Lighting
|
Very Good
Images
Photos and
Videos
have
accurate color
and
accurate contrast
|
Very Good
Images
Photos and
Videos
have
accurate color
and
accurate contrast
|
Good
Images
Photos and
Videos
have
reduced color
and
reduced contrast
|
The Viewing Tests examined the accuracy
of
photographic images by comparing the
displays
to a calibrated studio monitor and HDTV.
|
|
Variation with Viewing Angle
|
Small
Color Shifts
with
Viewing Angle
Large
Brightness Shift
with
Viewing Angle
|
Small
Color Shifts
with
Viewing Angle
Large
Brightness Shift
with
Viewing Angle
|
Small
Color Shifts
with
Viewing Angle
Large
Brightness Shift
with
Viewing Angle
|
All three displays have a small Color
Shifts
and a Large Brightness decrease with
Viewing Angle, which is typical for
high performance LCDs.
|
|
Overall Lab Assessment
Lab Tests and Measurements
|
Excellent Display
|
Very Good Display
|
Good Display
|
The Kindle Fire and iPad Air both tested
very well in the Lab, with the Kindle
performing slightly better than the iPad.
|
|
Absolute Color Accuracy
|
Very Good
|
Very Good
|
Good
|
See Figure 2 and Colors
and Intensities for details.
|
|
Image Contrast Accuracy
|
Excellent
|
Excellent
|
Good
|
See Figure 3 and Brightness
and Contrast for details.
|
|
Overall Display Calibration
Lab Tests and Viewing Tests
|
Very Good
Calibration
|
Very Good Calibration
|
Good Calibration
|
The Kindle Fire and iPad Air are very
well
calibrated, which was easy to see in
both
the Lab Tests and the Viewing Tests.
|
|
Overall Display Assessment
|
Excellent A
|
Very Good A –
|
Good B
|
The Kindle Fire and iPad Air are both
top notch displays, with the Kindle
performing slightly better than the iPad.
|
|
Screen Reflections
All of these screens are large mirrors good enough
to use for personal grooming – but it’s actually a very bad feature…
We measured the light reflected from all directions
and also direct mirror (specular) reflections, which are much more
distracting and cause more eye strain. Many Tablets
still have greater than 10 percent reflections that make the
screen much harder to read even in moderate ambient
light levels, requiring ever higher brightness settings that
waste precious battery power. Hopefully
manufacturers will continue to reduce the mirror reflections with
anti-reflection
coatings and matte or haze surface finishes.
|
|
|
Kindle
Fire HDX 8.9
|
iPad Air
|
Nexus 10
|
Comments
|
|
Average Screen Reflection
Light From All Directions
|
Reflects
5.0 percent
Excellent
|
Reflects
6.5 percent
Very Good
|
Reflects
7.7 percent
Good
|
Measured using an Integrating
Hemisphere.
The best value we have measured is 4.4
percent
and the current worst is 14.8 percent.
|
|
Relative Brightness of the
Reflected Ambient Light
|
100
percent
|
130
percent
|
154
percent
|
Relative Brightness of the Reflected
Ambient Light
expressed as a percentage of the lowest
amount.
|
|
Mirror Reflections
Percentage of Light Reflected
|
6.8 percent
Very Good
|
8.5 percent
Good
|
10.9 percent
Poor
|
These are the most annoying types of
reflections.
Measured using a narrow collimated
pencil beam
of light reflected off the screen.
|
|
Brightness and Contrast
The Contrast Ratio is the specification that gets
the most attention, but it only applies for low ambient light, which is
seldom
the case for mobile displays. Much more important
is the Contrast Rating, which indicates how easy it is to read the screen
under high ambient lighting and depends on both the
Maximum Brightness and the Screen Reflectance.
|
|
|
Kindle
Fire HDX 8.9
|
iPad Air
|
Nexus 10
|
Comments
|
|
Measured Maximum Brightness
Peak Luminance for White
|
Brightness
527 cd/m2
Excellent
|
Brightness
449 cd/m2
Very Good
|
Brightness
398 cd/m2
Very Good
|
This is the Brightness for a screen that
is entirely
all white with 100% Average Picture
Level.
|
|
Relative Maximum Brightness
|
100
percent
|
85 percent
|
76 percent
|
Relative Maximum Brightness expressed as
a percentage of the Brightest display.
|
|
|
|
Dynamic Black Level
at Maximum Brightness
For Full Screen Black Only
|
0.36 cd/m2
Very Good
for Mobile
|
0.39 cd/m2
Very Good
for Mobile
|
0.49 cd/m2
Very Good
for Mobile
|
Dynamic Brightness can reduce or even turn off
the Backlight during Full Screen Black.
|
|
True Black Level
at Maximum Brightness
For Typical Screen Content
|
0.46 cd/m2
Very Good
for Mobile
|
0.39 cd/m2
Very Good
for Mobile
|
0.49 cd/m2
Very Good
for Mobile
|
This is the True Black Level for most images
rather than the Dynamic Black on full screen.
|
|
True Contrast Ratio
Relevant for Low Ambient Light
|
1,146
Very Good
for Mobile
|
1,151
Very Good
for Mobile
|
812
Very Good
for Mobile
|
Only relevant for Low Ambient Light
levels,
which is seldom the case for mobile devices.
|
|
|
|
Contrast Rating
for High Ambient Light
|
105
Excellent
|
69
Very Good
|
52
Good
|
Depends on the Screen Reflectance and
Brightness.
Defined as Maximum Brightness / Average Reflectance.
See this SID
article for a detailed explanation.
|
|
Relative Contrast Rating
for High Ambient Light
|
100
percent
Best
|
66 percent
Much Lower
|
50 percent
Much Lower
|
Relative Contrast Rating for High
Ambient Light
expressed as a percentage of the highest
value.
|
|
Screen Viewability
in High Ambient Light
|
Excellent
A
|
Very Good
A –
|
Good B
|
Indicates how easy it is to view the
screen
under high ambient lighting. Depends on
both the Screen Reflectance and
Brightness.
See High
Ambient Light Screen Shots
|
|
Colors and Intensities
The Color Gamut, Intensity Scale, and White Point
determine the quality and accuracy of all displayed images and all
the image colors. Bigger is definitely Not Better
because the display needs to match all the standards that were used
when the content was produced. For LCDs a wider
Color Gamut reduces the power efficiency and the Intensity Scale
affects both image brightness and color mixture
accuracy. See the above Figures for detailed explanations.
|
|
|
Kindle
Fire HDX 8.9
|
iPad Air
|
Nexus 10
|
Comments
|
|
White Color Temperature
Degrees Kelvin
See Figure 1
|
7,145 K
Slightly
Too Blue
See Figure 1
|
7,041 K
Slightly
Too Blue
See Figure 1
|
7,472 K
Somewhat
to Blue
See Figure 1
|
D6500 is the standard color of White for
most
Content and needed for accurate color
reproduction.
See Figure 1
for the plotted White Points.
|
|
Color Gamut
Percent of Standard Gamut
Measured in the dark at 0 lux
See Figure 1
|
105
percent
Fairly
Close to Standard
See Figure 1
|
108
percent
Fairly
Close to Standard
See Figure 1
|
58
percent
Gamut Too
Small
See Figure 1
|
sRGB / Rec.709 is the color standard for
most
content and needed for accurate color
reproduction.
Note that Too Large a Color Gamut can be
visually
worse than Too Small.
|
|
Absolute Color Accuracy
Average Color Error
for 21 Reference Colors
See Figure 2
|
Average
Error 2.7 JNCD
Very Good
See Figure 2
|
Average
Error 3.2 JNCD
Very Good
See Figure 2
|
Average
Error 8.2 JNCD
Good
See Figure 2
|
JNCD is a Just Noticeable Color Difference.
See Figure 2 for the
definition of JNCD.
|
|
Absolute Color Accuracy
Largest Color Error
for 21 Reference Colors
See Figure 2
|
Largest
Error 4.6 JNCD
Very Good
See Figure 2
|
Largest
Error 7.9 JNCD
Good
See Figure 2
|
Largest
Error 29.4 JNCD
Poor
See Figure 2
|
JNCD is a Just Noticeable Color Difference.
See Figure 2 for the
definition of JNCD.
|
|
|
|
Dynamic Brightness
Luminance Reduction with
Average Picture Level APL
|
0 percent
Excellent
|
0 percent
Excellent
|
0 percent
Excellent
|
This is the percent Brightness reduction
with APL
Average Picture Level. Ideally should be
0 percent.
|
|
Intensity Scale and
Image Contrast
See Figure 3
|
Very
Smooth
Contrast
is Excellent
See Figure 3
|
Very
Smooth
Contrast
is Excellent
See Figure 3
|
Smooth but
Concave
Contrast
is Good
See Figure 3
|
The Intensity Scale controls image
contrast needed
for accurate image reproduction. See Figure 3.
|
|
Gamma for the Intensity Scale
Larger has more Image Contrast
See Figure 3
|
2.21 is
Excellent
Straight
and Constant
Close to
Perfect
|
2.23 is
Excellent
Straight
and Constant
Close to
Perfect
|
2.07
Average
Varies
1.99 to 2.19
Concave
and Variable
Gamma Too
Low
|
Gamma is the slope of the Intensity
Scale.
Gamma of 2.20 is the standard and needed
for
accurate image reproduction. See Figure 3.
|
|
Viewing Angles
The variation of
Brightness, Contrast, and Color with Viewing Angle is especially important
for Tablets because of
their large screen and
multiple viewers. The typical manufacturer 176+ degree specification for LCD
Viewing Angle
is nonsense because that
is where the Contrast Ratio falls to a miniscule 10. For most LCDs there are
substantial
degradations at less
than ±30 degrees, which is not an atypical Viewing Angle for Smartphones and
Tablets.
Note that the Viewing
Angle performance is also very important for a single viewer because the
Viewing Angle varies
based on how the display
is held. The angle can be very large if resting on a table or desk.
|
|
|
Kindle
Fire HDX 8.9
|
iPad Air
|
Nexus 10
|
Comments
|
|
Brightness Decrease
at a 30 degree Viewing Angle
|
55 percent
Decrease
Very Large
Decrease
|
61
percent Decrease
Very Large
Decrease
|
56 percent
Decrease
Very Large
Decrease
|
All LCDs appear much less bright when
tilted.
LCD decrease is generally greater than
50 percent.
|
|
True Contrast Ratio
at a 30 degree Viewing Angle
|
483
Portrait
772
Landscape
Very Good
for Mobile
|
665
Portrait
478
Landscape
Very Good
for Mobile
|
391
Portrait
540
Landscape
Very Good
for Mobile
|
A measure of screen readability when the
screen
is tilted under low ambient lighting.
|
|
White Point Color Shift
at a 30 degree Viewing Angle
|
Small
Color Shift
Δ(u’v’)
= 0.0020
0.5 times
JNCD
|
Small
Color Shift
Δ(u’v’)
= 0.0049
1.2 times
JNCD
|
Small Color
Shift
Δ(u’v’)
= 0.0095
2.4 times
JNCD
|
JNCD is a Just Noticeable Color Difference.
See Figure 3 for the
definition of JNCD.
|
|
Primary Color Shifts
Largest Shift for R,G,B
at a 30 degree Viewing Angle
|
Small
Color Shift
Δ(u’v’)
= 0.0083 for
2.1 times
JNCD
|
Small
Color Shift
Δ(u’v’)
= 0.0027 for
0.7 times
JNCD
|
Small
Color Shift
Δ(u’v’)
= 0.0059 for
1.5 times
JNCD
|
JNCD is a Just Noticeable Color Difference.
See Figure 3 for the
definition of JNCD.
|
|
Color Shifts for Color Mixtures
at a 30 degree Viewing Angle
Reference Brown (255, 128, 0)
|
Small
Color Shift
Δ(u’v’)
= 0.0111
2.8 times
JNCD
|
Small
Color Shift
Δ(u’v’)
= 0.0038
1.0 times
JNCD
|
Small Color
Shift
Δ(u’v’)
= 0.0056
1.4 times
JNCD
|
JNCD is a Just Noticeable Color Difference.
Color Shifts for non-IPS LCDs are about 10
JNCD.
Reference Brown is a good indicator of
color shifts
with angle because of unequal drive
levels and
roughly equal luminance contributions
from Red
and Green. See Figure 3 for the
definition of JNCD.
|
|
Display Power
Consumption
The display power was measured using a Linear
Regression between Luminance and AC Power with a fully charged battery.
Since the displays have different screen sizes and
maximum brightness, the values were also scaled to the
same screen brightness (Luminance) and screen area
in order to compare their relative Power Efficiencies.
The Relative Power Efficiency of the displays is
highest for the Kindle Fire HDX 8.9, which has an LTPS
Low Temperature Poly Silicon LCD backplane, next is
the iPad Air, which has a metal oxide IGZO LCD backplane,
and lowest is the Nexus 10, which has an a-Si
amorphous Silicon backplane.
|
|
|
Kindle
Fire HDX 8.9
|
iPad Air
|
Nexus 10
|
Comments
|
|
Maximum Display Power
Full White Screen
at Maximum Brightness
|
3.4 watts
|
4.8 watts
|
5.7 watts
|
This measures the display power for a
screen
that is entirely Peak White.
|
|
Relative Power Efficiency
same Luminance 449 cd/m2
same 9.7 inch screen area
|
3.7 watts
|
4.8 watts
|
6.4 watts
|
This compares the Maximum Power
Efficiency
by scaling to the same screen brightness
and
same screen area.
|
|
Running Time on Battery
The running time on battery was determined with the
Brightness sliders at the Maximum setting, in Airplane Mode,
with no running applications, and with Automatic
Brightness turned off.
This determines the how the display can affect the
Running Time on Battery.
Note that Automatic Brightness can have a
considerable impact on running time but we found poor performance
in our BrightnessGate analysis of Ambient Light Sensors
and Automatic Brightness. We plan on retesting several
new models in the near future.
|
|
|
Kindle
Fire HDX 8.9
|
iPad Air
|
Nexus 10
|
Comments
|
|
Running Time on Battery
At Maximum Brightness Setting
|
Not Yet
Available
|
Not Yet
Available
|
Not Yet Available
|
Display always On at the Maximum setting
with
Airplane Mode and no running
applications.
|
About the Author
Dr. Raymond Soneira is
President of DisplayMate Technologies Corporation of Amherst, New Hampshire,
which produces video calibration, evaluation, and diagnostic products for
consumers, technicians, and manufacturers. See www.displaymate.com. He is a research
scientist with a career that spans physics, computer science, and television
system design. Dr. Soneira obtained his Ph.D. in Theoretical Physics from
Princeton University, spent 5 years as a Long-Term Member of the world famous
Institute for Advanced Study in Princeton, another 5 years as a Principal
Investigator in the Computer Systems Research Laboratory at AT&T Bell
Laboratories, and has also designed, tested, and installed color television
broadcast equipment for the CBS Television Network Engineering and Development
Department. He has authored over 35 research articles in scientific journals in
physics and computer science, including Scientific American. If you have any
comments or questions about the article, you can contact him at dtso.info@displaymate.com.
DisplayMate Display Optimization Technology
All
Smartphone and Tablet displays can be significantly improved using
DisplayMate’s advanced scientific analysis and mathematical display modeling
and optimization of the display hardware, factory calibration, and driver
parameters. We help manufacturers with expert display procurement, prototype
development, and production quality control so they don’t make mistakes similar
to those that are exposed in our Display Technology Shoot-Out series. We can
also improve the performance of any specified set of display parameters. This
article is a lite version of our intensive scientific analysis – before the
benefits of our DisplayMate
Display Optimization Technology, which can correct or improve all of these
issues. If you are a display or product manufacturer and want to significantly
improve display performance for a competitive advantage then Contact DisplayMate Technologies.
About DisplayMate Technologies
DisplayMate Technologies specializes in proprietary
sophisticated scientific display calibration and mathematical display
optimization to deliver unsurpassed objective performance, picture quality and
accuracy for all types of displays including video and computer monitors,
projectors, HDTVs, mobile displays such as smartphones and tablets, and all
display technologies including LCD, OLED, 3D, LED, LCoS, Plasma, DLP and CRT. This article is a lite version of
our intensive scientific analysis of Smartphone and Smartphone mobile displays
– before the benefits of our advanced mathematical DisplayMate Display Optimization
Technology, which can correct or improve many of the display deficiencies. We offer DisplayMate display
calibration software for consumers and advanced DisplayMate display diagnostic
and calibration software for technicians and test labs.
For
Manufacturers we offer Consulting Services that include advanced Lab testing,
analysis and evaluations, confidential Shoot-Outs with competing products,
calibration and optimization for displays, improving the User Interface for the
entire display system, plus on-site and factory visits. We help manufacturers
with expert display procurement, prototype development, optimization, and production
quality control so they don’t make mistakes similar to those that are exposed
in our Display Technology Shoot-Out series. See our world renown Display Technology Shoot-Out
public article series for an introduction and preview. DisplayMate’s advanced
scientific optimizations can make lower cost panels look as good or better than
more expensive higher performance displays. If you are a display or product
manufacturer and want to turn your display into a spectacular one to surpass
your competition then Contact
DisplayMate Technologies to learn more.
Article Links: Display Technology Shoot-Out
Article Series Overview and Home Page
Copyright © 1990-2013 by DisplayMate
Technologies Corporation. All Rights Reserved.
This article, or any part
thereof, may not be copied, reproduced, mirrored, distributed or incorporated
into any other work without
the prior written permission of DisplayMate Technologies Corporation