Samsung Galaxy S5 Display Technology Shoot-Out
Dr. Raymond M. Soneira
President, DisplayMate Technologies
Corporation
Copyright © 1990-2014 by DisplayMate
Technologies Corporation. All Rights Reserved.
This article, or any part
thereof, may not be copied, reproduced, mirrored, distributed or incorporated
into any other work without
the prior written permission of DisplayMate Technologies Corporation
Introduction
The Samsung Galaxy S and Galaxy Note series of Smartphones are flagship
products for Samsung to show off its latest and greatest OLED displays and
display technology. Samsung provided DisplayMate Technologies with a
pre-release production unit of the Galaxy S5 so that we could perform our well
known objective and comprehensive display Lab tests, measurements, and
analysis, explaining the in-depth OLED display performance results for
consumers, reviewers, and journalists.
While many people have assumed that the Galaxy S5 has basically the same
display as the Galaxy S4, but just a bit bigger, that isn’t the case… Our
detailed Lab tests show that there have been significant display performance
improvements in almost every single test and measurement category, resulting in a number of new records for Smartphone
display performance. Based on our extensive
Lab tests and measurements, which we present in detail below, the Galaxy S5 is
the Best performing Smartphone display that we have ever tested – and it has
raised the bar for top display performance up by another notch.
With the Galaxy S5 the emphasis has shifted from the traditional yearly
increases in resolution, screen size, and pixels per inch (ppi), which have
dominated the headlines for the last 10 years. These have now played out as far
as visually beneficial, so it’s time for manufacturers, consumers and reviewers
to shift their attention and concentrate on the many other even more important
display performance issues that we will discuss in detail below.
The Galaxy S5 has the same 2K 1920x1080 Full HD resolution as the Galaxy
S4, which at 432 pixels per inch is higher than can be resolved with normal
20/20 Vision at the typical viewing distances for Smartphones, so the display
appears perfectly sharp and there is no visual benefit to going higher. There
are, however, other benefits in moving up to somewhat higher resolutions, so
future generations of Smartphones will likely go up to a 2.5K 2560x1440
resolution, as discussed in our 2014 Innovative
Displays and Display Technology article.
There are many more important and challenging issues for displays than
just pixel resolution. For the Galaxy S5, Samsung has instead concentrated on
improving the Maximum Brightness, Screen Reflectance, performance in High
Ambient Light, Absolute Color Accuracy, Viewing Angles, display power
efficiency, and running time on battery. We’ll cover these issues and much
more, with in-depth comprehensive display tests, measurements and analysis that
you will find nowhere else.
OLED Displays
While most mobile displays are still LCD based, OLEDs
have been capturing a rapidly increasing share of the mobile display market.
The technology is still very new, with the Google
Nexus One Smartphone, launched in January 2010, as the first OLED
display product that received widespread notoriety. In a span of just a few
years this new display technology has been improving at a very impressive rate,
now challenging and even exceeding the performance of the best LCDs. Most of
the OLED displays in current mobile devices are produced by Samsung Display. We
have published yearly articles following their progress with in-depth Lab
tests, measurements, and analysis on the evolution of OLEDs in our Galaxy S
I,II,III OLED Display, Galaxy S4 OLED
Display, and Galaxy Note 3
OLED Display Technology Shoot-Out article series.
The Display Shoot-Out
To examine the performance of the Samsung Galaxy S5 we ran our in-depth series of Mobile Display Technology
Shoot-Out Lab tests and measurements in order to determine how OLED
displays have improved. We take display quality very seriously and provide
in-depth objective analysis based on detailed laboratory tests and measurements
and extensive viewing tests with both test patterns, test images and test
photos. To see how far OLED and LCD mobile displays have progressed in just
four years see our 2010 Smartphone
Display Shoot-Out, and for a real history lesson see our original 2006 Smartphone
Display Shoot-Out.
Results Highlights
In this Results section we provide Highlights of the
comprehensive Lab tests and measurements and extensive visual comparisons using
test photos, test images, and test patterns that are covered in the advanced
sections. The Display
Shoot-Out Comparison Table summarizes the Lab measurements in the following
categories: Screen
Reflections, Brightness
and Contrast, Colors
and Intensities, Viewing
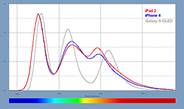
Angles, OLED Spectra,
Display
Power. You can also skip these Highlights and go directly to the Conclusions.
Evolution of OLED Displays
The Galaxy S5 has the latest evolution of Samsung OLED
displays since we tested the Galaxy Note 3,
which launched in October 2013, and the Galaxy S4, which
launched in April 2013. Those results together with the Lab tests and
measurements below show that the Galaxy S5 display is a major improvement over
the Galaxy S4
and a significant improvement over the Galaxy Note 3
in almost every single test and measurement category, which we cover below.
Impressive Brightness
OLED displays had previously been somewhat to
significantly dimmer than competing LCD displays up until the Galaxy S4 and
Galaxy Note 3. The Galaxy S5 continues the OLED brightness improvements in a
big way… It’s an impressive 22 percent brighter than the Galaxy S4 and a solid
13 percent brighter than the Galaxy Note 3. For most image content it provides
over 400 cd/m2 (Luminance, which is a measure of Brightness
sometimes called nits), comparable or higher than most LCD displays in this size
class. As discussed below, the very low screen Reflectance of the Galaxy S5
further improves the effective Screen Brightness in high Ambient Light. Even
more impressive is that when Automatic Brightness is turned On, the Galaxy S5
hits an incredible 698 cd/m2 in high Ambient Light, where high
Screen Brightness is really needed, which is 47 percent brighter than the
Galaxy S4 and 6 percent brighter than the Note 3 with Automatic Brightness
turned On – it’s the brightest mobile display that we have ever tested. An
impressive achievement for OLED technology! See the Brightness
and Contrast section for measurements and details.
Super Dimming Mode
The Galaxy S5 also has a new Super Dimming Mode that
allows the Maximum Screen Brightness to be set all the way down to just 2 cd/m2
using the Brightness Slider. This is useful for working comfortably without eye
strain or bothering others in very dark environments, or affecting the eye’s
dark adaptation, such as when using a telescope. The display still delivers
Full 24-bit color and the picture quality remains excellent.
Multiple Screen Modes and
Color Management
Most Smartphones and Tablets only provide a single fixed
factory set display calibration, with no way for the user to alter it based on
personal preferences, running applications, or ambient light levels. An
important capability provided by the more recent Galaxy S and Galaxy Note
Smartphones is the inclusion of a number of Screen Modes that provide different
levels of user selectable color saturation and display calibration based on
user and application preferences. The Galaxy S5 has 5 user selectable Screen
Modes: Adapt Display, Dynamic, Standard, Professional Photo, and Cinema, which
we discuss below and include detailed measurements for three of the Modes. The
Screen Modes require the implementation of Color Management in order to adjust
the native Color Gamut of the display, plus additional factory calibrations for
each Screen Mode. See the Colors
and Intensities section for measurements and details.
Cinema Mode and High Color Accuracy
The Galaxy S5 Cinema Mode provides the most accurate
Color and White Point calibration for the Standard sRGB/Rec.709 Color Gamut
that is used in virtually all current consumer content for digital cameras,
HDTVs, the internet, and computers, including photos, videos, and movies. The
Absolute Color Accuracy for the Cinema Mode is an Excellent 2.2 JNCD, the most
color accurate display we have ever measured for a Smartphone or Tablet. See
this Figure for an
explanation and visual definition of JNCD and Color Accuracy Plots
showing the measured Color Errors. Use the Cinema Mode for the best color and
image accuracy, which is especially important when viewing photos from family
and friends (because you often know exactly what they actually should look
like), for some TV shows, movies, and sporting events with image content and
colors that you are familiar with, and also for viewing online merchandise, so
you have a good idea of exactly what colors you’re buying and are less likely
to return them. See the Color
Accuracy section and Color
Accuracy Plots for measurements and details.
Professional Photo Mode
Most high-end digital cameras have an option to use the
Adobe RGB Gamut, which is 17 percent larger than the Standard sRGB/Rec.709
Gamut used in consumer cameras. The Professional Photo Mode on the Galaxy S5
provides an accurate calibration to the Adobe RGB standard, which is rarely
available in consumers displays, and is very useful for high-end digital
photography applications. The measured Absolute Color Accuracy of the
Professional Photo Mode for the Galaxy S5 is 3.0 JNCD, which is very accurate.
See this Figure for an
explanation and visual definition of JNCD and Color Accuracy Plots
showing the measured Color Errors. There are very few displays that can
accurately reproduce Adobe RGB, so this is a significant plus for serious
photography enthusiasts. See the Color
Accuracy section and Color
Accuracy Plots for measurements and details.
Adapt Display Mode
The Adapt Display Mode provides real-time adaptive
processing to dynamically adjust images and videos – for some applications it
will vary the White Point, Color Gamut, and Color Saturation based on the image
content and the color of the surrounding ambient lighting measured by the
Galaxy S5 RGB Ambient Light Sensor (which measures color in addition to
brightness). The Adapt Display Mode also delivers higher color saturation,
which appeals to some, and is also a better choice for high ambient light
viewing conditions, which wash out the on-screen colors and contrast from the
reflected light, which we examine next.
Performance in High Ambient Lighting
Mobile displays are often used under relatively bright
ambient light, which washes out image colors and contrast, reducing picture
quality and making it harder to view or read the screen. To be usable in high
ambient light a display needs a dual combination of high screen Brightness and
low screen Reflectance – the Galaxy S5 has both. For Screen Reflectance, the
Galaxy S5 (with 4.5 percent) is effectively tied for first place with the
Galaxy S4 for the lowest Screen Reflectance of any mobile display that we have
ever tested. As discussed above, for most image content the Galaxy S5 provides
over 400 cd/m2, comparable or higher than most LCD displays in this
size class. See the Brightness
and Contrast and Screen
Reflections sections for measurements and details.
Contrast Rating in Ambient
Light: Even more impressive is that when Automatic Brightness is turned
On, the Galaxy S5 hits an incredible 698 cd/m2 in high Ambient
Light, where high Brightness is really needed – it’s the brightest mobile
display that we have ever tested. Our Contrast Rating
for High Ambient Light quantitatively measures screen visibility under
bright Ambient Light – the higher the better. As a result of its high
Brightness and low Reflectance, the Galaxy S5 has a Contrast Rating for High
Ambient Light that ranges from 75 to 155, also the highest that we have ever
measured. See the Brightness
and Contrast and High
Ambient Light sections for measurements and details.
Screen Shots in Ambient Light:
This article
with screen shots shows how many Smartphones and Tablets degrade in High
Ambient Lighting. On the Galaxy S5 the Brightness can be set much higher for
Automatic Brightness so that users can’t permanently park the Manual Brightness
slider to very high values, which would run down the battery quickly. This
extra high level of Brightness is only needed for high Ambient Light.
Color Washout in Ambient Light:
The Adapt Display Mode delivers higher Color Saturation, which appeals to some,
and is also a better choice for high Ambient Light viewing conditions, which
wash out the on-screen colors and contrast from the reflected light off the
screen. For example, in 0 lux absolute darkness the Adapt Display Mode has a
Color Gamut that has 129 percent of the Standard Color Gamut, but at 1,000 lux
Ambient Light, which corresponds to high indoor or low outdoor lighting levels,
the Color Gamut falls to 99 percent, while for the Cinema Mode it falls to 84
percent at 1,000 lux, so the higher Color Gamuts are best in high Ambient
Light. See the Colors
and Intensities section for measurements and details.
2K Full HD 1920x1080 Display
The Galaxy S5 has the same 2K 1920x1080 Full HD
resolution as the Galaxy S4, which at 432 pixels per inch is higher than can be
resolved with normal 20/20 Vision at the typical viewing distances for
Smartphones, so the display appears perfectly sharp and there is no visual
benefit to going higher. For an in-depth discussion see our Visual
Sharpness and Display Resolution section, which explains the many issues
that come into play.
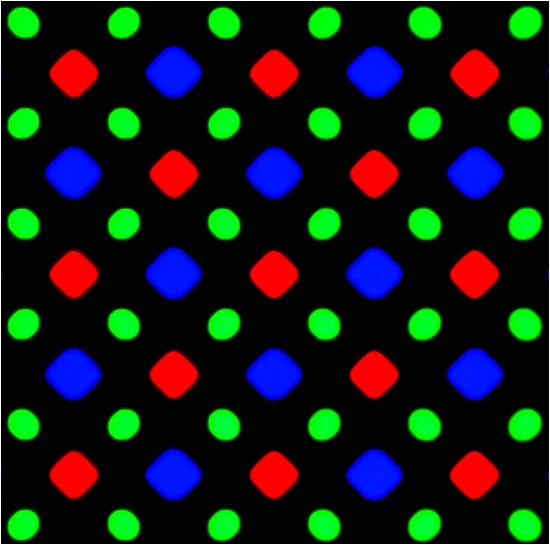
Diamond
Pixels
A high
resolution screen shot of the Galaxy S5 and S4 (provided by Samsung) shows
an interesting design and sub-pixel arrangement, which Samsung calls Diamond Pixels.
First of all, the Red, Green, and Blue sub-pixels have very different sizes –
Blue is by far the largest because it has the lowest efficiency, and Green is
by far the smallest because it has the highest efficiency. The alternating Red
and Blue sub-pixel arrangement leads to a 45 degree diagonal symmetry in the
sub-pixel layout. This allows vertical, horizontal, and particularly diagonal
line segments and vectors to be drawn with reduced aliasing and artifacts. In
order to maximize the sub-pixel packing and achieve the highest possible pixels
per inch (ppi), that leads to diamond rather than square or stripe shaped Red
and Blue sub-pixels. But not for the Green sub-pixels, which are oval shaped
because they are squeezed between two much larger and different sized Red and
Blue sub-pixels. It’s a form of high-tech display art…
Power Efficiency
The Galaxy S5 display delivers 22 percent higher
Brightness than the Galaxy S4 with the same display power. Taking into account
its 4 percent larger screen area, the Galaxy S5 has an impressive 27 percent
improvement in display power efficiency over the Galaxy S4. Turning this
around, for the same screen Brightness the Galaxy S5 uses 18 percent less
display power than the Galaxy S4, which helps improve the running time on
battery. The Galaxy S5 also has an Ultra Power Saving Mode that lowers the
Screen Brightness and also sets the background to Black, both of which
significantly reduce display power and can double the running time on battery.
See the Display
Power section for measurements and details.
While LCDs remain more power efficient for images with
mostly white content (like text screens, for example), OLEDs are more power
efficient for most other content, which are typically darker, because they are
emissive rather than transmissive like LCDs. In fact, the Galaxy S5 is 27
percent more power efficient than the Full HD LCD
Smartphones we recently tested for mixed image content (that includes
photos, videos, and movies, for example) with a typical 50 percent Average
Picture Level, APL.
Screen Uniformity
One subtle but important advantage of OLEDs is their
excellent screen uniformity compared to LCDs, which often show hot spots and
shadows from the edge LED lighting.
Viewing Angle Performance
While Smartphones are
primarily single viewer devices, the variation in display performance with
viewing angle is still very important because single viewers frequently hold
the display at a variety of viewing angles. The angle is often up to 30
degrees, more if it’s resting on a table or desk. While LCDs typically
experience a 55 percent or greater decrease in brightness at a 30 degree
Viewing Angle, the Galaxy S5 shows a much smaller 22 percent decrease in
Brightness at 30 degrees. This also applies to multiple side-by-side viewers as
well, and is a significant advantage of OLED displays. The Color Shifts with
Viewing Angle are also relatively small. See the Viewing
Angles section for measurements and details.
Viewing Tests
The Galaxy S5 Cinema Mode provides very nice, pleasing
and accurate colors, and picture quality. Although the Image Contrast and Color
Saturation are slightly too high (due to a slightly too steep Intensity Scale),
the very challenging set of DisplayMate Test and Calibration Photos that we use
to evaluate picture quality looked Beautiful,
even to my experienced hyper-critical eyes. The Cinema Mode is recommended for
indoor and low ambient light viewing of most standard consumer content for
digital camera, HDTV, internet, and computer content, including photos, videos,
and movies. The Adapt Display Mode has significantly more vibrant and saturated
colors. Some people like that. It is also particularly recommended for medium
and high levels of ambient light viewing because it offsets some of the
reflected glare that washes out the images.
Galaxy S5 Conclusions: An Impressive
Display…
The primary goal of this Display Technology Shoot-Out
article series has always been to point out which manufactures and display
technologies are leading and advancing the state-of-the-art of displays by
performing comprehensive and objective Lab tests and measurements together with
in-depth analysis. We point out who is leading, who is behind, who is
improving, and sometimes (unfortunately) who is back pedaling… all based solely
on the extensive objective measurements that we also publish, so that everyone
can judge the data for themselves as well…
OLED Evolution:
What is especially significant and impressive is that Samsung has been
systematically and significantly improving their OLED display performance with
every single Galaxy generation since 2010, when we started tracking OLEDs,
summarized in our Galaxy S
I,II,III OLED Display, Galaxy S4 OLED
Display, and Galaxy Note 3
OLED Display Technology Shoot-Out article series. The Galaxy S5 continues
the rapid and impressive improvement in OLED displays and technology. The first
notable OLED Smartphone, the Google Nexus One,
came in decidedly last place in our 2010 Smartphone
Display Shoot-Out. In a span of just four years OLED display technology is
now challenging and even exceeding the performance of the best LCDs across the
board in brightness, contrast, color accuracy, color management, picture quality,
performance in high ambient light, screen uniformity, and viewing angles.
Newest Performance
Improvements: The Galaxy S5 has the newest generation of Samsung
OLED displays since the Galaxy Note 3
Smartphone, which launched in October 2013, and the Galaxy S4
Smartphone, which launched in April 2013. While many people have assumed that
the Galaxy S5 has basically the same display as the Galaxy S4, but just a bit
bigger, that isn’t the case… Our detailed Lab tests show that the Galaxy S5
display is a major improvement over the Galaxy S4 and a significant improvement
over the Galaxy Note 3 in almost every single test and measurement category – a good reason to consider upgrading.
Best Smartphone Display:
Based on our extensive Lab tests and measurements, the Galaxy S5 is the Best performing Smartphone display that
we have ever tested. It has a long list of new
records for best Smartphone display performance including: Highest Brightness,
Lowest Reflectance, Highest Color Accuracy, Infinite Contrast Ratio, Highest
Contrast Rating in Ambient Light, and smallest Brightness Variation with
Viewing Angle. The Galaxy S5 has raised the bar
for top display performance up by another notch
– an impressive achievement for OLED technology!
Most Accurate Colors: The
Galaxy S5 Cinema Mode has the most accurate colors for any Smartphone or Tablet
display that we have ever measured. This is especially important when viewing
photos from family and friends (because you often know exactly what they
actually should look like), for some TV shows, movies, and sporting events with
image content and colors that you are familiar with, and also for viewing
online merchandise, so you have a good idea of exactly what colors you’re
buying and are less likely to return them.
Beautiful Picture Quality:
The Galaxy S5 Cinema Mode provides very nice, pleasing and accurate colors, and
picture quality. Although the Image Contrast and Color Saturation are slightly
too high (due to a slightly too steep Intensity Scale), the very challenging
set of DisplayMate Test and Calibration Photos that we use to evaluate Picture Quality looked Beautiful, even to my
experienced hyper-critical eyes. The Cinema Mode is recommended for indoor and
low ambient light viewing of most standard consumer content for digital camera,
HDTV, internet, and computer content, including photos, videos, and movies. The
Adapt Display Mode has significantly more vibrant and saturated colors. Some
people like that. It is also particularly recommended for medium and high
levels of ambient light viewing because it offsets some of the reflected glare
that washes out the images.
Power Efficiency: OLEDs need to continue improving their power
efficiency, which is critically important for mobile displays. We measured an
impressive 27 percent improvement in display power efficiency between the
Galaxy S5 and S4. According to Samsung, this increase is due to more efficient
OLED materials and also to improvements in the display electronics and optics.
While LCDs remain more power efficient for images with mostly white content
(like text screens, for example), OLEDs are now more power efficient for most
other content, which are typically darker, because they are emissive displays
rather than transmissive like LCDs. In fact, the Galaxy S5 is 27 percent more
power efficient than the Full HD LCD
Smartphones we recently tested for mixed image content (that includes
photos, videos, and movies, for example) with a typical 50 percent Average
Picture Level, APL. If this keeps up then OLEDs may pull ahead of LCDs in total
power efficiency in the near future…
Upcoming Smart Watch Display Shoot-Outs: For Smart Watches the
software is evolving rapidly and you will be able to regularly download
software updates and new Apps as they improve – but the display cannot be
updated so choose carefully… For Smart Watches the display is the essential key
for a great product, and a major challenge because it needs to be very small,
very thin, and have major power constraints to maintain a greater than 1 day
battery running time, yet it must deliver bright images in very high ambient
light, produce vibrant high resolution colored text and graphics, and provide
great picture quality and color accuracy for photos and videos. Samsung has
also provided DisplayMate Technologies with the new Galaxy Gear 2 Smart Watches
that have high resolution OLED color displays, which we will be testing and
evaluating next. After that we’ll produce a full Smart Watch Display Technology Shoot-Out, where we will
objectively measure the display performance of the most interesting Smart Watch
displays and display technologies. To stay informed Follow DisplayMate on Twitter.
What’s Next… The most important developments for the upcoming generations of both
OLED and LCD mobile displays will come from improvements in their image and
picture quality in ambient light, which washes out screen images, resulting in
reduced readability, image contrast, and color saturation and accuracy. The key
will be in dynamically changing the display’s color management and intensity
scales in order to automatically compensate for reflected glare and image wash
out from ambient light as discussed in our 2014
Innovative Displays and Display Technology and SID
Display Technology Shoot-Out articles. The
displays and technologies that succeed in implementing this new strategy will
take the lead in the next generations of mobile displays…
DisplayMate Display Optimization Technology
All
Smartphone and Tablets displays can be significantly improved using
DisplayMate’s proprietary very advanced scientific analysis and mathematical
display modeling and optimization of the display hardware, factory calibration,
and driver parameters. We help manufacturers with expert display procurement,
prototype development, testing displays to meet contract specifications, and
production quality control so that manufacturers don’t make mistakes similar to
those that are exposed in our public Display Technology Shoot-Out series for
consumers. This article is a lite version of our advanced scientific analysis –
before the benefits of our DisplayMate
Display Optimization Technology, which can correct or improve all of these
issues. If you are a display or product manufacturer and want to significantly
improve display performance for a competitive advantage then Contact DisplayMate Technologies.
Display Shoot-Out Comparison Table
Below we
examine in-depth the display on the Samsung Galaxy S5 based on objective Lab measurement data and criteria.
For comparisons with the Galaxy S4 and Galaxy Note 3 and additional background
information see the Galaxy S4 Display
Technology Shoot-Out, the Galaxy Note 3
Display Technology Shoot-Out, and the Galaxy
SI,II,III Display Technology Shoot-Out that compares and analyzes the
evolution of the OLED displays on the Galaxy S I, II, and III. For
comparisons with the other leading Smartphone displays including LCDs see our Mobile Display Technology
Shoot-Out series.
|
Categories
|
Samsung Galaxy S5
|
Comments
|
|
Display Technology
|
5.1 inch
OLED with Diamond Pixels
|
Organic Light Emitting Diode
Diamond Pixels
with Diagonal Sub-Pixel Symmetry
|
|
Screen Shape
|
16:9 =
1.78
Aspect
Ratio
|
The Galaxy S5 has the same shape as
widescreen HDTV video content.
|
|
Screen Area
|
11.1
Square Inches
|
A better measure of size than the
diagonal length.
|
|
Display Resolution
|
1920 x
1080 pixels
2K Full
HD 1080p
|
Screen Pixel Resolution.
2K refers to the 1980 Horizontal
Resolution
|
|
Total Number of Pixels
|
2.1 Mega
Pixels
|
Total Number of Pixels.
|
|
Pixels Per Inch
|
432 PPI
with Diamond Pixels
Excellent
|
Sharpness depends on the viewing distance and
PPI.
See this on
the visual acuity for a true Retina Display
|
|
Sub-Pixels Per Inch
|
Red
305 SPPI
Green 432
SPPI
Blue
305 SPPI
|
Diamond Pixel displays have only half the
number of
Red and Blue Sub-Pixels as standard RGB
displays.
|
|
Total Number of Sub-Pixels
|
Red
1,037 KSP
Green
2,074 KSP
Blue
1,037 KSP
|
Number of Kilo Sub-Pixels KSP for Red, Green, Blue.
Diamond Pixel displays have only half the
number of
Red and Blue Sub-Pixels as standard RGB
displays.
|
|
20/20 Vision Distance
where Pixels or Sub-Pixels
are Not Resolved
|
8.0
inches for White and Green
11.3
inches for Red and Blue
|
For 20/20 Vision the minimum Viewing
Distance
where the screen appears perfectly sharp
to the eye.
At 12 inches from the screen 20/20 Vision
is 287 PPI.
|
|
Display Sharpness
at Typical Viewing Distances
|
Display
appears Perfectly Sharp
Pixels are
not Resolved with 20/20 Vision
at Typical
Viewing Distances of 11 to 15 inches
The Sub-Pixel
Rendering used on the Galaxy S5 further improves Display Sharpness
|
The Typical Viewing Distances for the
Galaxy S5
are in the range of 11 to 15 inches.
Note that eye’s resolution is much lower
for Red and Blue color content than
White and Green.
|
|
Photo Viewer Color Depth
|
Full
24-bit Color
No
Dithering Visible
256
Intensity Levels
|
Many Android Smartphones and Tablets
still have some
form of 16-bit color depth
in the Gallery Photo Viewer.
The Samsung Galaxy Notes do not have
this issue.
|
|
Overall Assessments
This section summarizes
the results for all of the extensive Lab Measurements and Viewing Tests
performed on the display
See Screen
Reflections, Brightness
and Contrast, Colors
and Intensities, Viewing
Angles, OLED
Spectra, Display
Power.
The
Galaxy S5 has 5 user selectable Screen Modes that
are calibrated for different applications and user preferences.
Here
we provide results for the Adapt Display mode, which includes some dynamic
settings, the Professional Photo mode,
which
is accurately calibrated for the Adobe RGB Gamut used in high-end digital
photography, and the Cinema mode,
which
is accurately calibrated for standard content for camera, photo, video,
movie, web, and computers.
|
|
|
Adapt
Display
|
Professional
Photo
|
Cinema
|
Comments
|
|
Viewing Tests
in Subdued Ambient Lighting
|
Good
Images
Photos and
Videos
have too
much color
and
accurate contrast
Intentionally
Vivid Mode
|
Very Good
Images
Adobe RGB
Photos
have very
good color
and
accurate contrast
Accurate
Pro Mode
|
Very Good
Images
Photos and
Videos
have very
good color
and
accurate contrast
Accurate
Mode
|
The Viewing Tests examine the accuracy
of
photographic images by comparing the
displays
to a calibrated studio monitor and HDTV.
|
|
Variation with Viewing Angle
Colors and Brightness
See Viewing
Angles
|
Small
Color Shifts
with
Viewing Angle
Small
Brightness Shift
with
Viewing Angle
|
Small
Color Shifts
with
Viewing Angle
Small
Brightness Shift
with
Viewing Angle
|
Small
Color Shifts
with
Viewing Angle
Small
Brightness Shift
with
Viewing Angle
|
The Galaxy S5 has a relatively small
decrease
in Brightness with Viewing Angle and relatively
small Color Shifts with Viewing Angle.
See the Viewing
Angles
section for details.
|
|
Overall Display Assessment
Lab Tests and Measurements
|
Excellent OLED Display
Intentionally
Vivid Mode
|
Excellent OLED Display
Accurate
Pro Mode
|
Excellent OLED Display
Accurate
Mode
|
The Galaxy S5 OLED Display performed
very well in the Lab Tests and
Measurements.
It is the best OLED display we have ever
tested.
|
|
|
|
Absolute Color Accuracy
Measured over Entire Gamut
See Figure 2 and Colors
|
Good Color
Accuracy
Large
Color Errors But
Intentionally
Vivid Mode
|
Very Good
Color Accuracy
Color
Errors are Small
Accurate
Pro Mode
|
Excellent
Color Accuracy
Color
Errors are Small
Accurate
Mode
|
Absolute
Color Accuracy is measured with a
Spectroradiometer
for 21 Reference Colors
uniformly
distributed within the entire Color Gamut.
See
Figure 2 and Colors
and Intensities for details.
|
|
Image Contrast Accuracy
See Figure 3 and Contrast
|
Very Good
Accuracy
Image
Contrast
Slightly
Too High
|
Very Good
Accuracy
Image Contrast
Slightly
Too High
|
Very Good
Accuracy
Image
Contrast
Slightly
Too High
|
The
Image Contrast Accuracy is determined by
measuring
the Intensity Scale and Gamma.
See
Figure 3 and Brightness
and Contrast for details.
|
|
Performance in Ambient Light
Contrast Rating
See Brightness
and Contrast
Display Brightness
Screen Reflectance
See Screen
Reflections
|
Best
Contrast Rating
for High
Ambient Light
we have
ever measured
Very High
Brightness
Very Low
Reflectance
|
Best
Contrast Rating
for High
Ambient Light
we have
ever measured
Very High
Brightness
Very Low
Reflectance
|
Best
Contrast Rating
for High
Ambient Light
we have
ever measured
Very High
Brightness
Very Low
Reflectance
|
With
Auto Brightness On the Galaxy S5 has the
Highest
Contrast Rating for High Ambient Light
that
we have ever measured.
See
the Brightness
and Contrast section for details.
See
the Screen
Reflections section for details.
|
|
Overall Display Calibration
Image and Picture Quality
Lab Tests and Viewing Tests
|
Good
Calibration
Intentionally
Vivid Mode
|
Very Good Calibration
Accurate
Pro Mode
|
Excellent Calibration
Accurate
Mode
|
The Galaxy S5 has multiple Screen Modes
that deliver accurately calibrated images
and
also Vivid Modes preferred by some users
and
that also perform better in high Ambient
Light.
|
|
|
Overall Display Grade
|
Overall Galaxy S5 Display Grade
is Excellent A
It has raised the bar for top
display performance up another notch
|
The Galaxy S5 delivers excellent image
quality, has both Accurate and Vivid
modes,
has high Brightness and low Reflectance,
and is an all around top performing
display.
|
|
Intentionally
Vivid Mode
Best for
Viewing in
High
Ambient Light
|
Accurate
Mode for
Viewing
High-End
Adobe RGB
Photos
|
Accurate
Mode for
Viewing
Most Content
Photo Video
Movie PC Web
|
|
|
Adapt
Display
|
Professional
Photo
|
Cinema
|
Comments
|
|
Screen Reflections
All display screens are mirrors good enough to use
for personal grooming – but that is actually a very bad feature…
We measured the light reflected from all directions
and also direct mirror (specular) reflections, which are much more
distracting and cause more eye strain. Many
Smartphones still have greater than 10 percent reflections that make the
screen much harder to read even in moderate ambient
light levels, requiring ever higher brightness settings that waste
precious battery power. Hopefully manufacturers
will reduce the mirror reflections with anti-reflection coatings and
matte or haze surface finishes.
Our Lab Measurements include Average Reflectance
for Ambient Light from All Directions and for Mirror Reflections.
Note that the Screen Reflectance is exactly the
same for all of the Galaxy S5 Screen Modes.
The Galaxy S5 is effectively tied for
first place with the Galaxy S4 for the lowest Screen Reflectance (4.4
percent)
for any mobile display that we have ever
tested.
|
|
|
Adapt
Display
|
Professional
Photo
|
Cinema
|
Comments
|
|
Average Screen Reflection
Light From All Directions
|
4.5
percent for Ambient Light Reflections
Excellent
|
Measured using an Integrating Hemisphere
and
a Spectroradiometer. The best value we
have
ever measured for a Smartphone is 4.4
percent.
|
|
Mirror Reflections
Percentage of Light Reflected
|
6.3 percent for
Mirror Reflections
Very Good
|
These are the most annoying types of
Reflections.
Measured using a Spectroradiometer and a
narrow
collimated pencil beam of light
reflected off the screen.
|
|
Brightness and Contrast
The Contrast Ratio
is the specification that gets the most attention, but it only applies for
low ambient light, which is seldom
the case for mobile displays. Much more important
is the Contrast Rating, which indicates how
easy it is to read the screen
under high ambient lighting and depends on both
the Maximum Brightness and the Screen Reflectance. The larger the better.
The Galaxy S5 has the Highest Brightness
and Best Contrast Rating for High Ambient Light that we have ever measured.
|
|
|
Adapt
Display
|
Professional
Photo
|
Cinema
|
Comments
|
|
Measured Average Brightness
50% Average Picture Level
|
Brightness
386 cd/m2
Very Good
|
Brightness
369 cd/m2
Very Good
|
Brightness
369 cd/m2
Very Good
|
This is the Brightness for typical
screen content
that has a 50% Average Picture Level.
|
|
Measured Brightness
100% Full Screen White
|
Brightness
351 cd/m2
Very Good
|
Brightness
337 cd/m2
Very Good
|
Brightness
337 cd/m2
Very Good
|
This is the Brightness for a screen that
is entirely
all white with 100% Average Picture
Level.
|
|
Measured Peak Brightness
1% Full Screen White
|
Brightness
456 cd/m2
Very Good
|
Brightness
429 cd/m2
Very Good
|
Brightness
429 cd/m2
Very Good
|
This is the Peak Brightness for a screen
that
has only a tiny 1% Average Picture
Level.
|
|
Measured Peak Brightness
with Automatic Brightness On
|
Brightness
698 cd/m2
Excellent
|
Brightness
697 cd/m2
Excellent
|
Brightness
696 cd/m2
Excellent
|
Some displays including the Galaxy S5
have
higher Brightness in Automatic
Brightness Mode.
|
|
Low Ambient Light
|
|
Lowest Peak Brightness
Super Dimming Mode
Brightness Slider to Minimum
|
2 cd/m2
For Very
Low Light
|
2 cd/m2
For Very
Low Light
|
2 cd/m2
For Very
Low Light
|
This is the Lowest Brightness with the
Slider set to
Minimum. This is useful for working in
very dark
environments. Picture Quality remained
Excellent.
|
|
Black Brightness at 0 lux
at Maximum Brightness Setting
|
0 cd/m2
Outstanding
|
0 cd/m2
Outstanding
|
0 cd/m2
Outstanding
|
Black brightness is important for low
ambient light,
which is seldom the case for mobile
devices.
|
|
Contrast Ratio at 0 lux
Relevant for Low Ambient Light
|
Infinite
Outstanding
|
Infinite
Outstanding
|
Infinite
Outstanding
|
Only relevant for Low Ambient Light,
which is seldom the case for mobile
devices.
|
|
High Ambient Light
|
|
Contrast Rating
for High Ambient Light
The Higher the Better
for Screen Readability
in High Ambient Light
|
78 – 101
Very Good
97 – 155
With Auto
Brightness
Excellent
|
75 – 95
Very Good
97 – 155
With Auto
Brightness
Excellent
|
75 – 95
Very Good
97 – 155
With Auto
Brightness
Excellent
|
Depends on the Screen Reflectance and
Brightness.
Defined as Maximum Brightness / Average Reflectance.
Some displays including the Galaxy S5 have
higher Brightness in Automatic Brightness Mode.
|
|
Screen Readability
in High Ambient Light
|
Very Good A
Excellent A+
With Auto Brightness
|
Very Good A
Excellent A+
With Auto Brightness
|
Very Good A
Excellent A+
With Auto Brightness
|
Indicates how easy it is to read the
screen
under high ambient lighting. Depends on
both the Screen Reflectance and
Brightness.
See High
Ambient Light Screen Shots
|
|
Colors and Intensities
The Color Gamut, Intensity Scale, and White Point
determine the quality and accuracy of all displayed images and all
the image colors. Bigger is definitely Not Better
because the display needs to match all the standards that were used
when the content was produced. For LCDs a wider
Color Gamut reduces the power efficiency and the Intensity Scale
affects both image brightness and color mixture
accuracy.
The three Galaxy S5 Screen Modes that we
tested are calibrated for different applications and user preferences.
|
|
|
Adapt
Display
|
Professional
Photo
|
Cinema
|
Comments
|
|
Color of White
Color Temperature in degrees
Measured in the dark at 0 lux
See Figure 1
|
7,878 K
Somewhat
Too Blue
But
Intentionally Bluish
For Some
Applications
the White
Point Will Vary
with the
Ambient Lighting
|
6,755 K
Close to
Standard White
Accurate
Pro Mode
See Figure 1
|
6,760 K
Close to
Standard White
Accurate
Mode
See Figure 1
|
D65 with 6,500 K is the standard color
of White
for most Consumer Content and needed for
accurate color reproduction of all
images.
See Figure 1
for the plotted White Points.
|
|
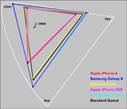
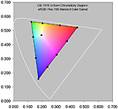
Color Gamut
Measured in the dark at 0 lux
See Figure 1
|
129
percent
sRGB /
Rec.709
Somewhat
Large But
Intentionally
Vivid Mode
See Figure 1
|
107
percent
Adobe RGB
Close to
Standard Gamut
Accurate
Pro Mode
See Figure 1
|
106
percent
sRGB /
Rec.709
Close to
Standard Gamut
Accurate
Mode
See Figure 1
|
sRGB / Rec.709 is the color standard for
most
content and needed for accurate color
reproduction.
Most Professional Camera Modes use Adobe
RGB.
Note that Too Large a Color Gamut can be
visually
worse than Too Small.
|
|
Color Gamut
Measured in Ambient Light
|
112 percent at 500
lux
99 percent at 1,000
lux
|
94 percent at 500
lux
83 percent at 1,000 lux
|
94 percent at 500
lux
83 percent at 1,000 lux
|
Ambient Light washes out the Colors and
reduces
the size of actual Color Gamut that is
seen on screen.
See Color
and Contrast in Ambient Light.
|
|
Color Accuracy
|
|
Absolute Color Accuracy
Average Color Error at 0 lux
For 21 Reference Colors
Just Noticeable Color Difference
See Figure 2
|
Average
Color Error
Δ(u’v’)
= 0.0288
7.2 JNCD
Poor
Accuracy But
Intentionally
Vivid Mode
with a Bluish White Point
See Figure 2
|
Average
Color Error
Δ(u’v’)
= 0.0118
3.0 JNCD
Very Good
Accuracy
Accurate
Pro Mode
See Figure 2
|
Average
Color Error
Δ(u’v’)
= 0.0088
2.2 JNCD
Excellent
Accuracy
Accurate
Mode
See Figure 2
|
JNCD is a Just Noticeable Color Difference.
See Figure 2 for the
definition of JNCD and for
Accuracy Plots showing
the measured Color Errors.
Average Errors below 3.5 JNCD are Very
Good.
Average Errors above 7.0 JNCD are Poor.
|
|
Absolute Color Accuracy
Largest Color Error at 0 lux
For 21 Reference Colors
Just Noticeable Color Difference
See Figure 2
|
Largest
Color Error
Δ(u’v’)
= 0.0532
13.3 JNCD
for Blue
Good
Accuracy But
Intentionally
Vivid Mode
with a
Bluish White Point
See Figure 2
|
Largest
Color Error
Δ(u’v’)
= 0.0267
6.7 JNCD
for Magenta-Red
Very Good
Accuracy
Accurate
Pro Mode
See Figure 2
|
Largest
Color Error
Δ(u’v’)
= 0.0254
6.4 JNCD
for Magenta
Very Good
Accuracy
Accurate
Mode
See Figure 2
|
JNCD is a Just Noticeable Color Difference.
See Figure 2 for the
definition of JNCD and for
Accuracy Plots showing
the measured Color Errors.
Largest Errors below 7.0 JNCD are
Very Good.
Largest Errors above 14.0 JNCD are
Poor.
This is twice the limit for the Average
Error.
|
|
Intensity Scale
|
|
Dynamic Brightness
Luminance Decrease with
Average Picture Level APL
|
23 percent
Decrease
Good
|
21 percent
Decrease
Good
|
21 percent
Decrease
Good
|
This is the percent Brightness decrease
with APL
Average Picture Level. Ideally should be
0 percent.
|
|
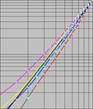
Intensity Scale and
Image Contrast
See Figure 3
|
Smooth and
Straight
Slightly
Too Steep
See Figure 3
|
Smooth and
Straight
Slightly
Too Steep
See Figure 3
|
Smooth ad
Straight
Slightly
Too Steep
See Figure 3
|
The Intensity Scale controls image
contrast needed
for accurate Image Contrast and Color
reproduction.
See Figure 3
|
|
Gamma for the Intensity Scale
Larger has more Image Contrast
See Figure 3
|
2.42
Gamma
Slightly Too High
|
2.41
Gamma
Slightly Too High
|
2.41
Gamma
Slightly Too High
|
Gamma is the log slope of the Intensity
Scale.
Gamma of 2.20 is the standard and needed
for
accurate Image Contrast and Color
reproduction.
See Figure 3
|
|
Image Contrast Accuracy
|
Very Good
|
Very Good
|
Very Good
|
See Figure 3
|
|
Viewing Angles
The variation of
Brightness, Contrast, and Color with Viewing Angle is especially important
for Smartphones because
of their larger screen
and multiple viewers. The typical manufacturer 176+ degree specification for
LCD Viewing Angle
is nonsense because that
is where the Contrast Ratio falls to a miniscule 10. For most LCDs there are
substantial
degradations at less
than ±30 degrees, which is not an atypical Viewing Angle for Smartphones and
Tablets.
Note that the Viewing
Angle performance is also very important for a single viewer because the
Viewing Angle can vary
significantly based on
how the Smartphone is held. The Viewing Angle can be very large if resting on
a table or desk.
The
Viewing Angle variations are essentially identical for all of the Screen Modes.
The
Galaxy S5 has uniformly Very Good Viewing Angle performance.
|
|
|
Adapt
Display
|
Professional
Photo
|
Cinema
|
Comments
|
|
Brightness Decrease
at a 30 degree Viewing Angle
|
22 percent
Decrease
Small
Brightness Decrease
|
Most screens become less bright when tilted.
OLED decrease is due to optical
absorption..
LCD decrease is generally greater than 50
percent.
|
|
Contrast Ratio at 0 lux
at a 30 degree Viewing Angle
|
Infinite
Contrast Ratio
Outstanding
|
A measure of screen readability when the
screen
is tilted under low ambient lighting.
|
|
White Point Color Shift
at a 30 degree Viewing Angle
|
Small Color
Shift
Δ(u’v’)
= 0.0065
1.6 JNCD
|
JNCD is a Just Noticeable Color Difference.
See Figure 2 for the
definition of JNCD.
|
|
Primary Color Shifts
Largest Color Shift for R,G,B
at a 30 degree Viewing Angle
|
Medium
Color Shift
Largest
Shift Δ(u’v’) = 0.0283 for Pure Red
7.1 JNCD
|
JNCD is a Just Noticeable Color Difference.
See Figure 2 for the
definition of JNCD.
|
|
Color Shifts for Color Mixtures
at a 30 degree Viewing Angle
Reference Brown (255, 128, 0)
|
Small Color
Shift
Δ(u’v’)
= 0.0115
2.9 JNCD
|
JNCD is a Just Noticeable Color Difference.
Color Shifts for non-IPS LCDs are about 10
JNCD.
Reference Brown is a good indicator of
color shifts
with angle because of unequal drive
levels and
roughly equal luminance contributions
from Red
and Green. See Figure 2 for the
definition of JNCD.
|
|
Display Power Consumption
The display power was measured using a Linear
Regression between Luminance and AC Power with a fully charged battery.
Since the displays have different screen sizes and
maximum brightness, the values were also scaled to the
same screen brightness (Luminance) and screen area
in order to compare their relative Power Efficiencies.
Below we compare the Display Power used
by the Galaxy S4 and the Galaxy S5.
The Galaxy S5 delivers 22 percent higher
Brightness on a larger screen with the same display power.
The display on the Galaxy S5 is 27
percent more Power Efficient than the display on the Galaxy S4.
This increase is due to more efficient
OLED materials and also to improvements in the display electronics and
optics.
|
|
|
Galaxy
S4
|
Galaxy S5
|
Comments
|
|
Average Display Power
Maximum Brightness at
50% Average Picture Level
|
0.82 watts
with Luminance 313 cd/m2
|
0.82 watts
with
Luminance 386 cd/m2
|
This measures the average display power
for
a wide range of image content.
|
|
Maximum Display Power
Full White Screen
at Maximum Brightness
|
1.50 watts
with Luminance 287 cd/m2
|
1.50 watts
with
Luminance 351 cd/m2
|
This measures the display power for a
screen
that is entirely Peak White.
|
|
Relative Power Efficiency
same Luminance 351 cd/m2
same 5.1 inch screen area
|
1.91 watts
|
1.50 watts
|
This compares the Maximum Power Efficiency
by scaling to the same screen brightness
and
same screen area.
|
|
|
|
|
|
|
|
About the Author
Dr. Raymond Soneira is
President of DisplayMate Technologies Corporation of Amherst, New Hampshire,
which produces video calibration, evaluation, and diagnostic products for
consumers, technicians, and manufacturers. See www.displaymate.com. He is a research
scientist with a career that spans physics, computer science, and television
system design. Dr. Soneira obtained his Ph.D. in Theoretical Physics from
Princeton University, spent 5 years as a Long-Term Member of the world famous
Institute for Advanced Study in Princeton, another 5 years as a Principal
Investigator in the Computer Systems Research Laboratory at AT&T Bell
Laboratories, and has also designed, tested, and installed color television
broadcast equipment for the CBS Television Network Engineering and Development
Department. He has authored over 35 research articles in scientific journals in
physics and computer science, including Scientific American. If you have any
comments or questions about the article, you can contact him at dtso.info@displaymate.com.
DisplayMate Display Optimization Technology
All
Smartphone and Tablets displays can be significantly improved using
DisplayMate’s proprietary very advanced scientific analysis and mathematical
display modeling and optimization of the display hardware, factory calibration,
and driver parameters. We help manufacturers with expert display procurement,
prototype development, testing displays to meet contract specifications, and
production quality control so that manufacturers don’t make mistakes similar to
those that are exposed in our public Display Technology Shoot-Out series for
consumers. This article is a lite version of our advanced scientific analysis –
before the benefits of our DisplayMate
Display Optimization Technology, which can correct or improve all of these
issues. If you are a display or product manufacturer and want to significantly
improve display performance for a competitive advantage then Contact DisplayMate Technologies.
About DisplayMate Technologies
DisplayMate Technologies specializes in proprietary advanced
scientific display calibration and mathematical display optimization to deliver
unsurpassed objective performance, picture quality and accuracy for all types
of displays including video and computer monitors, projectors, HDTVs, mobile
displays such as smartphones and tablets, and all display technologies
including LCD, OLED, 3D, LED, LCoS, Plasma, DLP and CRT. This article is a lite version of
our intensive scientific analysis of Smartphone and Smartphone mobile displays
– before the benefits of our advanced mathematical DisplayMate Display Optimization
Technology, which can correct or improve many of the display deficiencies. We offer DisplayMate display
calibration software for consumers and advanced DisplayMate display diagnostic
and calibration software for technicians and test labs.
For
manufacturers we offer Consulting Services that include advanced Lab testing
and evaluations, confidential Shoot-Outs with competing products, calibration
and optimization for displays, cameras and their User Interface, plus on-site
and factory visits. We help manufacturers with expert display procurement,
prototype development, and production quality control so they don’t make
mistakes similar to those that are exposed in our Display Technology Shoot-Out
series. See our world renown Display
Technology Shoot-Out public article series for an introduction and preview.
DisplayMate’s
advanced scientific optimizations can make lower cost panels look as good or
better than more expensive higher performance displays. If you are a display or
product manufacturer and want to turn your display into a spectacular one to
surpass your competition then Contact
DisplayMate Technologies to learn more.
Article Links: Display Technology Shoot-Out
Article Series Overview and Home Page
Copyright © 1990-2014 by DisplayMate
Technologies Corporation. All Rights Reserved.
This article, or any part
thereof, may not be copied, reproduced, mirrored, distributed or incorporated
into any other work without
the prior written permission of DisplayMate Technologies Corporation
