How We Test
Mobile Displays
Dr. Raymond M. Soneira
President, DisplayMate Technologies Corp.
Copyright © 1990-2006 by DisplayMate
Technologies Corporation. All Rights Reserved.
This article, or any part
thereof, may not be copied, reproduced, mirrored, distributed or incorporated
Into any other work without
the prior written permission of DisplayMate Technologies Corporation
Article Links: Overview MP3 and Video Players
Smart Phones
Game Consoles
Printing: If your browser is
improperly printing some pages with text cutoff
on the right edge then either print
in Landscape mode or reduce the font
size (View Menu - Text Size) and
margins (File Menu - Page Setup).
This sidebar provides additional
technical details and background information on the lab measurements for the Mobile
Devices LCD Comparison and Picture Quality Shoot-Out article series. The
devices were tested using the same technology and methodology as in the Display Technology Shoot-Out
article series for CRT, LCD, Plasma, DLP, and LCoS HDTVs, which includes
additional details, in-depth explanations, interpretations and analysis for all
of the tests discussed here.
DisplayMate Test
Patterns
All
of the testing was done using a very large set of test patterns produced by a
special version of the DisplayMate
Multimedia Edition, our most advanced Windows based video diagnostic
product. This is the same product used by PC Magazine, ExtremeTech, and most
major publications for testing and evaluating monitors, projectors and HDTVs.
The Multimedia Edition is able to produce accurate test patterns for all of the
device’s unique resolutions because it generates the patterns real-time from
scale free mathematical equations. Producing the test patterns at the native
resolution of each device was essential for all of the testing.
NIST Flat Panel
Display Measurements Standard
We also
used the NIST (National Institute of
Standards and Technology) FPDM, Flat
Panel Display Measurements Standard, which is produced in association with VESA (Video Electronics Standards Association).
See the Shoot-Out Part I for
details. The Screen
Reflectance measurements in Table 2 were done in accordance with FPDM 308-1,
Reflectance with Diffuse Illumination, using an integrating hemispherical dome
and a calibrated diffuse white reflectance standard. All of the devices were
tested with their Backlight set for maximum brightness and connected to their
AC Adapter, so their battery state was not an issue.
Photometry and
Colorimetry
All of the
Photometry and colorimetry for the article was done with a Konica
Minolta CS-200 Chroma Meter spectroradiometer, which was provided by Konica Minolta Sensing Instruments. A
spectroradiometer was necessary because the more common and inexpensive
colorimeters would have delivered inaccurate results (see the Shoot-Out Part I for
an explanation). This spectroradiometer also has a narrow one degree acceptance
angle, which is very important when measuring LCD panels. The NIST-VESA FPDM
calls for a maximum acceptance angle of two degrees.
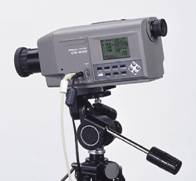
Konica Minolta CS-200
Gray Scale and
Gamma
Figure 1 in
each article shows the LCD Screen Brightness (technically referred to as the
luminance) in cd/m2 (candelas per square meter) for each of the
displays as a function of the signal/image intensity level (0-255) expressed as
a percentage of maximum (0-100 percent). The open symbols plotted on the graph are the measured data
points. They are
plotted on dual logarithmic scales because the desired relationship is a
mathematical power-law, which appears as a straight line on a log-log graph.
The graphs are all staggered vertically for clarity.
Many of the
devices depart significantly from the desired gray scale. See Figure 2 in the Shoot-Out Part D for
examples of displays with ideal gray scales. Many of the devices show
significant compression (rounding and flattening) at both the bright and dim
ends of the gray scale, which is typical for under compensated LCD panels. The Gamma (Table 3) was calculated
from the logarithmic slope in the central 40 to 80 percent signal range. The
optimum Gamma values are in the range of 2.2 (the official standard) to 2.5
(high contrast). Some of the devices greatly exceed this, which produces too
much picture contrast. The Bright Compression (Table 3) is calculated by extrapolating the
Gamma fit to 100 percent intensity and comparing that to the data value.
Chromaticity
Colors are
measured in special chromaticity coordinates. We measured the primary colors
for each device with the spectroradiometer and plot them on a 1976 CIE Uniform
Chromaticity Scale diagram with u’,v’ coordinates in Figure 2 of each article,
together with the ITU Rec.709 standard primary colors for HDTVs and sRGB
computer monitors, which are marked by the black triangle. The outer white line
defines the pure spectral colors (upper horseshoe) and the purples connecting
the extreme ends of the visible spectrum (lower diagonal line). The White
Points for the devices are plotted together with the D6500 standard (in black).
See the Shoot-Out Part
II for an in-depth discussion of this topic.
Article Links
Series
Overview
MP3
and Portable Video Players
Smart Phones
Handheld
Game Consoles
How We Test Mobile
Displays
About the Author
Dr. Raymond Soneira
is President of DisplayMate Technologies Corporation of Amherst, New Hampshire,
which produces video calibration, evaluation, and diagnostic products for consumers,
technicians, and manufacturers. See www.displaymate.com.
He is a research scientist with a career that spans physics, computer science,
and television system design. Dr. Soneira obtained his Ph.D. in Theoretical Physics from
Princeton University, spent 5 years as a Long-Term Member of the world famous
Institute for Advanced Study in Princeton, another 5 years as a Principal
Investigator in the Computer Systems Research Laboratory at AT&T Bell
Laboratories, and has also designed, tested, and installed color television
broadcast equipment for the CBS Television Network Engineering and Development
Department. He has authored over 35 research articles in scientific journals in
physics and computer science, including Scientific American. If you have any comments or questions about the
article, you can contact him at dtso@displaymate.com.
Copyright © 1990-2006 by DisplayMate
Technologies Corporation. All Rights Reserved.
This article,
or any part thereof, may not be copied, reproduced, mirrored, distributed or
incorporated
into any other work without the prior written permission of DisplayMate
Technologies Corporation
