LCD
Shoot-Out
MP3 and
Portable Video Players
Dr. Raymond M. Soneira
President, DisplayMate Technologies Corp.
Copyright © 1990-2006 by DisplayMate
Technologies Corporation. All Rights Reserved.
This article, or any part
thereof, may not be copied, reproduced, mirrored, distributed or incorporated
Into any other work without
the prior written permission of DisplayMate Technologies Corporation
Article Links: Overview MP3 and Video Players
Smart Phones Game Consoles
Printing: If your browser is
improperly printing some pages with text cutoff
on the right edge then either print
in Landscape mode or reduce the font
size (View Menu - Text Size) and
margins (File Menu - Page Setup).
Introduction
The
original audio-only portable MP3 players have rapidly evolved into multimedia
devices that include a color display for navigating on-screen menus with
colorful wallpaper backgrounds, looking at slide shows of digital photos, and
most recently, watching movies and TV shows. And if a TV is available, most of
them will display everything on the big screen with their TV Out capability.
But, how good are these tiny screens? Are they toys, pretentious devices, or
high quality displays that can produce excellent picture quality comparable to
your HDTV or computer monitor? To answer these questions I used the same
high-powered analysis methods we use for testing and evaluating high-end HDTVs
at DisplayMate Technologies. We’re
going to find out how worthy these little players are…
The Players
In Part I we will be examining five MP3 and Portable Video
Players. The Apple iPod (5th Generation) and Creative Zen Vision:M
are mainstream photo/video MP3 players. The Epson P-4000 is a hefty
professional photo viewer that can also play MP3 audio and MPEG-4 videos. The
Archos 604 and Cowon A2 are full-featured Portable Video Players that can also
record in MPEG-4 format. All of these players have large hard drives and
download audio, photo, and video content via USB. The Epson P-4000 can also read
content stored on Compact Flash and SD memory cards. Table 1 lists the most
important display specifications for the five players, arranged by screen size.
Table 1 – Display Specs
|
|
Apple
iPod G5
|
Creative
Zen Vision:M
|
Epson
P-4000
|
Cowon
A2
|
Archos
604
|
|
Screen Size
|
2.5 inches
|
2.5 inches
|
3.8 inches
|
4.0 inches
|
4.3 inches
|
|
Screen Shape
Aspect Ratio
|
1.33 = 4:3
|
1.33 = 4:3
|
1.33 = 4:3
|
1.76 = 16:9
Widescreen
|
1.76 = 16:9
Widescreen
|
|
Resolution
|
320 x 240
|
320 x 240
|
640 x 480
|
480 x 272
|
480 x 272
|
|
Dots Per Inch
|
160
|
160
|
212
|
140
|
128
|
|
Screen Colors
|
65K
|
262K
|
262K
|
16.7M
|
16.7M
|
Don’t
be turned off by the relatively low resolutions of these players, because it is
the pixel density, or Dots Per Inch, DPI, that determines how sharp their
images appear, and these are relatively high DPIs. For reference, a 19 inch LCD
monitor has a DPI of 86. The number of Screen Colors that a
display can produce is frequently misinterpreted as an indication of its color
gamut. It has nothing to do with the gamut, but rather specifies the number of
possible intensity levels for each of the red, green and blue primary colors,
which can vary from 32 to 256 levels. In principle, displays with more
intensity levels will produce a smoother image with less visible contouring,
but it turns out that there is very little visual difference between them here
because of the high DPI screens.
LCD Panel
Performance
Before
we can evaluate the picture quality of the players we need to measure the
performance of their LCD panels for Brightness, Contrast, and Viewing Angles.
The results shown in Table 2 were made with a laboratory spectroradiometer. See
How We Test for
technical details and explanations of the measurements. The
results are color coded based on the relative performance of all 11
players, phones and game consoles tested for this 3-part series. Green means
excellent or significantly better than the other units; red means poor or
significantly worse than the other units; and yellow means mediocre performance.
The color coding makes it easy to see trends among all of the units.
Table
2 – LCD Brightness, Contrast and Viewing Angles
|
|
Apple
iPod G5
|
Creative
Zen Vision:M
|
Epson
P-4000
|
Cowon
A2
|
Archos
604
|
|
Peak Brightness
|
168 cd/m2
|
280 cd/m2
|
116 cd/m2
|
154 cd/m2
|
174 cd/m2
|
|
Black Level Brightness
|
1.49 cd/m2
|
0.55 cd/m2
|
0.37 cd/m2
|
0.49 cd/m2
|
0.31 cd/m2
|
|
Contrast Ratio
for Low Ambient Light
|
113
|
508
|
312
|
315
|
561
|
|
Screen Reflectance
|
19 percent
|
14 percent
|
12 percent
|
13 percent
|
4 percent
|
|
Contrast Rating
for High Ambient Light
|
9
|
20
|
10
|
12
|
44
|
|
Forward Tilt Viewing
Contrast at +15 degrees
|
77
|
338
|
356
|
462
large increase
|
382
|
|
Horizontal Side Viewing
Contrast at ±45 degrees
|
27
|
69
|
31
|
35
|
66
|
Brightness and Contrast:
Peak Brightness is very important in bright ambient light viewing
conditions (the brighter the better) but is not important for low ambient light
viewing. Black Level Brightness is the residual dark glow that the screen (and each pixel)
gives off when it is supposed to be producing true black. It is distracting and
also washes out both the contrast and color saturation of the dark portions of
the image. It is very important in low ambient light viewing conditions: the
lower the better. The Contrast Ratio is generally considered one of the most important measures
of display performance. It is calculated by dividing the Peak Brightness by the
Black Level Brightness, and it tells you the range of brightness that the
display can produce. The larger the better. However, the Contrast Ratio is only
relevant for low ambient light viewing conditions due to reflections off the
screen (next).
Performance under Bright Ambient
Light:
When these players are used in bright ambient light the
screen won’t appear as dark because it reflects a certain percentage of the
room light. This washes out the images by reducing contrast and color
saturation. We measured the Screen Reflectance, which
is the percentage of ambient light reflected by each player. The lower the
better. The Archos 604 was the clear winner. The Contrast
Rating for High Ambient Light is a measure of the contrast you’ll see
under high ambient lighting conditions. It is simply the Peak Brightness
divided by the Screen Reflectance value in the Table. Again, the larger the
better. If you frequently watch a player under bright ambient light conditions
then this may be the single most important specification.
Viewing
Angles:
The
brightness, contrast and color saturation that you see on the screen varies
significantly with your viewing angle. It has a major impact on image and
picture quality. If you’re watching by yourself, the Forward Tilt Viewing angle will vary
depending on how you hold the player. If you’re watching in a group, people to
the left and right of the screen will be positioned with a Horizontal Side Viewing angle. The industry standard viewing angle
that is published by LCD manufacturers is not particularly useful here because
it specifies the angle where the Contrast Ratio falls to 10, an incredibly low
value that is meaningful for digital watches, but not for imaging displays.
Table 2 lists the Contrast Ratio for a 15 degree forward tilt of the screen,
which is the largest angle a single viewer is likely to use. Table 2 also lists
the Contrast Ratio for Horizontal Side Viewing at ±45 degrees, which is roughly
what a person sitting next to the central viewer will see. These Contrast
values provide a good measure of how the viewing experience varies with angle.
Image and Picture
Quality Ratings
An
LCD screen with low ratings in Table 2 can still wind up looking quite good
with the right color scheme because color can be used to enhance the visual
contrast in the menu and data screens. That’s how many of these high DPI
screens can appear gorgeous. But that technique can’t be used with photos and
videos.
Gray
Scale and Picture Contrast
The
image and picture quality of any display depends on its gray scale and
saturation of its primary colors. The gray scale describes how the brightness of image pixels
varies between the black and white extremes that were discussed in Table 2. The details on how it varies between black and white
determines the contrast within an image. Too much is just as bad as too little.
We carefully measured the gray scale of each player with the laboratory
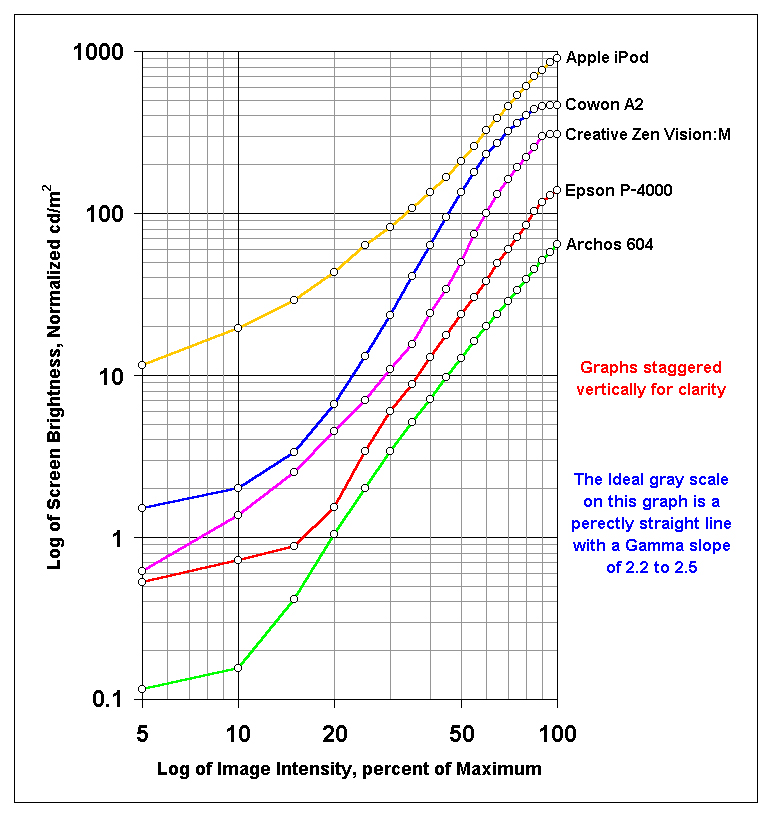
spectroradiometer. Graphs of the gray scales are shown in Figure 1. See How We Test for
details and explanations of the measurements. The differences in gray
scales are striking and explain much of the differences in picture quality that
we witnessed in the viewing tests.
Figure 1. Gray Scales
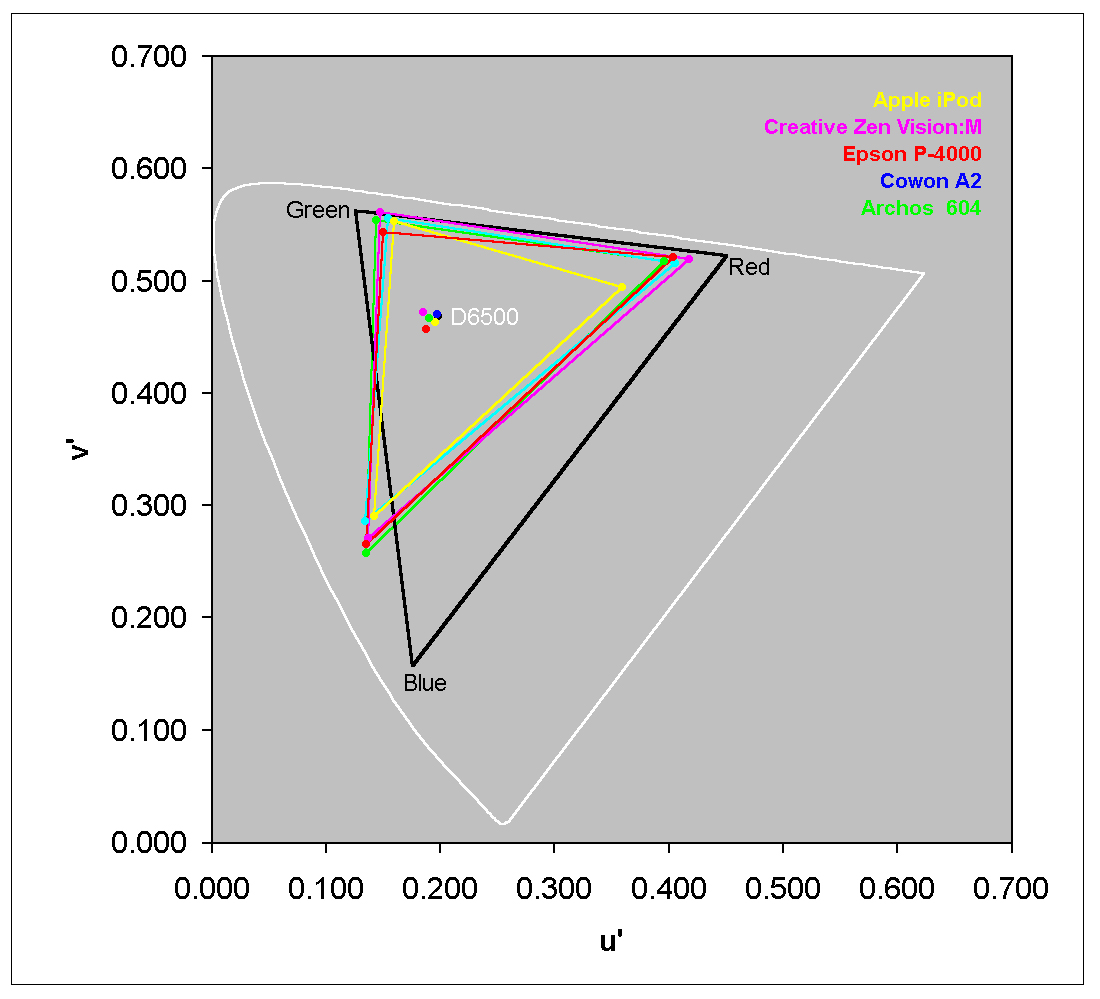
Figure 2. Primary Colors
Click to enlarge
Click to enlarge
The results
are summarized in Table 3 by listing the gray scale Compression and Gamma for
each player. Compression of the gray scale near its maximum intensity makes the picture look over exposed. Gamma specifies the steepness of the gray scale and
the amount of Picture Contrast, which by
industry standards should be between 2.2 and 2.5. The Creative and Cowon
players both had very high compression and too much contrast, which was easy to
see in the viewing tests.
Table 3 – Image and Picture
Quality Ratings
|
|
Apple
iPod G5
|
Creative
Zen Vision:M
|
Epson
P-4000
|
Cowon
A2
|
Archos
604
|
|
Picture Contrast
Compression / Gamma
|
Too Low
9% / 2.17
|
Very High
32% / 3.20
|
Too High
7% / 2.65
|
Too High
36% / 2.67
|
Excellent
3% / 2.44
|
|
Color Gamut Range
Compared to
sRGB and HDTV
|
41 percent
|
61 percent
|
55 percent
|
53 percent
|
58 percent
|
|
Reference and Optimized Photos
|
Reference
Optimized
|
Reference
Optimized
|
Reference
Optimized
|
Reference
Optimized
|
Reference
Optimized
|
|
Video Encoding
|
H.264
768 bps
320x240 30 fps
|
WMV
672 kbps
320x240 30 fps
|
MPEG-4 SP
2500 kbps
640x480 30 fps
|
DivX 6.2.2
1500 kbps
720x480 30 fps
|
WMV
1500 kbps
720x480 30 fps
|
|
TV Out Quality
|
Excellent
Composite
S-Video
|
Very Good
Composite
|
Excellent
Composite
|
Very Good
Composite
|
Excellent
Composite,
S-Video, RGB, Component
|
Color
Saturation and Gamut
The colors
in all color displays are produced through a combination of three primary
colors: red, green and blue. These primary colors need to be strong and
saturated in order for the displays to be able to reproduce a wide gamut of
colors. Too little saturation and the pictures will look flat and pastel-like,
too much saturation and the pictures will look gaudy. We measured the primary
colors with the spectroradiometer. Details are shown in Figure 2 and summarized
in Table 3 by comparing the Color Gamut of each
player to that of a standard High Definition TV or sRGB computer monitor. The
closer to 100 percent the better. All mobile displays have a reduced color
gamut, which can be compensated with proper processing in the player.
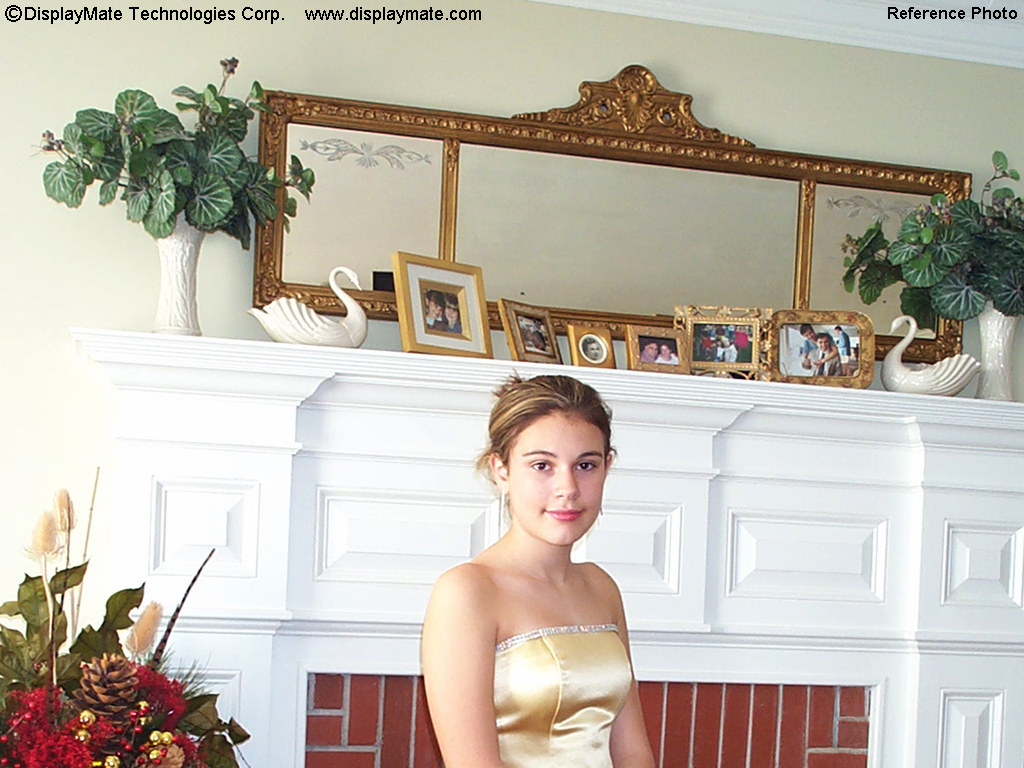
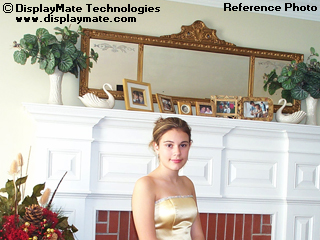
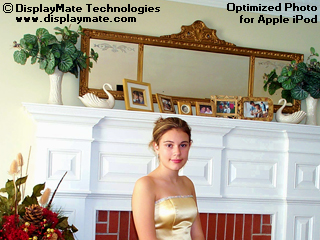
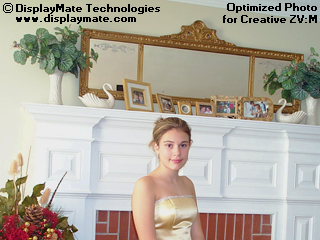
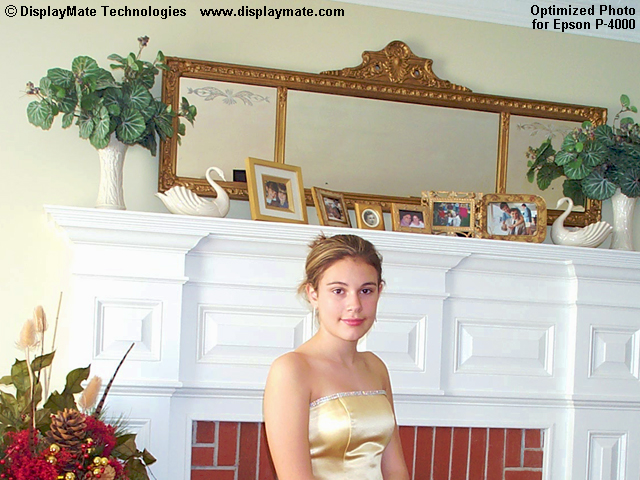
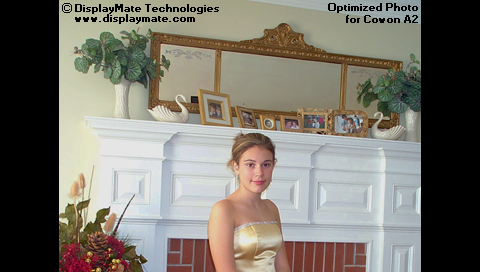
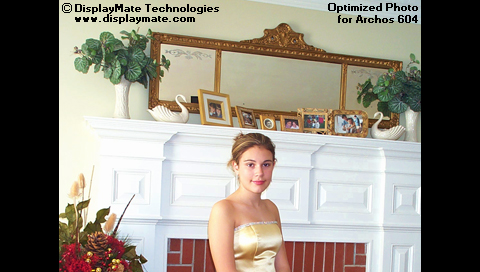
Reference
and Optimized Photos
The
players aren’t delivering anywhere near the image and picture quality they are
capable of producing. To demonstrate this we’ve produced two sets of photos for
each player: a standard Reference Photo that displays correctly on a calibrated
HDTV or computer monitor, and an Optimized Photo that has been mathematically
processed based on the lab measurements so that it corrects for shortcomings in
each unit. Links for each player are included in Table 3. Download both and
compare them to each other and to full resolution versions of the Reference
Photo for HDTVs
(1280x720) and LCD computer
monitors (1280x1024). Left click the links to view on your current display,
right click to download the image files. Note that the Optimized Photos are
modified for the specific players, and will appear to have incorrect gray
scales and color on other displays.
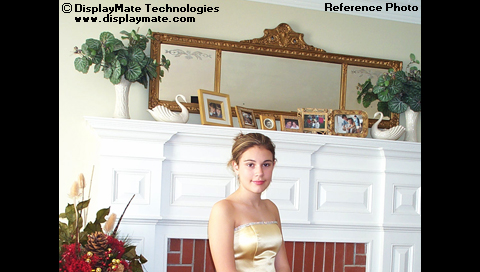
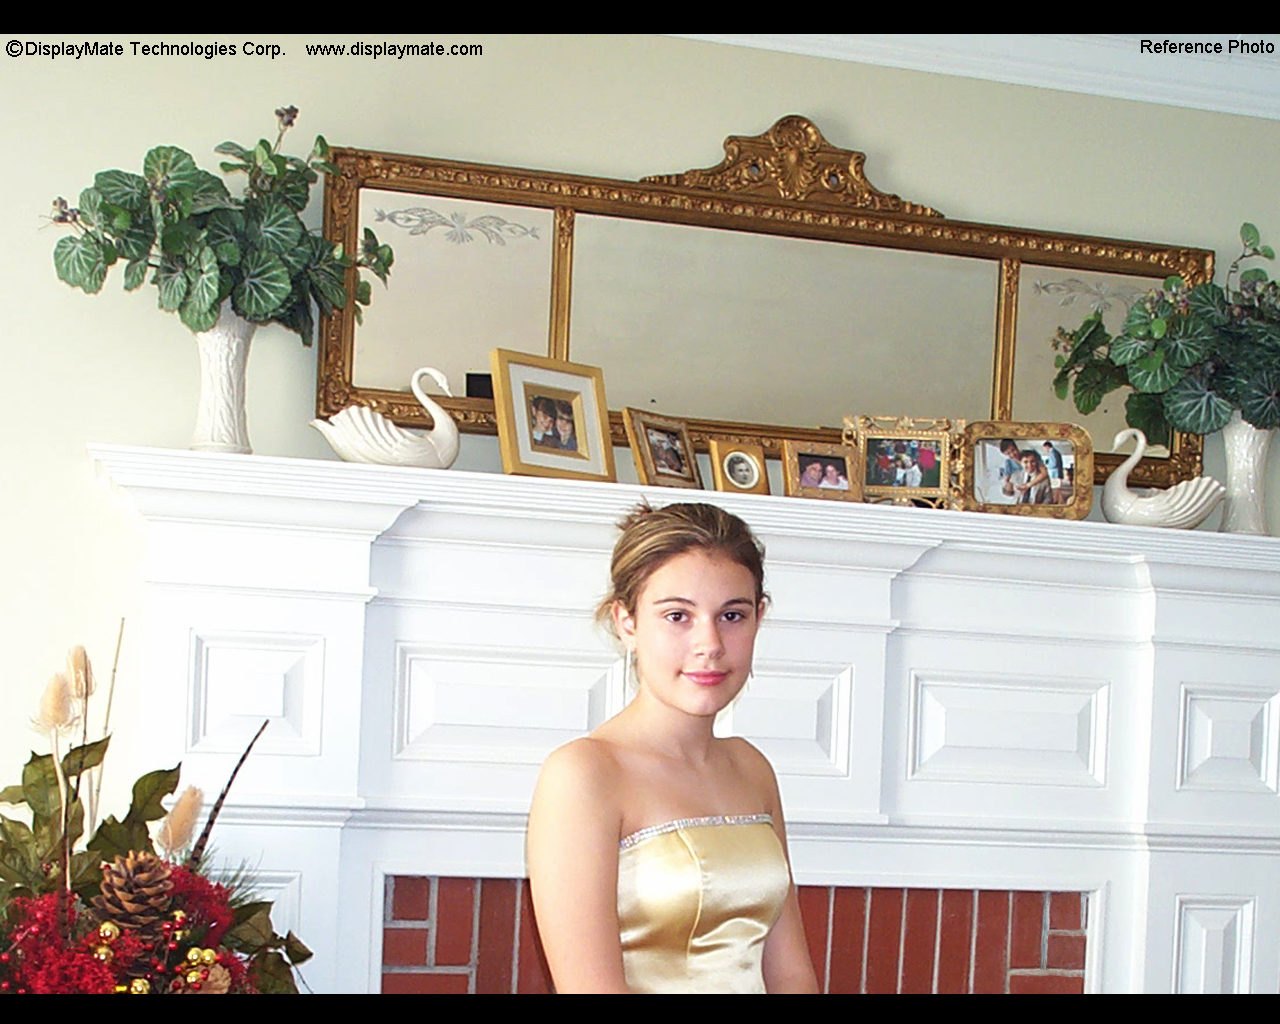
 After
downloading the appropriate Reference and Optimized Photos do an A-B comparison
by quickly flipping between them. Here is what you should see on a player,
computer monitor or HDTV. A thumbnail of the Reference Photo is pictured at
left. Good: Be able to clearly make out ALL of
the individual moldings on the fireplace mantle. Very
Good: See a natural, smooth and rich
facial flesh tone without ANY of the highlights appearing white washed, washed
out, or over exposed. Excellent: See the
left edge of the fireplace mantle where it meets the light green wall.
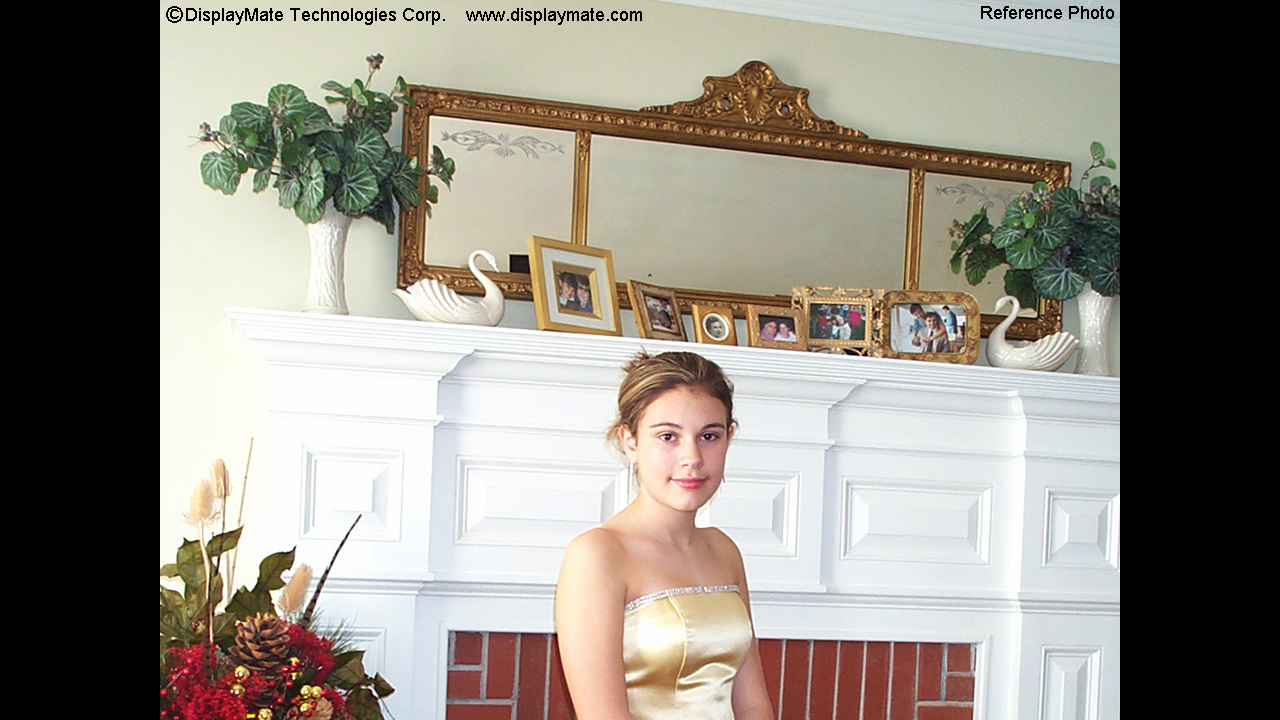
After
downloading the appropriate Reference and Optimized Photos do an A-B comparison
by quickly flipping between them. Here is what you should see on a player,
computer monitor or HDTV. A thumbnail of the Reference Photo is pictured at
left. Good: Be able to clearly make out ALL of
the individual moldings on the fireplace mantle. Very
Good: See a natural, smooth and rich
facial flesh tone without ANY of the highlights appearing white washed, washed
out, or over exposed. Excellent: See the
left edge of the fireplace mantle where it meets the light green wall.
TV Out
The Archos,
Cowon, and Epson players have screens large enough for three (very friendly)
people to view at the same time. But the TV Out capability makes all of the
players useful for presentations to much larger audiences. All of the tested
players can output their images to a TV with 640x480 or 720x480 resolution
signals, which is higher than the resolution of all but one of the tested LCD
screens. We evaluated the TV Out Quality by
looking at test patterns, photos and videos on a calibrated professional
television studio monitor. All of the players produced very good TV picture
quality, although we had to readjust some of the TV’s calibrated controls to
get the best picture. Note that lower performance TVs may not be able to
produce as good a picture quality as the player’s own screen. All of the
players include a composite video signal output for the TV. The Universal Dock
for the Apple iPod has a higher signal quality S-Video output and the DVR
Station for the Archos 604 provides the highest quality RGB and Component Video
outputs in addition to S-Video.
After
the extensive lab tests it was time to see how well the units would perform
visually with real photos and videos. So, for the Shoot-Out style Viewing Tests, we compared all
eleven tested units simultaneously, side-by-side, showing identical content
and comparing them to each other and to a carefully calibrated digital HDTV
connected to a PC. I used a large selection of challenging photos that we have
for evaluating HDTVs. For video picture quality I used a number of movie clips
including The Matrix (which has lots of dark content and a subtle green
caste that is difficult for displays to reproduce accurately) and Seabiscuit
(which has lots of colorful outside scenery and great facial close-ups).
Table 4 provides the results. For the grading and
rankings I carefully arranged all of the units until they were ordered from
best to worst picture quality, left to right. The evaluations are based on
ideal viewing conditions with no ambient light and perfect face-on (zero
degree) viewing angle. Each display was scored based on how close it came to
delivering an ideal picture, so its screen size, brightness, and pixel count
are not part of the grade. Looking at photos and videos on all eleven screens
at once was an amazing experience. The range and differences in picture quality
were staggering.
Table 4 – Shoot-Out Results
and Grades
|
|
Apple
iPod G5
|
Creative
Zen Vision:M
|
Epson
P-4000
|
Cowon
A2
|
Archos
604
|
|
Viewing Test
Shoot-Out
|
Poor Contrast and Color Saturation
|
Over Exposed Photos, Picture
Contrast very high
|
Color Saturation and Picture
Contrast slightly too high
|
Over Exposed Photos, Picture
Contrast slightly too high
|
Color Saturation
slightly too low
|
|
Overall Image and Picture Quality
Rating
|
C
|
B–
|
A
|
B–
|
A
|
|
Rank out of 11 units
|
10
|
9
|
2
|
8
|
1
|
|
Picture Quality Rating
with Optimizer
|
A–
|
A
|
A
|
A
|
A
|
Two
players (and two smart phones, Part II)
delivered excellent image and picture quality. The top honors go to the Archos 604, which has the
best all-around image and picture quality, and to the Epson P-4000. Both earned
As and were the top two performers of the eleven units tested. The Creative Zen Vision:M and Cowon A2 were penalized for
producing severely over-exposed photos (bright-end compression) and excessive
picture contrast. The Apple iPod produced washed out images due to a triple
whammy of low LCD Contrast, low Picture Contrast, and low Color
Saturation. Coolness and promotional considerations aside, it simply did not
measure up to the other units in both the lab tests and the visual comparisons.
Clearly Apple hasn’t yet taken picture quality as seriously as audio quality
for its iPods.
Much of the
reduced image and picture quality of the players is due to sub-optimal
processing within each unit. The Optimized Photos (available via links in Table
3) demonstrate the picture quality the units are capable of producing when
mathematical corrections based on the lab measurements are applied to the image
files. You can download them and see for yourself if you have one of the tested
units. The bottom row of Table 3 provides the image and picture quality ratings
based on the Optimized images. When viewing them, the differences between players
become relatively small and all of the players deliver very good to excellent
picture quality. Hopefully, the next generation of devices will improve their
software/firmware processing and produce this kind of picture quality on their
own.
What’s Coming Next
In Part II, we’ll
examine the image and picture quality of four high-end Smart Phones and compare
them to the Players.
Article Links
Series
Overview
MP3
and Portable Video Players
Smart Phones
Handheld
Game Consoles
How We Test Mobile
Displays
About the Author
Dr. Raymond Soneira
is President of DisplayMate Technologies Corporation of Amherst, New Hampshire,
which produces video calibration, evaluation, and diagnostic products for
consumers, technicians, and manufacturers. See www.displaymate.com. He is a research
scientist with a career that spans physics, computer science, and television
system design. Dr. Soneira obtained his Ph.D. in Theoretical Physics from Princeton
University, spent 5 years as a Long-Term Member of the world famous Institute
for Advanced Study in Princeton, another 5 years as a Principal Investigator in
the Computer Systems Research Laboratory at AT&T Bell Laboratories, and has
also designed, tested, and installed color television broadcast equipment for
the CBS Television Network Engineering and Development Department. He has
authored over 35 research articles in scientific journals in physics and
computer science, including Scientific American. If you have any comments or questions about the article, you can contact
him at dtso@displaymate.com.
Copyright © 1990-2006 by DisplayMate
Technologies Corporation. All Rights Reserved.
This article,
or any part thereof, may not be copied, reproduced, mirrored, distributed or
incorporated
into any other work without the prior written permission of DisplayMate
Technologies Corporation
