LG OLED TV Display Technology Shoot-Out
Dr. Raymond M. Soneira
President, DisplayMate Technologies
Corporation
Copyright © 1990-2013 by DisplayMate Technologies Corporation. All
Rights Reserved.
This article, or any part thereof, may not be copied, reproduced,
mirrored, distributed or incorporated
into any other work without the prior written permission of
DisplayMate Technologies Corporation
Introduction
Displays
with Organic Light Emitting Diodes, OLEDs, are the most interesting and
promising new display technology in over a decade – possibly ever. In a span of
just a few years this new display technology has improved at a very impressive
rate, first challenging and now surpassing the performance of the best LCD and
Plasma displays. OLEDs are an entirely different and new form of display
technology – they are very thin solid state displays that emit colored light
directly, while LCDs use a Liquid Crystal that regulates light transmission
from a separate backlight, Plasmas use an ionized gas with phosphors, and CRTs
use an electron beam in a vacuum with phosphors.
While there have been quite
a few experimental and prototype OLED displays shown over the last 5+ years,
including an 11 inch 960x540 pixel TV by Sony, OLEDs first appeared in actual
consumer products as 4 to 8 inch displays in Smartphones and Tablets beginning
in 2010. However, producing a large screen OLED TV is considerably more
difficult for many reasons – for one, a 55 inch TV screen has 121 times the
area of a 5 inch Smartphone. This results in major production and technology
issues, particularly in manufacturing yield and cost.
There are
currently only two manufacturers that have begun production of OLED TVs: LG and
Samsung. The TVs are based on somewhat different OLED technologies. This
article examines the LG OLED TV. LG provided DisplayMate Technologies an early
production OLED TV (model 55EA9800) with a 55 inch (1.4 meter) screen to test
and analyze for this article. Over the past few weeks we have performed an extensive
series of Lab tests and viewing tests to evaluate the LG OLED TV technology and
picture quality, and also to compare it to existing LCD and Plasma TVs. We’ll
cover these issues and much more, with in-depth comprehensive display tests,
measurements and analysis that you will find nowhere else.
This will
be a two-part article: this first article is devoted to explaining the unique
performance capabilities of the OLED TV, with only general comparisons with LCD
and Plasma TVs. In Part II we will provide detailed Lab measurements and
side-by-side performance comparisons with an LCD TV and a Plasma TV. Before we
begin the technical analysis, here are several other important issues…
There are No LED TVs!
The first
thing we need to clear up is the confusion created by the marketing of “LED
TVs” – there aren’t any! The so-called LED TVs are just LCD TVs that have a
backlight that is made of white LED lights. The LEDs are not the display, just
the backlight, nothing more! OLEDs are an entirely different emissive imaging
display technology (that doesn’t use a backlight). Unfortunately, many people
think they already have an LED/OLED TV at home, but they actually have an LCD
TV…
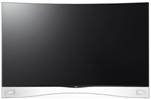
Design Features
Several
design features immediately standout with this OLED TV: it has a slightly
curved screen, the screen is incredibly thin at just 0.16 inches (4.3 mm), it
has an elegant curved transparent base, a dark black rimless screen without a
bezel, and a small 0.4 inch (1 cm) flush border surrounding the picture to the
outer edge of the screen. Even the rear of the TV looks elegant with a
patterned design on a high-tech Carbon Fiber Reinforced Polymer that provides a
light weight and high-strength backing for the OLED screen.
Curved Screen
The screen
on the LG OLED TV is slightly curved, which has generated lots of commentary.
One reason for curving the screen is just because it can be done with OLEDs,
while LCDs and Plasmas cannot (although some LCD TVs were recently introduced
with curved glass screens). So it’s a new design element that provides some
flair and notoriety. But… the screen is just slightly curved, with a radius of
curvature of 16.4 feet (5.0 meters), so the corners of the screen are only 1.4
inches (3.6 cm) forward of the rear (center) of the screen – so it’s not a
large geometrical effect – just the right amount to significantly improve
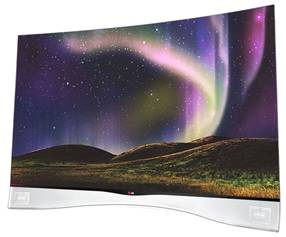
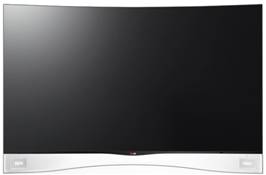
display performance as described below. The promotional photo at the top of the
article is designed to emphasize the curves… The photo below is closer to an
actual frontal view.
Whether
you prefer a curved or flat screen is primarily subjective, but the slightly
curved screen does provide several important objective advantages:
First and
foremost, the concave screen shape cuts down on reflections from surrounding
ambient light two ways: by reducing the screen’s 180 degree opening angle, which
eliminates reflections from some ambient lighting on the sides, and also from
specular (mirror) reflections off the concave screen, which directs some
reflected ambient light from behind the viewers away from their line of sight.
This is very important for a display technology that produces excellent dark
image content and perfect blacks – because you don’t want that spoiled by
ambient light reflected off the screen.
The slight
curvature reduces visual geometric distortion: When you watch a perfectly flat TV
screen, the corners of the screen are further away than the center so they
appear smaller. As a result, the eye doesn’t see the screen as a perfect
rectangle – it actually sees dual elongated trapezoids, which is keystone
geometric distortion. The slight curvature on the LG OLED TV reduces this
subtle keystone geometric distortion by 50 percent at a typical 8 foot (2.4
meter) viewing distance.
The slight curvature improves
viewing from the sides away from the central sweet spot: A second and
more subtle point: people sitting off to the sides away from the central sweet
spot actually get a somewhat better viewing experience than with a flat screen
because the curved screen accommodates their viewing direction better by
compensating for some of the uneven image foreshortening that is seen with a
flat screen: the image on the side of the screen closest to you appears larger,
and the image on the side of the screen furthest away appears smaller. The
inward curvature of the screen compresses the foreshortening of the image on
the near side that appears larger, and the curvature on the far side enlarges
the distant part of image that appears smaller, which improves the overall
screen image geometry that is seen away from the central sweet spot.
The flip side is that the top and bottom of the screen
and picture don’t look perfectly straight, but rather appear with a slight
subtle curve – it’s a small geometric effect, only a 1.5% curve (difference
between the center and sides) is seen at an 8 foot (2.4 meter) viewing
distance. It’s more apparent when the room lights are on, but much less so in
low ambient lighting, which is the best way to watch the TV. I found that if I
didn’t make a point of looking for the slight curvature, I didn’t notice it.
For me, the advantages of reduced reflections and better side viewing outweigh
noticing a slight curvature, but it is none-the-less still a subjective call…
It is important to emphasize that the curvature is
subtle, just 1.4 inches (3.6 cm) on a 55 inch (1.4 meter) screen. That is just
the right amount to significantly improve the picture quality as described
above. Reviewers who have said the opposite, that the curvature interferes with
multiple viewers or viewing away from the central sweet spot have clearly not
spent much (or any) time actually viewing (and testing) this curved screen TV.
Pricing
Brand new technologies
always start out very expensive – and this first generation 55 inch (1.4 meter)
LG OLED TV is no exception at $9,999 US (€8,999 Euros), which is comparable to
the initial pricing for large Plasma TVs when they first came out. Given the
limited production, even at this high price point LG will still be able to sell
every one they can make. As the OLED TV technology is refined and production
yields increase the price will steadily come down. At some time in the future –
which will take years – OLED TVs will become cheaper to make than LCDs and
Plasmas because they are considerably less complicated to manufacture and
assemble. An LCD display panel, for example, consist of dozens of separately
manufactured components that are assembled like a car on an assembly line,
whereas OLED displays are manufactured more like a large semiconductor chip.
Overview and Summary of Results
OLEDs
provide a number of major technology enhancements for displays and TVs: high
Peak Brightness together with perfect Blacks, Infinite Contrast Ratios, very
wide Viewing Angles, and very fast Response Times without visible Motion Blur.
But what makes this TV absolutely stunning is combining that with a very
accurate factory calibration that takes full advantage of the OLED display
technology and delivers picture quality and accuracy that is visually
indistinguishable from perfect based on our extensive Lab tests. Below is an
Overview and Summary of the extensive Lab and Viewing Tests followed by the LG OLED TV Conclusions.
We have
also provided a Lab
Measurements and Technical Analysis section that has detailed technical
information and data on: White Sub-pixels, Brightness and Contrast Ratio,
Screen Reflectance, JNCD Just Noticeable Color Difference, Color Gamuts,
Absolute Color Accuracy, Intensity Scale and Image Contrast, Color Tracking
Accuracy, Changes with Viewing Positions and Viewing Angles, Response Time and
Motion Blur, Stuck or Dead Pixels, Screen Saver, and Power Consumption.
LG OLED TV Technology
This LG TV
has some unique OLED technology. First of all, rather than laying out a matrix of separate
Red, Green, and Blue OLED sub-pixels throughout, the TV has a uniform set of
WRGB sub-pixels that are made as a stack of various colors of OLEDs. This
approach simplifies the OLED production, improves yields, and lowers the
manufacturing cost. A set of Red, Green and Blue sub-pixel filters, which LG
calls a Color Refiner, recovers the desired Red, Green and Blue OLED colors for
each sub-pixel. This approach also improves Viewing Angle performance, which is
outstanding. LG has also added a 4th clear sub-pixel to every pixel, which
produces pure White. This increases the display’s power efficiency and also
improves color accuracy and color management. See the
Lab
Measurements and Technical Analysis section for more information on White
Sub-pixels. Lastly, the OLED pixels are all
driven by an Active Matrix IGZO Metal Oxide backplane. The Refresh Rate for the
display is 120 Hz. Not surprisingly, it’s a cutting edge state-of-the-art
display throughout…
Picture Modes
This TV comes with 6
different preset Picture Modes for viewers to choose from: Vivid, Standard,
Eco, Game, ISF Expert and THX Cinema. The THX Cinema and ISF Expert picture
modes both deliver close to a visually perfect TV calibration that we will
examine in detail below. The Certified THX Cinema mode has no user adjustable
controls or options, including brightness, and is designed for viewing under
specified low ambient light viewing conditions. The two ISF Expert modes
provide lots of user adjustments, but the TV is so well calibrated that “OLED
Brightness” and Color (saturation) are the only two that should be adjusted
based on individual viewer preferences. The Standard, Eco, Game, and Vivid
Picture Modes offer a peppier picture with more color, image contrast, and
dynamic image processing. The TV also has 3D modes, and it comes with four
pairs of light weight designer 3D glasses that look and wear like fashionable
sunglasses. We’ll cover these modes in depth below.
Brightness
This OLED
TV delivers a Peak Brightness that is comparable to the brightest large screen
LCD TVs for TV, movie, and video content. While the THX Cinema mode has an
intentionally low Luminance of 135 cd/m2 for viewing under low
ambient lighting, the equally well calibrated ISF Expert modes go up to 308
cd/m2, which is impressively bright for an accurately calibrated TV.
The Standard, Vivid, Game, and Eco modes deliver up to 372 cd/m2.
When using the TV for watching typical web and computer content, which often
have lots of bright white content, the Peak Brightness can decrease to 110 to
140 cd/m2, which is bright enough for comfortable viewing in all but
the highest ambient light. See the Lab
Measurements section for details.
Screen Reflections
The screens on all displays
are mirrors that reflect light from everything that is illuminated anywhere in
front of the screen (especially anything behind the viewers), including lamps,
ceiling lights, windows, direct and indirect indoor and outdoor sunlight, which
washes out the on-screen colors, degrades image contrast, and interferes with
seeing the on-screen images. This is especially important for OLED displays
because they produce excellent dark image content and perfect blacks – you
don’t want that spoiled by ambient light being reflected off the screen. The LG
OLED TV has the lowest screen Reflectance of any display that we have ever
measured, just 2.2 percent, which is half of the previous 4.4 percent record –
an impressive achievement. LG accomplished this by using both an
anti-reflection screen treatment together with circular polarizers that
suppress light reflections (which are part of the TV’s 3D FPR optics, below).
We visually verified the very
low Reflectance by holding an iPad Air with 6.5 percent Reflectance and an
Amazon Kindle Fire HDX 8.9 with 5.0 percent Reflectance right in front of the
LG OLED TV screen. The reflections from the OLED TV screen were considerably
darker, which was quite striking. Low Reflectance really does make a significant
and visually noticeable difference!
Color Calibration and Accuracy
The
detailed Lab Measurements section shows that the THX Cinema and ISF Expert
modes are calibrated so accurately that they are visually indistinguishable
from perfect. The Color Gamut is 99% of the sRGB/Rec.709 Standard. The White
Point, Primary Colors, Reference Colors, and Color Tracking Accuracy are all
close to 1 JNCD (Just
Noticeable Color Difference), so the eye sees them as visually
indistinguishable from perfect – which was confirmed in the Viewing Tests. See
the Lab
Measurements section for details and explanations of JNCD and
Absolute Color Accuracy.
Viewing Angle Performance
The best place to
watch any display is with the viewer sitting directly in front of the center of
the screen at eye height – which is called the “sweet spot” and only one person
can be there. Other viewers may see a slight to substantial degradation
depending on how far away they are from the sweet spot. In many cases TV
viewers watch from 30 degrees and occasionally as high as 45 degrees Viewing
Angle. All displays show some variation in Brightness, Black Level, Contrast
Ratio, Intensity Scale, Gamma, White Point, Color Gamut, and Color Shifts with
Viewing Angle. The variations are generally quite large for LCDs. For the LG
OLED TV the Lab Measurements show no visually detectable variation in picture
accuracy for typical TV watching Viewing Angles up through at least ±30
degrees. See the Lab Measurements
section for details.
No Motion Blur
For the
OLED TV high speed screen shots of fast moving test patterns show absolutely no
visible display based Motion Blur or latent images from any previous refresh
cycles due to a very fast Response Time. A comparison screen shot for an LCD TV
shows considerable Motion Blur. For details and the screen shots see Response
Time and Motion Blur in the Lab Measurements
section.
Viewing Tests
Before, during, and after
the Lab Tests we spent a considerable amount of time viewing real TV, movie and
video content, lots of digital photos, plus web and computer content via its
Smart TV interface. We also invited over a dozen people to come watch and
provide their impressions of the OLED TV while viewing their chosen TV shows
and Blu-ray movies. We also looked at lots of personal digital photos on this
accurately calibrated TV, which is especially important because people
generally know exactly what the photo content actually looks like – so Absolute
Color Accuracy matters the most with your own digital photos. We carefully
setup the viewing area with adjustable low to medium ambient lighting, a
viewing distance of 8 feet (2.4 meters) and the center of the TV at viewing eye
height level. The viewer comments were unanimous, “this is the best TV we have
ever seen.” It’s the result of an excellent calibration that delivers accurate
colors and excellent image contrast together with perfect Black Levels, which
was particularly noticeable with dark content and dark picture detail that is
seldom reproduced well by other display technologies (see below). Simply
stated, the picture quality is absolutely stunning!
3D Picture Quality
This OLED
TV also has 3D modes using LG’s 3D FPR technology with Passive 3D Glasses. Back
in 2011 we did an article
on 3D TV Technology with in-depth objective scientific comparisons and
analysis, including extensive lab measurements and viewing tests together with
quantifiable 3D Visual Sharpness Tests. Our 2011 study only had LCD TVs. As a
result, we expected this LG OLED TV to perform better in 3D because of its
improved Black Levels, Contrast Ratio, Response Time, and screen optics. We
didn’t do any 3D Lab measurements this time, but viewing the same set of 3D
movies mentioned in the 3D TV article
produced even better 3D as we had expected. The Avatar and IMAX 3D movies that
we watched were immersive and gorgeous!
Comparison with LCD TVs
LCDs are
currently the dominant display technology because they do lots of things very
well. One area where LCDs are clearly number one is in Peak Brightness (because
their separate backlight can be easily brightened). The LG OLED TV has a Peak
Brightness comparable to the brightest LCD TVs, but only for Average Picture
Levels (APL) below 30%, which is typical for essentially all TV, movie and
video content. Above 30% APL, which is common for web and computer content with
white backgrounds, the OLED Brightness decreases but the LCD Brightness remains
unchanged. Other than Peak Brightness at high APL the OLED TV significantly
outperforms all LCDs in every other category including Black Levels, Contrast
Ratio, Viewing Angles, and Response Time. We’ll cover LCD TV performance in
detail in Part II of the article.
Comparison with Plasma TVs
Plasma TVs
have traditionally had a smaller market share, but they are often preferred by
video enthusiasts over LCDs because of their superior Black Levels, Contrast
Ratios, Viewing Angles, and Response Time. However, Plasma displays produce
visible image noise at dark intensity levels, which compromises their picture
quality, whereas OLED displays do not. The OLED TV clearly outperforms Plasmas
in all of the above categories, especially when viewing dark image content. In
addition, Plasma TVs typically have peak Brightness (Luminance) levels of 100
to 200 cd/m2, whereas the OLED TV produces roughly double that
value, even on the accurately calibrated ISF Expert picture modes. OLEDs will
clearly become the preferred technology for video enthusiasts. We’ll cover
Plasma TV performance in detail in Part II of the article.
In-depth Technical Information
We have
also provided a Lab
Measurements and Technical Analysis section for in-depth technical
information and data on: White Sub-pixels, Brightness and Contrast Ratio,
Screen Reflectance, JNCD Just Noticeable Color Difference, Color Gamuts,
Absolute Color Accuracy, Intensity Scale and Image Contrast, Color Tracking
Accuracy, Changes with Viewing Positions and Viewing Angles, Response Time and
Motion Blur, Stuck or Dead Pixels, Screen Saver, and Power Consumption.
LG OLED TV Conclusions
OLEDs are
the most interesting and promising new display technology in over a decade –
possibly ever. In a span of just a few years this new display technology has
improved at a very impressive rate, first challenging and now surpassing the
performance of the best LCD and Plasma displays. OLED technology provides a
number of major technology enhancements for displays: high Peak Brightness
together with perfect Blacks, Infinite Contrast Ratios, very wide Viewing
Angles, and very fast Response Times without visible Motion Blur. Equally
impressive is that OLEDs have now moved up from small mobile displays into
large TV screens for the living room.
But what
makes this LG TV absolutely stunning is the combination of OLED display
technology together with a very accurate factory calibration that delivers
picture quality and accuracy that is visually indistinguishable from perfect
based on our extensive Lab tests – a commendable and impressive achievement!
Another
notable milestone is that this first generation OLED TV is already
outperforming the established and highly refined LCD and Plasma technologies.
Normally it takes at least 5 years for that to happen, so a lot has been going
on behind the scenes… The biggest remaining challenge is to improve OLED TV
production so that the price can come down as quickly as possible to more
affordable levels. OLED TVs will eventually become cheaper to make than LCDs
and Plasmas because they are considerably less complicated to manufacture and
assemble. I can’t wait to see that happen…
See the Lab
Measurements and Technical Analysis section for in-depth technical
information and data on the LG OLED TV.
LG OLED TV Lab Measurements and Technical
Analysis
Below we analyze the LG
OLED TV model 55EA9800 using a wide range of Laboratory measurement data and
objective evaluation criteria.
White Sub-pixels
Every pixel on the LG OLED TV also has a 4th independent
pure White sub-pixel in addition to the standard Red, Green and Blue sub-pixels
found on other displays – that’s an extra 2.1 million sub-pixels, bringing the
total up to 8.3 million. In principle, they aren’t necessary because White can
be produced by the other sub-pixels, but White sub-pixels provide a number of
key advantages: they improve color management that allows the Color Gamut to be
easily adjusted, they improve the color balance of the White Point,
particularly for the crucial Color Tracking accuracy of the gray scale, and
they significantly improve the power efficiency of the display because a single
sub-pixel is needed to make the underlying gray component of every pixel
instead of powering three Red, Green and Blue sub-pixels to do the same job.
Other displays also have White sub-pixels, but they are always used to boost
brightness at the expense of color saturation and accuracy – LG is the first
manufacturer I am aware of to use White sub-pixels to improve color accuracy
rather than decrease it…
Brightness and Contrast Ratio
To fully
appreciate the excellent picture quality of this TV, it should be viewed under
relatively low ambient lighting because ambient light washes out the excellent
picture quality, image contrast, perfect blacks, and colors. The Brightness
(technically the Luminance) is measured with a Spectroradiometer in units of
cd/m2, sometimes referred to as nits. Under these conditions the
Brightness should be set rather low, typically 150 cd/m2 or less.
But when the TV is being viewed in a bright area, like a sunroom during the
day, the brightness needs to go way up, sometimes as high as possible. The
brightest large screen LCD TVs typically deliver 300 to 400 cd/m2,
and Plasma TVs typically deliver 100 to 200 cd/m2. For OLEDs,
Plasmas, and some LCDs the brightness depends on the picture content, typically
the Average Picture Level, APL. Typical TV, movie and video content has around
20% APL. Web and computer content with lots of white background have higher
APLs around 50-75%.
OLED TV
Test Result: For
typical TV, movie and video content, the THX Cinema mode Peak Brightness is
fixed at 135 cd/m2, the ISF Expert mode peak Brightness goes up to
308 cd/m2, which
is impressively bright for an accurately calibrated TV. For the Standard,
Vivid, Game and Eco modes the peak Brightness goes up to 372 cd/m2. When
using the TV for watching typical web and computer content with lots of white
background the Peak Brightness can decrease to 110 to 140 cd/m2,
which is bright enough for comfortable viewing in all but the highest ambient
light.
Screen Reflectance
The screens on all displays
are mirrors that reflect light from everything that is illuminated anywhere in
front of the screen (especially anything behind the viewers), including lamps,
ceiling lights, windows, direct and indirect indoor and outdoor sunlight, which
washes out the on-screen colors, degrades image contrast, and interferes with
seeing the on-screen images. This is especially important for OLED displays
because they produce excellent dark image content and perfect blacks – you
don’t want that spoiled by ambient light being reflected off the screen.
Reflectance Test Results:
Using an Integrating Hemisphere and Spectroradiometer we measured an Average
Screen Reflectance of 2.2 percent for the LG OLED TV, the lowest we have ever
measured for any display. The Specular (Mirror) Reflectance was also very low
at 2.7 percent. We measure that with a Spectroradiometer using a narrow
collimated pencil beam of light that is reflected off the screen. LG
accomplished this by using both an anti-reflection screen treatment together
with circular polarizers that suppress light reflections (which are part of the
TV’s 3D FPR optics).
JNCD Just
Noticeable Color Difference
The
on-screen colors produced by any display can be measured using a
Spectroradiometer together with our DisplayMate Test Patterns.
The accuracy of the colors can then be calculated using the 1976 CIE Uniform
Chromaticity color space and compared to the eye’s sensitivity to color. We
present the color errors here in terms of MPCD Minimum Perceptible Color
Difference or JNCD Just Noticeable Color Difference, where 1 MPCD = 1 JNCD =
Δ(u’v’) = 0.0040 on the CIE 1976 Uniform Chromaticity Scale. Color errors
less than 1 JNCD are visually indistinguishable, while values greater than 1
JNCD are visually noticeable when the two colors are touching on-screen. When
the colors are not touching and further apart, the threshold is higher. Here we
will use 3 JNCD for a visually noticeable display color error.
Color
Test Results: JNCD provides an accurate and objective way to evaluate the color
accuracy of the display in terms of the eye’s sensitivity to color. All of our
color results below are presented in terms of JNCD. Any Color Accuracy or Color
Error less than 3 JNCD is visually indistinguishable from perfect.
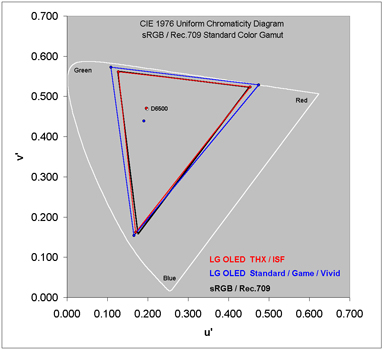
Color Gamuts
The Color
Gamut is the range of colors that a display can produce. Essentially all
current consumer image content is created using the sRGB and ITU-R BT.709
(Rec.709) standards. If you want to see accurate image colors then the display
must match the standard that was used to create the content. Note that standard
consumer content does not include colors outside of the standard sRGB/Rec.709
Gamut, so a display with a wider Color Gamut cannot show colors that are not in
the original and only produce inaccurate exaggerated on-screen colors. The
color accuracy of the images produced by a TV will depend on how closely it
reproduces the colors of the sRGB/Rec.709 color space. See Figure 1 below and this Link for an
explanation of the Figure and the CIE Color Space.
OLED TV
Test Result: The Color Gamut for the THX Cinema and ISF Expert modes is 99% of
sRGB/Rec.709, which is visually indistinguishable from perfect. For the other
Picture Modes the default Gamut is 116% of sRGB/Rec.709, which is designed to
produce somewhat over-saturated colors, which may be a personal preference for
some viewers, but can also help in high ambient light because it helps
compensate for washed out image colors. A menu option allows the default Color
Gamut to be changed.
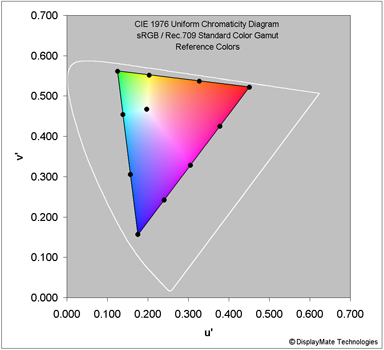
Absolute Color Accuracy
The
overall Absolute Color Accuracy of the TV was measured with a set of 10
Reference Colors that are on the periphery of the standard Color Gamut as shown
in Figure 2 and this Link for an
explanation of the Figure. In addition, an accurate Reference Color for the
White Point in the middle of the Color Gamut is essential for reproducing all
of the interior colors (together with an accurate Intensity Scale, below). The
Standard White is known as D6500 (technically D65).
OLED TV
Test Result: For
the THX Cinema and ISF Expert modes the measured color of White is within 0.6
JNCD of D6500. The average color error for all Reference Colors is 1.3 JNCD.
Both are visually indistinguishable from perfect. The other picture modes are
not intended to produce very accurate colors, so we did not measure their
accuracy.
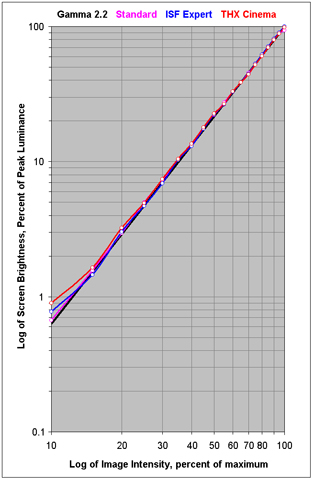
Intensity Scale and Image Contrast
The
Intensity Scale (sometimes called the Gray Scale) not only controls the
contrast within all displayed images but it also controls how the Red, Green
and Blue primary colors mix to produce all of the on-screen colors. So if the
Intensity Scale doesn't follow the Standard that is used in all consumer
content then the colors and intensities will be wrong everywhere. The steeper
the Intensity Scale the greater the image contrast and the higher the
saturation of displayed color mixtures. If you want to see accurate image
contrast and color balance then the display must match the standard Intensity
Scale that was used when creating the content, which is a mathematical
power-law with a Gamma exponent of 2.2. See Figure 3 above and this Link for an
explanation of the Figure and the Intensity Scale.
OLED TV
Test Result: The
measured Intensity Scales for the indicated Picture modes are shown in Figure 3 along with the Standard
Intensity Scale with a Gamma of 2.2, which is the straight black line in the
log-log graph. The measured Gammas for the Picture modes are: 2.18 for THX
Cinema, 2.24 for ISF Expert, and 2.19 for the Standard mode. All are very close
to the Standard Gamma of 2.2 and are effectively indistinguishable from
perfect.
Color Tracking Accuracy
The
independent Red, Green and Blue primaries on all displays need to be accurately
adjusted during calibration so that all three are exactly in balance for all
brightness and signal levels, otherwise images will show noticeable color
imbalance errors that produce visible color tinting and color casts. The degree
of imbalance is called a Color Tracking Error. As mentioned above, the White
sub-pixels guarantee that there is no such error in the Gray Scale. We did an
additional series of tests that examine the color balance and tracking between
all possible combinations of the primaries: red-green, red-blue, and
blue-green. This is a much more revealing and sensitive test than the
traditional Gray Scale tracking.
OLED TV
Test Result: The
average Color Tracking Error all the way down to 3% of Peak Luminance is just
1.1 JNCD, which means the Color Tracking Accuracy is visually indistinguishable
from perfect.
Changes with Viewing Positions and Viewing Angles
The best place to
watch any display is with the viewer sitting directly in front of the center of
the screen at eye height – which is called the “sweet spot” and only one person
can be there. Other viewers may see a slight to substantial degradation depending
on how far away they are from the sweet spot. All displays show some variation
in Brightness, Black Level, Contrast Ratio, Intensity Scale, Gamma, White
Point, Color Gamut, and Color Shifts with Viewing Angle. At 30 degrees Viewing
Angle, LCDs typically show a 60 percent decrease in Brightness, a 50% decrease
in Contrast Ratio, a significant change in the Intensity Scale and Gamma.
Plasmas and IPS LCDs show small color shifts with Viewing Angle but many other
LCD technologies show large color shifts of 10 JNCD or more at 30 degrees.
OLED TV
Test Result: At
30 degrees Viewing Angle the Brightness decreased by only 1%, the Black Level
was still zero, the Contrast Ratio still Infinite, the Intensity Scale and
Gamma were effectively unchanged, the White Point changed by 2.3 JNCD, the
Color Gamut changed by only 0.5%, and the Reference Colors shifted by an
average of 1.7 JNCD. So there is no visually detectable variation in picture
accuracy for typical TV watching Viewing Angles up through at least ±30 degrees.
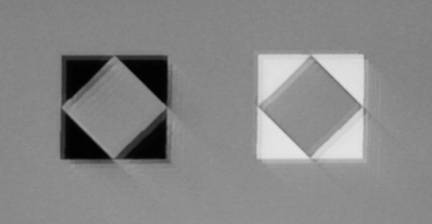
Response Time and Motion Blur
Motion
Blur is a well known issue with LCDs. It arises because the liquid crystal,
which is the active element within an LCD, is unable to change its orientation
and transmission rapidly enough when the picture changes from one frame to the
next. OLEDs, as solid state emissive devices, have very fast Response Times: LG
specs the OLED Response Time at 0.1ms, which is more than a factor of 10 faster
than LCDs. For a simple test of Motion Blur we photographed a DisplayMate Test Pattern
moving at a very fast 1352 pixels per second using a Nikon DSLR camera with a
shutter speed of 1/250th second, which is less than the display’s 120 Hz
refresh cycle time. Figure 4 has a screen shot for the OLED TV and a similar
screen shot for an LCD TV from a 2011 study. Both TVs have a 120 Hz Refresh
Rate. On the LCD TV screen shot it is possible to make out latent images from
more than 5 prior refresh cycles. The OLED TV screen shot shows a single sharp
image. See our LCD Response
Time and Motion Blur article for more details.
OLED TV
Test Result: The
OLED screen shot shows no visible Motion Blur or latent images from any
previous refresh cycles, so the Response Time is visually indistinguishable
from zero with no visible display based Motion Blur.
|

|
|
|
Figure 4a. OLED TV Motion Blur
Screen Shot
1352 Pixels Per Second Motion 1/250th Sec Photo
|
Figure 4b. LCD TV Motion Blur
Screen Shot
1352 Pixels Per Second Motion 1/250th Sec Photo
|
Stuck or
Dead Pixels
With
millions of sub-pixels on the screen, it’s not unusual for displays to have
some stuck or dead sub-pixels that remain permanently On or permanently Off. Our
particular OLED TV has zero stuck or dead sub-pixels, which is impressive.
Playing Sherlock Holmes with test patterns and a magnifier we were able to find
two somewhat hyperactive white sub-pixels that were too bright at very dark
gray levels but otherwise fine for black or brighter intensities. Under normal
viewing conditions they are not visible.
OLED TV
Test Result: All
sub-pixels are visually indistinguishable from perfect.
Screen Saver
One interesting feature of
the LG OLED TV is its subtle screen saver. When it detects an image that
remains unchanged for over a minute, it begins to slowly decrease the
brightness by 10-15% per minute until the Luminance reaches about 75 cd/m2.
This can happen as the result of pressing pause on a Blu-ray player or photo
slide show, or leaving the web browser on a single page. Once the image changes
again (or you click on the remote control) the picture returns back to normal
brightness. This reduces display power and any possible screen aging effects.
Power Consumption
Because it is an emissive
display the power used by the OLED TV depends on the image content. With an
entirely black screen the TV uses only about 50 watts of power. As the Average
Picture Level APL increases and as the Peak Brightness setting increases the
OLED display uses more power. The THX Cinema mode uses the least power because
it has the lowest brightness. For an APL of 20%, which is typical for most TV,
movie and video content, the TV uses 78 watts in the THX Cinema mode. The
Standard and Vivid modes use the most power because they are the brightest
Picture modes. For an APL of 20% they use 185 watts. For the highest APLs the
maximum power we measured was 215 watts (which is a somewhat less than the 300
watts LG specifies).
About the Author
Dr. Raymond Soneira is
President of DisplayMate Technologies Corporation of Amherst, New Hampshire,
which produces video calibration, evaluation, and diagnostic products for
consumers, technicians, and manufacturers. See www.displaymate.com. He is a research
scientist with a career that spans physics, computer science, and television
system design. Dr. Soneira obtained his Ph.D. in Theoretical Physics from
Princeton University, spent 5 years as a Long-Term Member of the world famous
Institute for Advanced Study in Princeton, another 5 years as a Principal
Investigator in the Computer Systems Research Laboratory at AT&T Bell
Laboratories, and has also designed, tested, and installed color television
broadcast equipment for the CBS Television Network Engineering and Development
Department. He has authored over 35 research articles in scientific journals in
physics and computer science, including Scientific American. If you have any
comments or questions about the article, you can contact him at dtso.info@displaymate.com.
DisplayMate Display Optimization Technology
All displays can be
significantly improved using DisplayMate’s advanced scientific analysis and
mathematical display modeling and optimization of the display hardware, factory
calibration, and driver parameters. We help manufacturers with expert display
procurement and quality control so they don’t make mistakes similar to those
that are exposed in our Display Technology Shoot-Out series. We can also
improve the performance of any specified set of display parameters. This
article is a lite version of our intensive scientific analysis – before the
benefits of our DisplayMate
Display Optimization Technology, which can correct or improve all of these
issues. If you are a display or product manufacturer and want to significantly
improve display performance for a competitive advantage then Contact DisplayMate Technologies.
About DisplayMate Technologies
DisplayMate Technologies specializes in proprietary sophisticated
scientific display calibration and mathematical display optimization to deliver
unsurpassed objective performance, picture quality and accuracy for all types
of displays including video and computer monitors, projectors, HDTVs, mobile
displays such as smartphones and tablets, and all display technologies
including LCD, OLED, 3D, LED, LCoS, Plasma, DLP and CRT. This article is a lite version of
our intensive scientific analysis of all types of displays – before the
benefits of our advanced mathematical DisplayMate Display Optimization
Technology, which can correct or improve many of the display deficiencies. We offer DisplayMate display
calibration software for consumers and advanced DisplayMate display diagnostic
and calibration software for technicians and test labs.
For manufacturers we
offer Consulting Services that include advanced Lab testing and evaluations,
confidential Shoot-Outs with competing products, calibration and optimization
for displays, cameras and their User Interface, plus on-site and factory
visits. See our world renown Display
Technology Shoot-Out public article series for an introduction and preview.
DisplayMate’s
advanced scientific optimizations can make lower cost panels look as good or
better than more expensive higher performance displays. For more information on
our technology see the Summary description of our Adaptive Variable Metric Display
Optimizer AVDO. If you are a display or product
manufacturer and want to turn your display into a spectacular one to surpass
your competition then Contact
DisplayMate Technologies to learn more.
Article
Links: Mobile Display Shoot-Out Article
Series Overview and Home Page
Copyright © 1990-2013 by DisplayMate Technologies Corporation. All
Rights Reserved.
This article, or any part thereof, may not be copied,
reproduced, mirrored, distributed or incorporated
into any other work without the prior written permission of
DisplayMate Technologies Corporation