Click for DisplayMate Home Page   The Standard of Excellence for Image and Picture Quality   Click to Order DisplayMate  
  DisplayMate Home PageEnd User ProductsProfessional ProductsSelection GuideOrdering InformationContact Us  
--------------------
Product Information
End User Products
Professional Products  
Complete Productline  

Ordering
Ordering Information
Volume Discounts
Upgrades
Order Online Click to Buy DisplayMate  

General Information
Intro to DisplayMate
Reviews + Awards
Best Video Hardware  

Display Information
DisplayMate on Twitter    
Evaluation Guides
Mobile Displays  
HDTV Displays

Special Information
Printer Calibration
Macs + Linux + Unix
Consulting Services  

Customer Information
Customer Support
Join Our Mailing List
Register Online
Software License
Contact Us

Company Information
About Us
Contact Us

Website
Site Map
Home Page
Legal Terms of Use


Tablet Display Technology Shoot-Out

Apple iPad 2  –  Motorola Xoom  –  Asus Transformer

Acer Iconia  –  Samsung Galaxy Tab


Dr. Raymond M. Soneira

President, DisplayMate Technologies Corporation


Copyright © 1990-2011 by DisplayMate Technologies Corporation. All Rights Reserved.

This article, or any part thereof, may not be copied, reproduced, mirrored, distributed or incorporated

into any other work without the prior written permission of DisplayMate Technologies Corporation


Introduction

Tablets are essentially large portable displays – handheld screens designed for conveniently viewing content and images anywhere you want while untethered. For Tablets the display is the single most expensive and important hardware component because it determines the quality of the visual experience for every application on the Tablet. In this very hot ultra-competitive category an outstanding display is the single best way for manufacturers to make their Tablets stand out from the competition – particularly for Android based devices that have nearly identical OS. On the flip side, cutting corners, costs and quality for the display is a serious mistake because it results in sub-standard image and picture quality for everything that runs on the Tablet.


When these 5 Tablets are viewed together side-by-side, the differences in their displays are blatantly obvious – and they are blatant differences! This is especially true for the Android Tablets because they all have identical 10.1 inch 1280 x 800 screens running virtually identical software. How could there be such a large disparity in a highly competitive market? The price points are all reasonably similar so that is not the primary factor. One major issue is the manufacturers are all scrambling to get their products to market so there isn’t enough time to properly engineer everything. But the biggest factor is undoubtedly the explosive growth in the demand and volume of mobile displays, so many existing and new factories don’t have the time and/or expertise to properly manufacture and calibrate all the displays they are producing.


In all of the Display Technology Shoot-Outs we take display quality very seriously and provide in-depth objective side-by-side comparisons of the displays based on detailed lab measurements and extensive viewing tests. The data and discussions in this review article are drawn from the individual articles for each Tablet in our Display Technology Shoot-Out series starting with the Apple iPad 2, the Motorola Xoom, the Asus Transformer, the Acer Iconia, and the Samsung Galaxy Tab 10.1. We will be regularly adding the best new Tablet contenders – Stay Tuned...


Apple iPad 2

Motorola Xoom

Asus Transformer

Acer Iconia A500

Samsung Galaxy Tab


Results Highlights

In this Results section we provide short comparative Highlights for each Tablet display based on the comprehensive lab measurements and extensive side-by-side visual comparisons using test photos, test images and test patterns that are presented in later sections. We first discuss some Common Issues and Screen Myths, and then make some objective display predictions (and suggestions) for the Next Generation of Tablets including an analysis of several popular rumors. The Comparison Table in the following section summarizes the lab measurements in the following categories:  Screen ReflectionsBrightness and ContrastColors and IntensitiesViewing AnglesDisplay Backlight Power Consumption, and Running Time on Battery.


Common Issues

First: all of these Tablets have large shiny mirror-like screens that are good enough to use for personal grooming. Think of it as one less thing you need to carry – seriously, it’s actually a very bad feature that requires higher screen brightness and more battery power to offset the reflected light, and it also causes eye strain. The larger Tablet screen size makes it harder to position both yourself and the screen to avoid bright reflections. Second: all of these Tablets have a reduced Color Gamut that produces images with less saturated colors. It’s an intentional tradeoff made to increase screen brightness, power efficiency and battery run time. Third: all of these Tablets have a sharp decrease in Brightness and Contrast with Viewing Angle. This is a significant issue only when multiple viewers are watching a Tablet but may also require a single viewer to carefully adjust the Tablet orientation. Fourth: all of these Tablets have an unsatisfactory Ambient Light Sensor and Automatic Brightness Control, which wastes battery power and causes eye strain – see the Recommendations below. Fifth: all of the current 1280x800 Android 3.1 Tablets have only 1280x752 available pixels because 48 pixels are reserved for the system bar with the navigation buttons. Sixth: Android 3.1 continues with a substandard Gallery viewer for photos and images that provides 16-bit color processed up to 24-bits with poorly implemented dithering. It’s about time that gets fixed… Samsung to its credit has fixed this on the Galaxy Tab. Finally:  there was not a single bad pixel on any of the tested units – congratulations to all! But most of the manufacturer warranties state that bad pixels are entirely normal and not a defect, which is not right… Asus is the only manufacturer to offer enclosed documentation with a precise pixel defect policy, but it requires 2 adjacent bad pixels, or up to a total of 8 bad pixels for replacement, which most consumers would find highly objectionable.


Screen Myths

Most people (and reviewers) seem to believe that the 10.1 inch screens (measured diagonally) on the Android Tablets are larger than the 9.7 inch iPad screen – but they are actually 5 percent smaller than the iPad in terms of the image area of the screen, which is what really counts. This is due to both Aspect Ratio geometry (the screen area decreases as the Aspect Ratio increases) and the Android system bar, which reduces the image area.


The shape of the screens are also significantly different: the iPad has an Aspect Ratio of 4:3 = 1.33 (the ratio of width to height) and the Android Tablets all have an Aspect Ratio of 16:10 = 1.60. But because of the Android system bar the Aspect Ratio of the image area is larger, 1.70, which is rather close to the HDTV 16:9 Aspect Ratio of 1.78. So Android Tablets are very well suited for watching widescreen video in Landscape mode. However, they are generally considered too narrow to be very useful in Portrait mode. On the other hand, the iPad does not have a widescreen, but instead an Aspect Ratio very close to standard 8.5 x 11 inch paper, so it is naturally very good for reading lots of content in Portrait mode. In many cases it is also better for reading content in Landscape mode because the iPad’s image height is 5.8 inches while the Android Tablets have an image height of only 5.0 inches, so you can see more on the iPad before needing to scroll. On the other hand, for watching 16:9 widescreen videos, the iPad image height is only 4.4 inches, which is smaller than the Android height of 4.8 inches for 16:9 widescreen videos. So the best screen shape depends on your intended mix of applications.


Tablet Highlights

For details and in-depth analysis see the Comparison Table below.


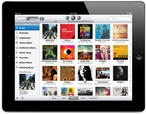
Apple iPad 2  Highlights

The iPad 2 has an excellent display, virtually identical in performance to the impressive iPhone 4 Retina Display, with a somewhat higher pixel resolution but a much lower pixel density of 132 ppi due to its much larger screen size. The iPad 2 IPS LCD display is fairly well calibrated and delivers bright images with excellent contrast, reasonably accurate colors and very good Viewing Angle performance with small color shifts but a large decrease in Brightness, which is the case even for the best LCDs. A major shortcoming is a reduced Color Gamut, but the iPad 2 improves on-screen image color saturation by steepening its intensity scale – a simple trick that is also used by the Galaxy Tab, but the other displays fail to implement this (and the Motorola Xoom does the reverse).


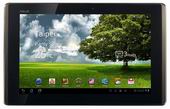
Asus Transformer  Highlights

The Asus Transformer also has an IPS LCD like the iPad 2. It’s not as bright or as well calibrated as the iPad 2 but it still delivers very good performance including very good contrast, reasonably accurate colors and very good Viewing Angle performance like the iPad 2. But the Transformer screen reflects 66 percent more ambient light than the iPad 2. It has an 18-bit color display, but produces 24-bit color by using dithering (except in the Android Gallery viewer where there is 16-bit color with dithering as discussed above).


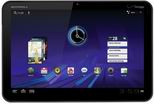
Motorola Xoom  Highlights

The display on the Motorola Xoom is a lower performance LCD than on the other Tablets, compounded by poor factory calibration. Colors and color saturation were much worse than the other displays, and the variation with Viewing Angle is awful. The Xoom screen reflects 49 percent more ambient light reflectance than the iPad 2. The Xoom also has a Dynamic Backlight that varies the screen brightness in a peculiar fashion – it slowly dims the screen based on the Average Picture Level down to about 60 percent and then just stops. It makes dim images dimmer – it’s counterproductive and just strange display behavior… All of the other Tablet displays have standard Backlights, which don’t vary the brightness with picture content (the Galaxy Tab makes it an option).


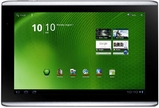
Acer Iconia  Highlights

The Acer Iconia A500 also has a lower performance LCD like the Motorola Xoom, but it’s better in a few decisive categories and is much better calibrated. Of particular noteworthiness, it was the definitive leader in Contrast Ratio, with more than double that of any other tested Tablet because of its very dark black. We triple checked this with some special DisplayMate test pattern measurements to make sure that it wasn’t due to a Dynamic Backlight. But it really has a true very dark black, which is quite noticeable in a dark room. Unfortunately the black brightness increases rapidly with Viewing Angle. The Iconia also had a nicely calibrated intensity scale, but it would actually have been better off with a steeper intensity scale in order to increase color saturation in the same fashion as the iPad 2 and Galaxy Tab.


Samsung Galaxy Tab 10.1  Highlights

The Galaxy Tab display has a PLS (Plane to Line Switching) LCD, which is Samsung’s version of IPS, and it performs comparably to IPS – sometimes a bit better and sometimes not. It’s an impressive mobile display with a lot better standout performance than all of the other Android Tablets – except in one very important category… If you like to watch your HDTV with the Color Saturation control set to maximum then you will be right at home with the Galaxy Tab because Samsung has turned the color obnoxiously high with no way to lower it (see below). It’s tolerable for images that don’t have much color to begin with, but it hurts to look at images that have strong color content. Moderation rather than the sledge hammer approach to color would have resulted in an outstanding display. This could be fixed easily with a software update by adding a color picture control that lets users adjust the color to their liking – see our Third to Fifth Recommendations below.


And the Winner is…

While the iPad 2 display easily outperformed all of the previous Android Tablets, with the new Galaxy Tab 10.1, Samsung has delivered the first Android Tablet with an impressive, potentially outstanding display, but then ruined it by turning up the color level to obnoxious levels – apparently in an effort to overcompensate and blatantly standout from the other mobile LCD displays that have subdued color. But in the case of color, too little is a lot better than too much… As a result the iPad 2 still delivers the best color picture quality and accuracy of all of the Tablets, even though its colors are somewhat subdued. As things stand, based on all of the display tests, the iPad 2 and Galaxy Tab 10.1 are reasonably close in performance in most categories, so it’s almost a tie, but the Galaxy Tab is ahead more often than the iPad 2, so the Galaxy Tab is the Winner, by a nose… But should Samsung or Android add a color picture control to the Galaxy Tab with a software update as we describe below, then the Galaxy Tab would be the decisive Winner, by a lot. Of course, Apple could do the same… What is also impressive is that the iPad 2 is still delivering top display performance close to what many predict is the end of its product cycle, with lots of interesting predictions for the Next Generation, which we discuss and analyze below.


Coming in a solid third place is the Asus Transformer, which delivers very good display performance across the board, all the more impressive because it is $100 less expensive than the iPad 2 and Galaxy Tab, and $200 less than the Motorola Xoom. Next is the Acer Iconia A500, which has a display that is somewhat similar in performance to the last place Motorola Xoom, but is better in a few decisive categories and is much better calibrated. It’s $50 less expensive than the iPad 2 and Galaxy Tab but $50 more than the Asus Transformer. And finally, the Motorola Xoom comes in last place – like the Acer Iconia it’s not a horrible display but definitely significantly below the display quality of the iPad 2, Galaxy Tab, and Asus Transformer. This is all the more surprising because the Xoom is by far the most expensive Tablet, and Motorola previously included an outstanding display in the original Motorola Droid Smartphone, which still delivers the best picture quality of any mobile display we have ever tested – so they once knew how to deliver a great display. This time it seems they just settled for a cheap low-end poorly calibrated display. For details on all of the Tablets see the Comparison Table below.


What’s Coming Next

We will be regularly adding the best new Tablets to this Mobile Display Technology Shoot-Out series – Stay Tuned... We’ll also have a Display Shoot-Out between the Barnes & Noble Color Nook and the Amazon Color Tablet when it launches, plus a series for reflective Tablets with E-Ink, Pixel Qi and Mirasol displays.


The Next Generation of Tablet Displays

First we examine three popular Tablet rumors and then make some predictions that are based on purely objective technical criteria – but note that marketing and other issues are major factors in what will appear in the future generation(s) of Tablets.


Rumors:

There are lots of entertaining rumors regarding the next generation of Tablets and Smartphones – most are made up nonsense based on phony tips. We don’t have any inside information on what’s coming, so here is some purely objective technical analysis of three popular rumors:


First Rumor:  The next generation Tablets will have OLED Organic LED displays. Right now this can be ruled out based on cost and insufficient production volume, especially in the case of the iPad. OLEDs are improving rapidly, but currently they have lower peak brightness and lower power efficiency than LCDs – both of which are very important for Tablets because of their relatively large screens. So, unlikely for the next generation, but undoubtedly coming in the near future…


Second Rumor:  The next generation iPad will quadruple the number of screen pixels with a resolution of 2048x1536. This would undoubtedly be a great marketing move (which is sounding more and more likely) but it’s technically an overkill and comes with a large penalty in cost and performance – requiring significantly more processing power, more memory and battery power, plus lowering the display brightness efficiency. Hopefully display pixels will not follow the same path as the camera Mega Pixel wars – because like them more pixels lowers performance after reaching a certain point. Apple had to double the resolution on the iPhone 3GS because its 480x320 resolution was very low. The iPad is starting with a much higher 1024x768 so Apps hard coded for the iPad 1 and 2 could be rescaled easily by the OS up to the new iPad 3 resolution.


Third Rumor:  An iPad Retina Display – to make the iPad 3 a Retina Display does not require the same pixels per inch (ppi) as the iPhone 4 Retina Display because it is typically held much further away from the eye, whose visual sharpness is based on angular resolution rather than linear ppi resolution. The iPad is typically held 15-18 inches away as opposed to the iPhone 4’s 12-15 inches. As a result, to meet the 300 ppi Retina Display specification made by Steve Jobs at WWDC for the iPhone 4, an iPad Retina Display would need only 240 ppi. So an iPad Retina Display could start anywhere above 1862x1397 pixels. That is still a major overkill that carries a significant performance and cost penalty – so it would be primarily a marketing ploy – but in this very competitive market it is undoubtedly coming sometime soon... See below for our recommendation.


Recommendations:

Here are a few generic recommendations for the next generation(s) of Tablets: There are quite a few things that manufacturers (including Apple) can do to improve their Tablet displays to stay competitive in this extremely competitive category. For advanced and proprietary recommendations and optimizations, manufacturers should contact DisplayMate Technologies.


First Recommendation:  Reduce the Screen Reflectance using an anti-reflection screen coating together with a surface haze layer to cut down on mirror reflections. It will then be necessary to eliminate the air gap between the LCD and cover glass by optically bonding them together. This will significantly improve screen visibility under bright ambient lighting and result in longer battery running time.


Second Recommendation:  Based on the above discussion for an iPad Retina Display, a good technical and marketing compromise for Tablet resolution is 200 ppi. A 1600x1200 9.7 inch iPad display works out to 206 ppi. For the 10.1 inch Android Tablets 1792x1120 works out to 209 ppi. Image sharpness can be considerably enhanced even further with sub-pixel anti-aliasing, but even without it the Tablet displays will appear very sharp at 200 ppi.


Third Recommendation:  The display User Interface on both the iPad and Android Tablets simply has a simple Brightness Control. The display needs a Pizzazz picture control that simultaneously adjusts the color and image contrast based on user visual preferences – similar in concept to the Sound Equalizer for audio found on most mobile devices (but not as complicated). And the external volume controls found on all mobile devices should also allow for easy tweaking of the display brightness.


Fourth Recommendation:  Carefully increase the display Color Gamut and color saturation by managing the light spectrum of the Backlight and the Intensity Scale Gamma.


Fifth Recommendation:  The Ambient Light Sensors and Automatic Brightness Controls on all Smartphones and Tablets are very poorly implemented. That wastes precious battery power and also causes eye strain. They should also be used to adjust the picture control discussed above in order to partially compensate for washed out images under bright ambient lighting. See our BrightnessGate article, which also proposes an improved display User Interface.


DisplayMate Display Optimization Technology

All Tablet and Smartphone displays can be significantly improved using DisplayMate’s advanced scientific analysis and mathematical display modeling and optimization of the display hardware, factory calibration, and driver parameters. We can improve the performance of any specified set of display parameters. This article is a lite version of our intensive scientific analysis – before the benefits of our DisplayMate Display Optimization Technology, which can correct or improve all of these issues. If you are a display or product manufacturer and want to significantly improve display performance for a competitive advantage then Contact DisplayMate Technologies.


Apple iPad 2

Motorola Xoom

Asus Transformer

Acer Iconia A500

Samsung Galaxy Tab

 
Tablet Display Shoot-Out Comparison Table

Below we compare the displays on the Apple iPad 2, Motorola Xoom, Asus Transformer, Acer Iconia A500, and Samsung Galaxy Tab 10.1 based on objective measurement data and criteria.

For details, measurements, in-depth explanations and analysis see the Article Links below for the individual dedicated articles for each device.


Categories

Apple iPad 2

Article Link

Motorola Xoom

Article Link

Asus Transformer

Article Link

Acer Iconia A500

Article Link

Samsung Galaxy Tab

Article Link

Comments

Display Technology

9.7 inch

IPS LCD

10.1 inch

LCD

10.1 inch

IPS LCD

10.1 inch

LCD

10.1 inch

PLS LCD

Liquid Crystal Display

In Plane Switching      Plane to Line Switching

Screen Shape

4:3  =  1.33

Aspect Ratio

16:10 = 1.60

Aspect Ratio

16:10 = 1.60

Aspect Ratio

16:10 = 1.60

Aspect Ratio

16:10 = 1.60

Aspect Ratio

The iPad screen has the same shape as 8.5x11 paper.

Android Tablets have an active screen similar to HDTVs.

OS Version for the Tests

iOS 4.3

Android 3.1

Android 3.1

Android 3.1

Android 3.1

The current OS versions available during testing.

Display Resolution

1024 x 768 pixels

1280 x 800 pixels

1280 x 752 active

1280 x 800 pixels

1280 x 752 active

1280 x 800 pixels

1280 x 752 active

1280 x 800 pixels

1280 x 752 active

The more Pixels and Sub-Pixels the better.

Android 3.1 Tablets reserve 48 pixels for Buttons and Status.

Pixels Per Inch

132 ppi

Good

149 ppi

Good

149 ppi

Good

149 ppi

Good

149 ppi

Good

At 12 inches from the screen 20/20 vision is 286 ppi.

Best human vision is about 20/10 vision or 572 ppi.

See this on the visual acuity for a true Retina Display

Display Color Depth

Full 24-bit color

256 Intensity Levels

No Dithering

Full 24-bit color

256 Intensity Levels

No Dithering

18-bit color

with Dithering

to 24-bit color

18-bit color

with Dithering

to 24-bit color

Full 24-bit color

256 Intensity Levels

No Dithering

24-bit displays produce images with relatively

smooth and artifact free colors and intensities.

Photo Viewer Color Depth

Full 24-bit color

No Dithering

16-bit color

with poor Dithering

to 24-bit color

16-bit color

with poor Dithering

to 24-bit color

16-bit color

with poor Dithering

to 24-bit color

Full 24-bit color

No Dithering

Android 3.1 continues with a poor Gallery viewer that

provides 16-bit color with poorly implemented dithering.

The Galaxy Tab overwrites 16-bit images with 24-bit color.


Apple iPad 2

Motorola Xoom

Asus Transformer

Acer Iconia A500

Samsung Galaxy Tab


Overall Assessments

This section summarizes the results of all of the extensive lab tests and viewing tests performed on all of the Tablets.

For details, measurements, in-depth explanations and analysis see the Links for the individual dedicated articles for each Tablet.

The iPad 2 and Galaxy Tab have the best displays overall. The Asus Transformer was a very good, the Acer Iconia was fair, and the Motorola Xoom was the poorest display.

Viewing Tests

Good Images

Photos and Videos

have too little color

and too much contrast


Small Color Shifts

with Viewing Angle

Subdued Images

Photos and Videos

have too little color

and too little contrast


Large Color Shifts

with Viewing Angle

Good Images

Photos and Videos

have too little color

and good contrast


Small Color Shifts

with Viewing Angle

Subdued Images

Photos and Videos

have too little color

and good contrast


Large Color Shifts

with Viewing Angle

Good Images

Photos and Videos

have too much color

and too much contrast


Small Color Shifts

with Viewing Angle

The Viewing Tests examined the accuracy of

photographic images by comparing the displays

to a calibrated studio monitor and HDTV.


In side-by-side visual comparisons viewers rated the

iPad 2 and Galaxy Tab the Best overall,

the Asus Transformer “Very Good”

the Acer Iconia well below the above,

and the Motorola Xoom the “Worst.”

Suggestions and Conclusions

Suggestions and

Conclusions for

Apple iPad 2

Suggestions and

Conclusions for

Motorola Xoom

Suggestions and

Conclusions for

Asus Transformer

Suggestions and

Conclusions for

Acer Iconia A500

Suggestions and

Conclusions for

Samsung Galaxy Tab

Our Conclusions and Suggestions for improving

each of the displays.

Overall Display Assessment

 Excellent Tablet Display

For Current Generation

Mediocre Display

The Most Expensive

Very Good Display

The Least Expensive

Fair Display

Excellent Tablet Display

For Current Generation

The iPad 2 and Galaxy Tab had the best displays overall.

The Asus Transformer and Acer Iconia were in the middle.

The Motorola Xoom was the poorest display.

Overall Rank and Grade

For the Current Generation

2      A–

5      C

3       B+

4       B–

1      A–

The Samsung Galaxy Tab scored slightly ahead

of the iPad 2 in the test categories.


Apple iPad 2

Motorola Xoom

Asus Transformer

Acer Iconia A500

Samsung Galaxy Tab


Screen Reflections

Figure 1.  Screen Reflection Photos

Click to Enlarge

All of these screens are large mirrors good enough to use for personal grooming – but it’s actually a very bad feature…

We measured the light reflected from all directions and also direct mirror (specular) reflections, which are much more distracting and cause more eye strain.

The 10 – 15 percent reflections can make the screen much harder to read even in moderate ambient light levels, requiring ever higher brightness settings

that waste precious battery power. Hopefully manufacturers will reduce the mirror reflections with anti-reflection coatings and haze surface finishes.

Average Screen Reflection

Light From All Directions

8.7 percent

13.0 percent

14.4 percent

13.5 percent

8.2 percent

Measured using an Integrating Hemisphere.

The Motorola Xoom, Asus Transformer, Acer Iconia reflect

over 50 percent more light than the iPad 2 and Galaxy Tab.

Mirror Reflections

Percentage of Light Reflected

10.8 percent

13.6 percent

15.1 percent

18.2 percent

10.5 percent

These are the most annoying types of reflections.

Measured using a narrow collimated pencil beam of light

reflected off the screen.


Apple iPad 2

Motorola Xoom

Asus Transformer

Acer Iconia A500

Samsung Galaxy Tab


Brightness and Contrast

The Contrast Ratio is the specification that gets the most attention, but it only applies for low ambient light, which is seldom the case for mobile displays.

Much more important is the Contrast Rating, which indicates how easy it is to read the screen under high ambient lighting and depends on both the

Maximum Brightness and the Screen Reflectance. The iPad 2 and Galaxy Tab are the Best overall in Brightness, Contrast Ratio and Contrast Rating for High Ambient Light.

Measured Maximum Brightness

is the Peak Luminance for White

Brightness 410 cd/m2

Excellent

Maximum 408 cd/m2


Dynamic Backlight

reduces it to 257 cd/m2

Brightness 325 cd/m2

Good

Brightness 342 cd/m2

Good

Brightness 464 cd/m2

Excellent

Maximum Brightness is very important for mobile

because of the typically high ambient light levels.


Dynamic Backlight on the Motorola Xoom curiously

reduces brightness with Average Picture Level.

Black Level

at Maximum Brightness

Black is 0.43 cd/m2

Very Good for Mobile

Black is 0.56 cd/m2


Dynamic Backlight

Black is 0.35 cd/m2

Black is 0.42 cd/m2

Very Good for Mobile

Black is 0.18 cd/m2

Excellent for Mobile

Black is 0.51 cd/m2

Very Good for Mobile

Black brightness is important for low ambient light,

which is seldom the case for mobile devices.


Dynamic Backlight also reduces the Black Level.

Contrast Ratio

Relevant for Low Ambient Light

962

Very Good for Mobile

729

Very Good for Mobile

769

Very Good for Mobile

1944

Excellent for Mobile

916

Very Good for Mobile

Only relevant for low ambient light,

which is seldom the case for mobile devices.

Defined as Maximum Brightness / Black Brightness.

Contrast Rating

for High Ambient Light

47

20 - 31

23

25

57

Defined as Maximum Brightness / Average Reflectance.

Screen Readability in Bright Light

Very Good    A–

Good    B–

Good    B–

Good    B–

Very Good    A–

Indicates how easy it is to read the screen

under high ambient lighting. Very Important!


Apple iPad 2

Motorola Xoom

Asus Transformer

Acer Iconia A500

Samsung Galaxy Tab


Colors and Intensities    

Figure 2.  Color Gamuts

Click to Enlarge

Figure 3.  Intensity Scales

Click to Enlarge

Figure 4.  Color Differences

Click to Enlarge

The Color Gamut, Intensity Scale, and White Point determine the quality and accuracy of all displayed images and all the image colors. Bigger is definitely

Not Better because the display needs to match all the standards that were used when the content was produced. For LCDs a wider Color Gamut reduces

the power efficiency and the Intensity Scale affects both image brightness and color mixture accuracy. The Motorola Xoom was the worst performer.

White Color Temperature

6,991 degrees Kelvin

Close to D6500

7,557 degrees Kelvin

White Slightly Too Blue

6,570 degrees Kelvin

Very Close to D6500

7,807 degrees Kelvin

White Slightly Too Blue

8,380 degrees Kelvin

White is Too Blue

D6500 is the standard color of  White for most content

and necessary for accurate color reproduction.

Color Gamut

See Figure 2

Color Gamut Too Small

61 percent of Std

See Figure 2

Color Gamut Too Small

55 percent of Std

See Figure 2

Color Gamut Too Small

56 percent of Std

See Figure 2

Color Gamut Too Small

55 percent of Std

See Figure 2

Color Gamut Too Small

64 percent of Std

See Figure 2

sRGB / Rec.709 is the color standard for most

content and needed for accurate color reproduction.

Note that Too Large is visually worse than Too Small.

Picture Color Saturation

Saturation Too Low

Subdued Colors

Saturation Too  Low

Weak Colors

Saturation Too Low

Subdued Colors

Saturation Too  Low

Weak Colors

Saturation Too High

Colors Too Strong

Picture Color Saturation depends on Both the

Color Gamut and the Intensity Scale Gamma.

Intensity Scale and Image Contrast

See Figure 3

Good

Contrast Too High

Contrast Irregular

Typically Too Low

Good

Contrast Varies

Very Good

Except Near the Peak

Good

Contrast Too High

The Intensity Scale controls image contrast needed

for accurate image reproduction. See Figure 3

Gamma for the Intensity Scale

Larger means more Image Contrast

See Figure 3

Good 2.66

Gamma Too High

Poor 1.68  –  2.43

Gamma Very Irregular

Good 2.10  –  2.23

Gamma a Bit Irregular

Very Good  2.25

Close to Standard

Except Near the Peak

Good 2.32  –  2.77

Gamma Too High

Systematically Increases

Gamma is the slope of the Intensity Scale.

Gamma of 2.2 is the standard and needed for

accurate image reproduction. See Figure 3


Apple iPad 2

Motorola Xoom

Asus Transformer

Acer Iconia A500

Samsung Galaxy Tab


Viewing Angles

The variation of Brightness, Contrast, and Color with viewing angle is especially important for Tablets because of their large screen and multiple viewers.

The typical manufacturer 176+ degree specification for LCD Viewing Angle is nonsense because that is where the Contrast Ratio falls to a miniscule 10.

For most LCDs there are substantial degradations at less than ±30 degrees, which is a small angle. The Motorola Xoom was the worst performer.

Brightness Decrease

at a 30 degree Viewing Angle

58 percent Decrease

Falls to 171 cd/m2


Very Large Decrease

52 percent Decrease

Falls to 196 cd/m2


Dynamic Backlight

Falls to 124 cd/m2


Very Large Decrease

58 percent Decrease

Falls to 135 cd/m2


Very Large Decrease

57 percent Decrease

Falls to 146 cd/m2


Very Large Decrease

52 percent Decrease

Falls to 224 cd/m2


Very Large Decrease

Screens become less bright when tilted.

LCD brightness variation is generally very large.

Contrast Ratio

at a 30 degree Viewing Angle

564

Very Good for Mobile

105

Poor - Very Low

438

Good for Mobile

286

Poor - Fairly Low

518

Very Good for Mobile

A measure of screen readability when the screen

is tilted under low ambient lighting.

Primary Color Shifts

at a 30 degree Viewing Angle

Small Color Shift

Δ(u’v’) = 0.0100

2.5 times JNCD

Small Color Shift

Δ(u’v’) = 0.0124

3.1 times JNCD

Small Color Shift

Δ(u’v’) = 0.0110

2.8 times JNCD

Small Color Shift

Δ(u’v’) = 0.0097

2.4 times JNCD

Small Color Shift

Δ(u’v’) = 0.0048

1.2 times JNCD

JNCD is a Just Noticeable Color Difference.

IPS and PLS LCDs have smaller color shifts with angle.

Color Shifts for Color Mixtures

at a 30 degree Viewing Angle

Reference Brown (255, 128, 0)

Small Color Shift

Δ(u’v’) = 0.0047

1.2 times JNCD

Large Color Shift

Δ(u’v’) = 0.0435

11 times JNCD

Small Color Shift

Δ(u’v’) = 0.0056

1.4 times JNCD

Large Color Shift

Δ(u’v’) = 0.0317

8 times JNCD

Small Color Shift

Δ(u’v’) = 0.0034

0.8 times JNCD

JNCD is a Just Noticeable Color Difference.


Reference Brown is a good indicator of color shifts with

angle because of unequal drive levels and roughly equal

luminance contributions from Red and Green.


Apple iPad 2

Motorola Xoom

Asus Transformer

Acer Iconia A500

Samsung Galaxy Tab


Display Backlight Power Consumption

Figure 5.  LED Backlight Spectra

Click to Enlarge


The power used by the Backlights at Maximum Brightness accounts on average for 51 percent of the total Tablet power. Since the displays have different

screen sizes and maximum brightness the values were also scaled to the same screen brightness and screen area in order to compare their relative power

efficiencies. Although not a big surprise it was nice to see that all except the Galaxy Tab had similar power efficiencies from their LCD optics and LED backlights.

The relatively high power usage of the Galaxy Tab Backlight was consistent with its much shorter running time compared to the other Tablets, especially the iPad 2.

Display Backlight Power

at Maximum Brightness

2.7 watts

2.6 watts

2.1 watts

2.6 watts

4.7 watts

Lower power consumption is important for energy

efficiency and improving running time on battery.

Display Backlight Power Efficiency

same Peak Luminance 325 cd/m2

same 10.1 inch screen size area

2.2 watts

2.1 watts

2.1 watts

2.5 watts

3.3 watts

This compares the Relative Power Efficiency

by looking at the same screen brightness and screen area.


Apple iPad 2

Motorola Xoom

Asus Transformer

Acer Iconia A500

Samsung Galaxy Tab


Running Time on Battery

The running time on battery was determined with the Brightness sliders set for maximum, middle and minimum brightness with the Tablet in Airplane Mode

with no running applications and with Auto Brightness turned off. Note that Auto Brightness can have a considerable impact on running time but we found

abysmal performance for both the iPhone and Android Smartphones in our BrightnessGate analysis of Ambient Light Sensors and Automatic Brightness.

The Samsung Galaxy Tab has the largest capacity battery, 7000 mAh, but the shortest running times, which is consistent with the power measurements.

Running Time

At Maximum Brightness Setting

7.2 hours

6.1 hours

5.9 hours

6.0 hours

4.8 hours

Display always On at the Maximum setting with

Airplane Mode and no running applications.

Running Time

At Middle Brightness Slider Setting

11.8 hours

8.7 hours

9.0 hours

8.3 hours

6.6 hours

Display always On at the Middle slider setting with

Airplane Mode and no running applications.

Running Time

At Minimum Brightness Setting

19.8 hours

NA

11.1 hours

NA

NA

Display always On at the Minimum setting with

Airplane Mode and no running applications.

Categories

Apple iPad 2

Article Link

Motorola Xoom

Article Link

Asus Transformer

Article Link

Acer Iconia A500

Article Link

Samsung Galaxy Tab

Article Link

Comments


About the Author

Dr. Raymond Soneira is President of DisplayMate Technologies Corporation of Amherst, New Hampshire, which produces video calibration, evaluation, and diagnostic products for consumers, technicians, and manufacturers. See www.displaymate.com. He is a research scientist with a career that spans physics, computer science, and television system design. Dr. Soneira obtained his Ph.D. in Theoretical Physics from Princeton University, spent 5 years as a Long-Term Member of the world famous Institute for Advanced Study in Princeton, another 5 years as a Principal Investigator in the Computer Systems Research Laboratory at AT&T Bell Laboratories, and has also designed, tested, and installed color television broadcast equipment for the CBS Television Network Engineering and Development Department. He has authored over 35 research articles in scientific journals in physics and computer science, including Scientific American. If you have any comments or questions about the article, you can contact him at dtso.info@displaymate.com.


About DisplayMate Technologies

DisplayMate Technologies specializes in advanced mathematical display technology optimizations and precision analytical scientific display diagnostics and calibrations to deliver outstanding image and picture quality and accuracy – while increasing the effective visual Contrast Ratio of the display and producing a higher calibrated brightness than is achievable with traditional calibration methods. This also decreases display power requirements and increases the battery run time in mobile displays. This article is a lite version of our intensive scientific analysis of smartphone and mobile displays – before the benefits of our advanced mathematical DisplayMate Display Optimization Technology, which can correct or improve many of the deficiencies – including higher calibrated brightness, power efficiency, effective screen contrast, picture quality and color and gray scale accuracy under both bright and dim ambient light, and much more. Our advanced scientific optimizations can make lower cost panels look as good or better than more expensive higher performance displays. For more information on our technology see the Summary description of our Adaptive Variable Metric Display Optimizer AVDO. If you are a display or product manufacturer and want our expertise and technology to turn your display into a spectacular one to surpass your competition then Contact DisplayMate Technologies to learn more.


Article Links:  Apple iPad 2 LCD Display

Article Links:  Motorola Xoom LCD Display

Article Links:  Asus Eee Pad Transformer LCD Display

Article Links:  Acer Iconia A500 LCD Display

Article Links:  Samsung Galaxy Tab 10.1 LCD Display


Article Links:  Smartphone "Super" LCD-OLED Display Technology Shoot-Out

Article Links:  Smartphone Automatic Brightness Controls and Light Sensors are Useless


Article Links:  Mobile Display Shoot-Out Article Series Overview and Home Page

Article Links:  Display Technology Shoot-Out Article Series Overview and Home Page


Copyright © 1990-2011 by DisplayMate Technologies Corporation. All Rights Reserved.

This article, or any part thereof, may not be copied, reproduced, mirrored, distributed or incorporated

into any other work without the prior written permission of DisplayMate Technologies Corporation


--------------------
Copyright © 1990-2011 by DisplayMate® Technologies Corporation. All Rights Reserved.
Click here for Copyright, Trademark, Warranty Information and Legal Terms of Use

Screen Resolution: This site best viewed at a resolution format of 1024x768 or 1280x1024 pixels.
Printing: If your browser is improperly printing some pages with text cutoff on the right edge then print in
Landscape mode or reduce the font size (View Menu - Text Size) and margins (File Menu - Page Setup).