Motorola Xoom Tablet Display Shoot-Out
Dr. Raymond M. Soneira
President, DisplayMate Technologies Corporation
Copyright © 1990-2011 by DisplayMate
Technologies Corporation. All Rights Reserved.
This article, or any part
thereof, may not be copied, reproduced, mirrored, distributed or incorporated
into any other work without
the prior written permission of DisplayMate Technologies Corporation
Series
Overview
This is part of a
comprehensive article series with in-depth measurements and analysis for the
LCD and OLED displays in state-of-the art Smartphones and Tablets. We will
show you the good, the bad, and also the ugly unfinished rough edges and
problems lurking below the surface of each of these displays and display
technologies, and then demonstrate how the displays can be improved by using
images that have been mathematically processed to correct color and imaging
errors on Tablets and Smartphones so you can compare them to the originals.
|
|
Introduction
A key element in the success of all Smartphones and Tablets is
the quality and performance of their display. There have been lots of articles
comparing various smartphone LCD and OLED displays and technologies, but
almost all simply deliver imprecise off-the-cuff remarks like “the display
is gorgeous” with very little in the way of serious attempts at objective
or accurate display performance evaluations and comparisons – and many just
restate manufacturer claims and provide inaccurate information, performance
evaluations and conclusions. This article objectively evaluates the display
performance of the Motorola Xoom LCD Tablet Display based on extensive
scientific lab measurements together with extensive side-by-side visual
tests.
The Motorola Xoom has an ordinary LCD display with a
White LED backlight – unlike the Apple iPad and Asus Transformer, which
have high Performance IPS LCDs. The screen is 10.1 inches diagonally and
has a high-resolution 1280x800 pixel display with a screen Aspect Ratio of
1.60, which is significantly larger than the iPad 2, which has an Aspect
Ratio of 1.33, but less than a widescreen HDTV, which has an Aspect Ratio
of 1.78.
The
inner details of the display technologies are very interesting, but our
concern here is to evaluate the actual image and picture quality that they
deliver, so we don’t really care how they do it, as long as they do it
well. None-the-less with the measurements and analytical test patterns we
will learn quite a bit about how they work.
|
|
FIGURE 1
Figure 1. Revealing Screen Shots for
the Motorola Xoom.
|

Motorola Xoom: Intensity Scale Ramps
|
Motorola Xoom:
NASA Photo - Sunset on Mars
|
Figure 1. Revealing Screen Shots for
the Motorola Xoom.
The test patterns and photos are 24-bit color
bitmaps at the native resolution of each display.
Results and Conclusions
The Motorola Xoom display
was evaluated by downloading 24-bit native resolution 1280x752 test patterns
and 24-bit HD resolution test photos to the tablet. Note that while the LCD
screen has 1280x800 pixels only 1280x752 are available for applications because
48 pixels are reserved for the Android 3.1 system bar with the navigation buttons.
Note that we are testing and evaluating the display on the Motorola Xoom with
whatever hardware, firmware, OS and software are provided by Motorola and
Google Android.
Color
Depth and Granularity: 24-bit Color but Dithered 16-bits in the Android Gallery Photo
Viewer
While the Xoom has a 24-bit
color display the Android Gallery photo viewer and most Apps on the Tablet
deliver only 16-bit color processed up to 24-bits with poorly implemented
dithering. It’s about time that gets fixed… The Android Browser does however
deliver 24-bit color for images from the web. Figure 1 shows screen shots from
the Android Gallery.
Display
Image Quality, Colors and Artifacts: Relatively Poor
The image and picture quality on the Xoom was relatively
poor. Images had too little contrast, not enough color saturation, and degraded
significantly with Viewing Angle. Image and picture quality was significantly
below the display quality of the iPad 2 and Asus Transformer.
The Measurements with Explanations and
Interpretations:
The Measurements section
below has details of all of the lab measurements and tests with lots of
additional background information and explanations including the display’s
Maximum Brightness and Peak Luminance, Black Brightness, Contrast Ratio, Screen
Reflectance, Bright Ambient Light Contrast Rating, Dynamic Color and Contrast,
Color Temperature and White Chromaticity, Color Gamut, Intensity Scale and
Gamma, the variation of Brightness, Contrast Ratio and Color Shift with Viewing
Angle, Backlight Power Consumption, and Light Spectrum of the display.
The
Viewing Tests: Too Little Contrast and Not Enough Color Saturation
We compared the Motorola Xoom side-by-side to the other
Tablets and to a calibrated Professional Sony High Definition Studio Monitor
using a large set of DisplayMate Calibration and Test Photographs. All of the
photos on the Xoom had too little contrast and not enough color saturation and
were significantly below the picture quality of the iPad 2 and Asus
Transformer.
Factory
Calibration and Quality Control: Poor
The
overall factory calibration and quality control for the Xoom display are poor.
It has a very irregular Intensity Scale and Gamma that reduces image contrast
and color saturation. It also has a White Point that is too blue.
Suggestions for Motorola:
The
Xoom has an across the board mediocre display, which is unacceptable for such
an expensive Tablet. The original Motorola Droid
Smartphone came with an outstanding IPS LCD. For the next generation Xoom
we suggest you get back in touch with the design team that was responsible for
that Droid display. Then have them read the Suggestions for the Apple iPad 2
and Asus Transformer…
This
article is a lite version of our intensive scientific analysis of smartphone
and mobile displays – before the benefits of our advanced mathematical DisplayMate Display Optimization
Technology, which can correct or improve many of the deficiencies –
including higher calibrated brightness, power efficiency, effective screen
contrast, picture quality and color and gray scale accuracy under both bright
and dim ambient light, and much more. If you are a
manufacturer and want our expertise and technology to turn your display into a
spectacular one to surpass your competition then Contact DisplayMate Technologies
to learn more.
Motorola Xoom
Conclusion: A Mediocre Tablet Display
The display on the Motorola Xoom is a lower performance
LCD than on the other Tablets, compounded by poor factory calibration,
relatively high screen reflectance and poor Viewing Angle performance. It’s not
a horrible display but definitely significantly below the display quality of
the iPad 2 and Asus Transformer. This is all the more surprising because the
Xoom is by far the most expensive Tablet, and Motorola previously included an
outstanding display in the original Motorola Droid Smartphone – so they once
knew how to deliver a great display. This time it seems they just settled for a
cheap low-end poorly calibrated display. Hopefully the next generation Motorola
Xoom will perform more like the display on the Motorola Droid…
The Measurements with Explanations and Interpretations
This
section explains all of the measurements incorporated in the article. The
display was evaluated by downloading 24-bit native resolution 1280x752 test
patterns and 24-bit HD resolution test photos to the Motorola Xoom. Note that
while the LCD screen has 1280x800 pixels only 1280x752 are available for
applications because 48 pixels are reserved for the Android 3.1 system bar with
the navigation buttons. Note that we are testing and evaluating the display on
the Motorola Xoom with whatever hardware, firmware, OS and software are
provided by Motorola and Google Android. All measurements were made using DisplayMate Multimedia Edition
for Mobile Displays to generate the analytical test patterns together with
a Konica
Minolta CS-200 ChromaMeter, which is a Spectroradiometer. All measurements
were made in a perfectly dark lab to avoid light contamination. All devices
were tested with their Backlight set for maximum brightness with the Automatic
Brightness light sensor control turned off, and running on their AC power
adapter with a fully charged battery, so that the battery performance and state
was not a factor in the results. For further in-depth discussions and
explanations of the tests, measurements, and their interpretation refer to
earlier articles in the DisplayMate
Multimedia Display Technology Shoot-Out article series and the DisplayMate Mobile Display
Shoot-Out article series.
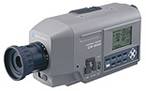
Konica Minolta CS-200
1. Peak Brightness: 257 to 408 cd/m2
– Good for a Mobile Display
This is the maximum brightness that the display
can produce, called the Peak White Luminance. 408 cd/m2 is about as
bright as you’ll find on any current mobile display. Unfortunately, the Dynamic
Backlight reduces this down to 257 cd/m2 for dimmer images that have
a reduced Average Picture Level. The higher 408 cd/m2 level is fine
for just about everything except direct sunlight, although it may be too bright
for comfortable viewing under dim ambient lighting. On the other hand, 257 cd/m2
is relatively low, which will make the dimmer low APL images even harder
to see.
2. Black Level Brightness: 0.35 to 0.56 cd/m2
– Very Good for a Mobile Display
The Black Level is the
closest approximation to true black that the display can produce. Almost all
displays wind up producing a visible dark gray on-screen instead of true black.
This is a major problem for LCDs. The glow reduces image contrast and screen
readability and can be distracting or even annoying in dark environments. It
ruins the dark end of the display’s intensity/gray scale and washes out colors
in the image. But note that in bright ambient lighting the Black Level is
irrelevant because reflections off the screen dominate the screen background brightness.
The Xoom’s value of 0.35 to 0.56 cd/m2 is reasonably dark for a
mobile display in typical ambient lighting. Note that if you decrease the
screen Brightness with the (Backlight) Brightness Control, the Black Brightness
will also decrease proportionally by the same amount, so in dimmer ambient
lighting the Black Brightness can be reduced significantly if desired.
3. Contrast Ratio – Only Relevant for Low
Ambient Light:
729 –
Very Good for Mobile
The Contrast Ratio is a
measure of the full range of brightness that the display is capable of
producing. It is the ratio of Peak Brightness to Black Level Brightness. The
larger the Contrast Ratio the better, but it is only relevant for low ambient
lighting because reflections off the screen dominate the display’s Black Level
in bright ambient lighting. The very best LCDs now have (true) Contrast Ratios
of 1,500 to 2,000 so the 729 value for the Xoom is very good in a mobile
device. Don’t confuse the true Contrast Ratio with the tremendously inflated values
that are published by many manufacturers.
4. Screen Reflectance of Ambient Light: 13.0 Percent
– Relatively High
The often overlooked
Screen Reflectance is actually the most important parameter for a mobile
display, even more important than Peak Brightness. This is especially true for
the large 10.1 inch Xoom display. The screen reflects a certain percentage of
the surrounding ambient light, which adds to the screen background, washes out
the image, and makes it harder to see what is on the screen. In high ambient
lighting the Screen Reflectance can significantly reduce the visibility and
readability of screen content. The lower the Screen Reflectance the better. The
value for the Xoom is among the higher values we have measured for mobile
devices, and is approximately 50 percent higher than the iPad 2. Lowering the
Screen Reflectance increases the cost of a display, but it’s the easiest and
best way to improve screen readability under bright ambient light. The Screen
Reflectance measurements were done in accordance with VESA FPDM 308-1,
Reflectance with Diffuse Illumination, using an integrating hemispherical dome
and a calibrated diffuse white reflectance standard.
5. Bright Ambient Light
Contrast Rating: 20 to
31 – Good
In the same way that the
Contrast Ratio measures the screen contrast under low ambient lighting, the
Bright Contrast Rating specifies the relative screen contrast under high
ambient lighting. It is the ratio of Peak Brightness to Screen Reflectance. The
higher the value the better you’ll be able to see what’s on the screen when you
are in a bright location. The Contrast Rating for the Xoom varies from 20 to 31
due to the Dynamic Backlight. The low end of the range is poor and the high-end
is good. For all mobile devices the High Ambient Light Contrast Rating is much
more important than the Contrast Ratio.
6. Dynamic Backlight,
Dynamic Color and Dynamic Contrast: Yes – Which is Bad
Some displays dynamically adjust the Backlight
and/or color, gray scale and contrast on every image that is displayed using an
internal automatic image processing algorithm. It’s done for a variety of
reasons, but they all wind up reducing picture accuracy and introducing
artifacts.
The Xoom has a Dynamic Backlight that reduces
the screen brightness for dimmer images that have a reduced Average Picture
Level. The Dynamic Backlight reduces the Peak Brightness from 408 cd/m2 down
to 257 cd/m2, making dim images dimmer and harder to see. Normally a
Dynamic Backlight is just used to make an all black screen darker, giving the
appearance of a higher Contrast Ratio. But for the Xoom the Peak Brightness is
systematically slowly lowered from 408 cd/m2 down to about 60
percent of Peak and then it just stops and remains constant at 257 cd/m2.
It makes dim images
dimmer and harder to see. It’s counterproductive and just strange display behavior. It
would make more sense to do the reverse…
For Dynamic Color and Contrast the goal is
generally to jazz up and “enhance” the picture by stretching and exaggerating
the colors and intensity scale. It is similar to the Vivid mode found in many
digital cameras and HDTVs. Since it alters and frequently distorts the image it
is better left as an option for people who aren’t concerned with picture
accuracy and fidelity. Since the Dynamic modes are generally triggered by
changes in Average Picture Level, a very simple test for Dynamic Contrast is to
separately measure the brightness of full screen Red, Green and Blue images and
then compare them to White, which should equal their sum. If they don’t agree
then there is Dynamic Color and Contrast processing. For the Xoom, the measured
Luminance for Red=90, Green=246 and Blue=72 cd/m2. Their sum is 408
cd/m2, which is identical to the measured White Luminance, so there
isn’t any Dynamic Color or Contrast, only a Dynamic Backlight.
7. Color Temperature and Chromaticity: 7557 degrees Kelvin –
White is Slightly Too Blue
White is not a single
color but rather falls within a range that is normally specified by a Color
Temperature. For accurate color reproduction of most content, including
photographs, images and web content it needs to be set to the industry standard
D6500, which is how most professional photo and video content is color
balanced. D6500 is the color of natural daylight and is similar to a Black Body
at 6500 degrees Kelvin. The Xoom’s White Point is slightly too Blue compared to
D6500 – see the White Points in Figure 2 below. The measured CIE Chromaticity
Coordinates of the White Point are u’=0.1912 v’=0.4604.
8. Color Gamut:
Much Smaller than the Standard Color Gamut –
Colors are Inaccurate and Under Saturated
The Color Gamut of a
display is the range and set of colors that it can produce. The only way that a
display will deliver good color and gray scale accuracy is if it is accurately
calibrated to an industry standard specification, which for computers, digital
cameras, and HDTVs is sRGB or Rec.709. It’s the standard for most content and
necessary for accurate color reproduction. If the Color Gamut is smaller than
the standard then the image colors will appear too weak and under-saturated. If
the Color Gamut is greater than the standard then the image colors will appear
too strong and over-saturated. The important point here is that a Color Gamut
larger than the standard is also bad, not better. Wider gamuts will not show
you any colors or content that are not in the original images, which are almost
always color balanced for the sRGB / Rec.709 standard. Wider color gamuts
simply distort and decrease color accuracy and should be avoided, except for
some special applications.
Figure 2 shows the
measured Color Gamuts for the Tablets alongside the Standard sRGB / Rec.709
Color Gamut in a CIE 1976 Uniform Chromaticity Diagram. The dots in the center
are the measured White Points for the phones along with the D6500 Standard,
which is marked as a white circle. The outermost curve are the pure spectral
colors and the diagonal line on the bottom right is the line of purples. A
given display can only reproduce the colors that lie inside of the triangle
formed by its primary colors. Highly saturated colors seldom occur in nature so
the colors that are outside of the standard sRGB / Rec.709 triangle are seldom
needed and are unlikely to be noticed or missed in the overwhelming majority of
real images. When a camera or display can’t reproduce a given color it simply
produces the closest most saturated color that it can.
FIGURE 2
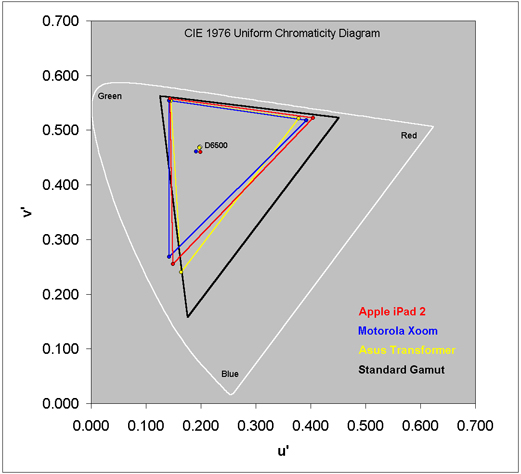
Figure 2. CIE 1976 Uniform
Chromaticity Diagram showing the Color Gamut and White Point for the Motorola
Xoom
The LCD Tablets all perform poorly with reference to the
standard Color Gamut, which is the black triangle in Figure 2. They have much
too small a color Gamut. As a result they produce images that have
significantly too little color saturation. This applies to all external content
viewed on the displays, including web content, such as images, photos and
videos. This was easy to see in the viewing tests where we compared the
displays side-by-side to a calibrated Professional Sony High Definition Studio
Monitor using a large set of DisplayMate Calibration and Test Photographs. On
the LCD Tablets, all of the photos looked somewhat pale, flat, washed-out and
under-saturated, but the Motorola Xoom was the worst of them because it also
has a shallow Intensity Scale that further washes out the appearance of colors.
See below.
9. Intensity Scale, Image Contrast and Gamma: Very Irregular – Poor
The display’s intensity
scale not only controls the contrast within an image but it also controls how
the Red, Green and Blue primary colors mix to produce all of the on-screen
colors. So if it doesn’t obey the industry standard intensity scale then the
colors and intensities will be wrong everywhere on-screen because virtually all
professional content and all digital cameras use the sRGB / Rec.709 standard,
so it’s necessary for accurate image, picture and color reproduction. The
standard intensity scale is not linear but rather follows a mathematical
power-law, so it is a straight line on a log-log graph. Its slope is called
Gamma, which is 2.2 in the standards. In order to deliver accurate color and
intensity scales a display must closely match the standard. Figure 3 shows the
measured (Transfer Function) Intensity Scale for the Tablets alongside the
industry standard Gamma of 2.2, which is a straight line.
FIGURE 3
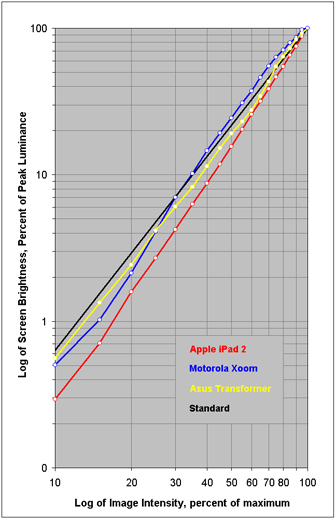
Figure 3. Intensity Scale for the
Motorola Xoom
The Xoom has a very irregular Intensity Scale with
respect to the Standard intensity scale, which is needed in order to accurately
reproduce images and pictures for most content. Gamma is the slope of the
intensity scale, which should be a constant 2.2 like the straight line in
Figure 3. The Gamma for the Xoom ranges wildly between 1.68 and 2.43, among the
worst performers we have ever seen.
10. Brightness Decrease with Viewing Angle: 52 percent Decrease in
30 degrees – Bad, Very Large
A major problem with many displays, especially
LCDs, is that the image changes with the viewing angle, sometimes dramatically.
The Peak Brightness, Black Luminance, Contrast Ratio and color generally change
with viewing angle (see below). Some display technologies are much better than
others. At a moderate 30 degree viewing angle the Peak Brightness of the Xoom
fell by 52 percent to 196 cd/m2, which is an incredibly large
decrease. This behavior is typical for LCDs.
11. Black Level and Contrast Ratio Shift with
Viewing Angle: Very
Large – Poor
At a moderate 30 degree viewing angle the Black
Level Brightness increased considerably to 1.87 cd/m2, and the
Contrast Ratio fell drastically to a very low 105. This is much worse than the
performance of good quality LCDs.
12. Color Shift with Viewing Angle: Awful
Colors generally shift
with viewing angle whenever the brightness shifts with viewing angle because
the Red, Green and Blue sub-pixels each shift independently and vary with
intensity level. At a moderate 30 degree viewing angle the primary colors
shifted by a maximum of Δ(u’v’) = 0.0124, which is 3.1 times the Just
Noticeable Color Difference. A much more challenging test is to use mixtures of
primary colors. Reference Brown (255, 128, 0) is a good indicator of color
shifts with angle because of the unequal drive levels and roughly equal
luminance contributions from Red and Green. For the Reference Brown color mixture
the color shift was Δ(u’v’) = 0.0435, which is 11 times JNCD. These values
are very large and climb drastically for even larger Viewing Angles.
13. RGB Display Power Consumption: Excellent, Relatively
Low
The power consumed by LCD
displays is independent of the brightness and color distribution of the images
– it only depends on the Brightness setting of the backlight that illuminates
the LCD from behind. The Automatic Brightness option allows the ambient light
sensor on the Xoom to adjust the backlight brightness and power setting as the
ambient light changes. This not only improves visual comfort but can also
increase the battery run time. We turned off Automatic Brightness for the
tests. It is possible to indirectly determine the power used by the display by
measuring the AC power used by the Xoom with different backlight settings.
Table 1 lists the Measured
Relative Power, the Measured Luminance, and the Relative Luminous Efficiency,
which is just the Measured Luminance divided by the Measured Relative Power,
and normalized to 1.0 for White, which has the highest total efficiency.
Table 1. Motorola Xoom
LCD Display Power Consumption
|
Maximum Backlight
Full Screen
|
Black
|
Peak Red
|
Peak Green
|
Peak Blue
|
Peak White
|
|
Measured Relative Power
|
2.6 watts
|
2.6 watts
|
2.6 watts
|
2.6 watts
|
2.6 watts
|
|
Measured Luminance
|
0.56 cd/m2
|
90 cd/m2
|
246 cd/m2
|
72 cd/m2
|
408 cd/m2
|
|
Relative Luminous Efficiency
|
0.0014
|
0.22
|
0.60
|
0.18
|
1.00
|
14. OLED and LCD Spectra: Very Interesting
The spectra of an LCD display is just the spectrum
of the backlight filtered through the individual Red, Green and Blue sub-pixel
filters within the panel. OLEDs are emissive devices so their spectra is just
the sum of the individual Red, Green and Blue OLED spectra, modified slightly
by the touchscreen layer and anti-reflection absorption layer through which
their light must pass. We thought it would be very useful and interesting to
compare the spectra of the Galaxy S OLED with the spectra of the LCD Tablets.
The spectra for White, which is the sum of the Red, Green and Blue primaries is
shown in Figure 4 for the iPad 2, Motorola Xoom and Asus Transformer as well as
the Samsung Galaxy S OLED.
FIGURE 4
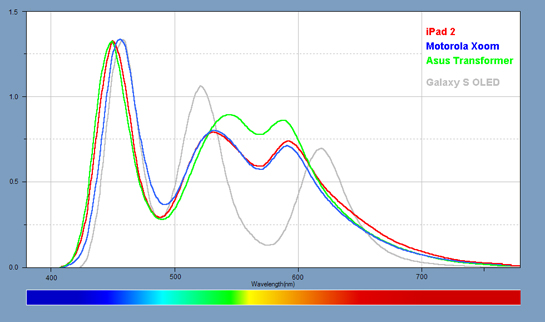
Figure 4. RGB Spectra for the LCD
Tablets and also for the Samsung Galaxy S OLED
As
expected the OLED RGB spectra are relatively narrow because of their high color
saturation. The LCD RGB spectra are a filtered broadband spectrum. The
backlights for the LCD Tablets are white LEDs, which consists of a Blue LED
with a yellow phosphor.
About the Author
Dr. Raymond Soneira is
President of DisplayMate Technologies Corporation of Amherst, New Hampshire,
which produces video calibration, evaluation, and diagnostic products for
consumers, technicians, and manufacturers. See www.displaymate.com. He is a research
scientist with a career that spans physics, computer science, and television
system design. Dr. Soneira obtained his Ph.D. in Theoretical Physics from Princeton
University, spent 5 years as a Long-Term Member of the world famous Institute
for Advanced Study in Princeton, another 5 years as a Principal Investigator in
the Computer Systems Research Laboratory at AT&T Bell Laboratories, and has
also designed, tested, and installed color television broadcast equipment for
the CBS Television Network Engineering and Development Department. He has
authored over 35 research articles in scientific journals in physics and
computer science, including Scientific American. If you have any comments or
questions about the article, you can contact him at dtso.info@displaymate.com.
About DisplayMate Technologies
DisplayMate Technologies
specializes in advanced mathematical display technology optimizations and
precision analytical scientific display diagnostics and calibrations to deliver
outstanding image and picture quality and accuracy – while increasing the
effective visual Contrast Ratio of the display and producing a higher
calibrated brightness than is achievable with traditional calibration methods.
This also decreases display power requirements and increases the battery run
time in mobile displays. This
article is a lite version of our intensive scientific analysis of smartphone
and mobile displays – before the benefits of our advanced mathematical DisplayMate Display Optimization
Technology, which can correct or improve many of the deficiencies –
including higher calibrated brightness, power efficiency, effective screen
contrast, picture quality and color and gray scale accuracy under both bright
and dim ambient light, and much more. Our advanced
scientific optimizations can make lower cost panels look as good or better than
more expensive higher performance displays. For more information on our
technology see the Summary description of our Adaptive Variable Metric Display
Optimizer AVDO. If you are a display or product
manufacturer and want our expertise and technology to turn your display into a
spectacular one to surpass your competition then Contact DisplayMate Technologies
to learn more.
Article Links: Display Technology Shoot-Out
Article Series Overview and Home Page
Copyright © 1990-2011 by DisplayMate
Technologies Corporation. All Rights Reserved.
This article, or any part
thereof, may not be copied, reproduced, mirrored, distributed or incorporated
into any other work without
the prior written permission of DisplayMate Technologies Corporation
