IPS Tablet Display Technology
Shoot-Out
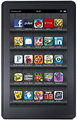
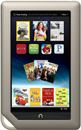
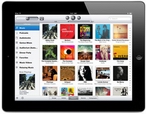
Amazon Kindle Fire – Barnes
& Noble Nook Tablet – Apple iPad 2
Dr. Raymond M. Soneira
President, DisplayMate Technologies Corporation
Copyright © 1990-2011 by DisplayMate
Technologies Corporation. All Rights Reserved.
This article, or any part
thereof, may not be copied, reproduced, mirrored, distributed or incorporated
into any other work without
the prior written permission of DisplayMate Technologies Corporation
Introduction
A new wave of Tablets
has arrived just in time for Christmas… But as we have seen many times before,
most new Tablets are poorly thought out contenders that just wash away with the
next wave. To survive (let alone succeed) in this incredibly competitive
marketplace you had better have a really good “reason de existence.” The
Amazon Kindle and Barnes & Noble Nook series of Tablets clearly fall into
this category because they both started by providing a great reading experience
with excellent E-Ink displays that behave like electronic paper. But these are
pretty much restricted to displaying printed text because of their very limited
imaging and graphics capabilities (black and white, 16 intensity levels, and
very slow speed screen updates).
In order to stay
competitive with the incredibly successful Apple iPad the next logical step was
to offer a color LCD display. Tablets are essentially large portable displays –
so if you are going to offer a product in this area you had better do the
display right! Apple did that from day 1 with the iPad. For Tablets the display
is the single most expensive and important hardware component because it
determines the quality of the visual experience for every application on the
Tablet. In this very hot ultra-competitive category an outstanding display is
the single best way for manufacturers to make their Tablets stand out from the
competition because the display enhances or degrades the appearance of
everything that runs on the Tablet. Cutting corners, costs and quality for the
display is a serious mistake because it results in sub-standard image and
picture quality for everything that runs on the Tablet. Two examples of what not to do are the Motorola Xoom and Acer Iconia,
which had low-end LCD displays and tested poorly in our 10 Inch Tablet Display
Technology Shoot-Out.
Manufacturers now seem
to have gotten this message because many of the latest Tablets are offering
improved IPS LCD displays, the same screen technology that Apple uses in the
iPad and iPhone. It offers wider viewing angles, better image contrast, and
faster response times than the cheaper LCDs used in many products. IPS stands
for In Plane Switching, which has two transistors for every sub-pixel.
It was developed by Hitachi, but LG is now the world’s leading manufacturer of
IPS LCDs, and the principal supplier of displays for the iPhone as well as the
Tablets in this Shoot-Out (but most Tablets have more than one supplier). Other
manufacturers offer similar technologies that are often called IPS displays,
such as Fringe Field Switching by Hydis and Plane Line Switching by
Samsung.
The two new Tablet
stand-outs for this Display Shoot-Out are the Amazon
Kindle Fire and the Barnes & Noble Nook
Tablet. It was nice to hear that they both feature IPS LCD displays like
the iPad. But IPS displays are not all the same and do not perform equally
because, like cars, they are actually complex assemblies that include lots of
options and variables. So we decided to see how these newbies compare with the
grand-daddy of them all – the Apple iPad…
The IPS Display Shoot-Out
To compare the
performance of these IPS displays we ran our in-depth series of Display
Technology Shoot-Out tests on them. We take display quality very seriously and
provide in-depth objective side-by-side comparisons of the displays based on
detailed laboratory measurements and extensive viewing tests with both test
patterns and test images.
The Kindle Fire and
Nook Tablet are competing head-to-head with similar price points, feature sets,
and 7 inch screens. The iPad 2 has a much higher price point, much greater
feature set, and much larger 9.7 inch screen – non-the-less these Tablets are
competing in functionality and particularly for finite consumer dollars. It
remains to be seen whether the Kindle Fire and Nook Tablet grow at the expense
of the iPad, or whether they just expand the market for Tablets. I predict the
latter… Tablets are so useful that there is plenty of room for 7 inch, 10 inch,
and even 12 inch screens – the first for extra portability and the latter for
professional and office applications… and there are lots of people that would
own more than one size based on their varying needs. One of the more credible
rumors flying around is that Apple will introduce a 7-8 inch iPad in 2012. I
hope so…
Results Highlights
In this Results section we provide short comparative
Highlights for each Tablet display based on the comprehensive lab measurements
and extensive side-by-side visual comparisons using test photos, test images
and test patterns that are presented in later sections. The Comparison Table in the following section summarizes the lab
measurements in the following categories: Screen
Reflections, Brightness and Contrast,
Colors and Intensities, Viewing Angles, Display Backlight Power Consumption,
and Running Time on Battery.
Ship Just in Time for Christmas…
One major issue for most Tablets has been that the
manufacturers are all scrambling to get their products to market so there isn’t
enough time to properly engineer everything. It’s clear that this was the case
for both the Kindle Fire and Nook Tablet – ship by Thanksgiving and provide
patches, tweaks and enhancements later. That’s understandable, while both the
Kindle Fire and Nook Tablet are quite functional, they are both going to need
lots of fixes and tweaks. It's possible that the serious display issues we
found for the Kindle Fire will be improved in future software updates.
Apple iPad 2 Highlights
We’ll begin
with the iPad because it’s the standard that all other Tablets are compared to…
The iPad 2 has an excellent display, virtually identical in performance to the
impressive iPhone 4 Retina Display, with a somewhat higher pixel resolution but
a much lower pixel density of 132 ppi due to its much larger screen size. The
iPad 2 IPS LCD display is fairly well calibrated and delivers bright images
with excellent contrast, reasonably accurate colors and very good Viewing Angle
performance with small color shifts but a large decrease in Brightness, which
is the case even for the best LCDs. A major shortcoming is a reduced Color
Gamut, but the iPad 2 improves on-screen image color saturation by steepening
its intensity scale. For more details see the dedicated iPad 2 LCD Display
Shoot-Out.
Amazon Kindle Fire Highlights
In
principle, the LCD on the Kindle Fire is a fairly good display, comparable in
most respects to the Nook Tablet and iPad 2 – but it has two major flaws, and
only one of them is fixable with a software update.
Amazon
advertises that the Kindle Fire has an “anti-reflective treatment” but our lab
tests found it to have among the highest reflectance levels we have ever
measured – it’s 70 percent higher than the iPad 2, and more than double the
reflectance of the Nook Tablet. That may not matter much if you are reading in
bed but it’s likely to be a significant factor indoors and especially outdoors.
It’s also a surprising piece of puffery for Amazon – who’s generally a very
straight shooter…
Another big
disappointment for the Kindle Fire is the Gallery, the native application that
is used for viewing photos and images. First, the gray-scale is way off, and
overdriven so hard that significant picture detail will be lost with bright
images. It’s very similar to what happens with an over-exposed photograph – all
of the bright content appears washed out or even lost all together – see the
screen shots in Figure 4 below. Like the Nook Tablet, the Kindle Fire uses a
version of Android for its OS, but the User Interface on the Kindle Fire is much
closer to vanilla Android – and most of the time it’s much nicer than the
Nook’s own UI. But the Kindle Fire still carries a major flaw in Android that I
pointed out almost 2 years ago with the Nexus One, and
which Google
acknowledged. The Gallery provides only 16-bit color – that’s 65 thousand
colors not the “16 million colors” that Amazon advertises. It also produces noticeable
steps (called false contours) in some images. While the display hardware can do
24-bit color it doesn’t show up on-screen in the Gallery viewer due to the
software design. It’s about time that Amazon and Google fix this… Fortunately,
the Web browser on the Kindle Fire does support full 24-bit color for web
images.
Another display related issue is that the chunky menus in
the Kindle Fire Gallery eat up 100 pixels of the screen, so photos only get 500
of the screen’s 600 vertical pixels. If you display a standard 4:3 digital
camera photo it only fills 54 percent of the screen and a 16:9 photograph only
fills 72 percent of the screen. To fix this the UI needs to be updated so that
the menus disappear after a few seconds the way they do in other parts of the
Kindle Fire UI.
Barnes & Noble Nook Tablet Highlights
The
LCD on the Nook Tablet is also a fairly good display comparable in most respects to the
Kindle Fire – but Barnes & Noble has done a much better job in pulling
everything together into a nice all around display.
Barnes
& Noble advertises that the Nook Tablet has “reduced reflection and glare”
and they have clearly done their homework on this one because it has the lowest
reflectance of any Tablet we have ever tested – the iPad 2 has 28 percent
higher reflectance and the Kindle Fire has more than double that of the Nook
Tablet (lower is better).
The Nook
Tablet also has a very good factory display calibration. Its gray-scale is
actually more accurate than most living room HDTVs. The White Point at 6,016K
degrees is somewhat more yellowish than the 6,500K standard – that was most
likely done in order to increase the screen’s maximum brightness, power
efficiency, and battery run-time.
Like the
Kindle Fire, the Nook Tablet also uses a version of Android for its OS. But
unlike the Kindle Fire the Nook Tablet delivers very smooth and accurate 24-bit
color on-screen, including for its Gallery. Photos and even test patterns are
free of the ugly image artifacts seen on the Kindle Fire. The reason is that
the Nook Tablet doesn’t use the Android Gallery but rather developed its own.
Unfortunately, that has a down side…
Barnes & Noble has developed its own distinct user
interface for the Nook Tablet – the Kindle Fire is much closer to vanilla
Android. Unfortunately, it doesn’t work anywhere near as well and still needs
lots of work. In particular, the User Interface for the Gallery is primitive
and combines all of the photos and videos into one gigantic grid. The only way
to organize photos and videos with Folders is through a cumbersome “My Stuff”
User Interface that is buggy as well. We use hundreds of test patterns, test
images, test photos and videos for the Shoot-Out, so dealing with this problem
UI was a major ordeal. User Interfaces are hard to get right… Hopefully Barnes
& Noble will keep working to improve it over time.
And the Winner Is…
While these Tablets have very different price points,
features, and screen sizes, it is still useful to compare the quality and
performance of their displays because the display enhances or degrades the
appearance of everything that runs on the Tablet.
There is no absolute winner for this Display Shoot-Out
because all 3 Tablets were both winners and losers in some categories, which is
interesting in and of itself. In most categories the 3 displays were reasonably
close in their lab test performance, which again is interesting, but perhaps
not that surprising since they are all IPS LCDs. But the Nook Tablet was the
leader in more categories – both in the lab tests and the viewing tests – so it
is the declared winner in overall display performance and picture quality, at
least for this round…
The iPad 2 also has an excellent display and is very
close in performance to the winner. What is impressive is that the iPad 2 is
still delivering top display performance close to what many predict is the end
of its product cycle, with lots of interesting predictions for its next
generation.
The Amazon Kindle Fire came in with a decidedly last
place finish behind the Nook Tablet and iPad 2. In most categories it was just
somewhat behind the Nook Tablet and iPad 2, but as the Highlights section above explained the Kindle Fire has 2
major flaws. These two significant points aside, it’s otherwise a good Tablet
display. The Gallery viewer delivers only 16-bit color and has a significantly
distorted gray-scale, which could be fixed with a future software update if
Amazon chooses to do so. However, its high screen reflectance cannot be fixed.
Note that some after-market screen protectors that claim to reduce glare
actually increase the overall reflectance but fuzz it out with a matte finish –
so they are not recommended as a fix. The
best solution is just to carefully orient yourself so that there aren’t any
bright sources of light behind you that can reflect off the screen and degrade
or obscure the image. In fact, a lot more can be done to reduce screen
reflections, so I consider all of the Tablets unsatisfactory in this regard,
although the Nook Tablet has the lowest reflectance for now.
What’s Coming Next
The next
Tablet Shoot-Out will be an in-depth scientific comparison and analysis of the
Kindle and Nook E-Ink displays to their LCD cousins to examine their laboratory
and visual performance differences, strengths and weaknesses. Check this link for Display
Shoot-Out updates.
The Next Generation of Tablet Displays in
2012
Tablets are
evolving very quickly, and 2012 will definitely produce some major jumps in
display technology for all Tablets. I’ve made some objective display
predictions, suggestions and recommendations for the Next Generation
of Tablet Displays including an analysis of several popular rumors. They
also apply to 7 inch Tablets. I believe that the smaller 7-8 inch category will
grow tremendously in 2012, and hopefully Apple will introduce a Tablet in this
smaller size as well.
DisplayMate Display Optimization Technology
All Tablet
and Smartphone displays can be significantly improved using DisplayMate’s
advanced scientific analysis and mathematical display modeling and optimization
of the display hardware, factory calibration, and driver parameters. We can
improve the performance of any specified set of display parameters. This
article is a lite version of our intensive scientific analysis – before the
benefits of our DisplayMate Display
Optimization Technology, which can correct or improve all of these issues.
If you are a display or product manufacturer and want to significantly improve
display performance for a competitive advantage then Contact DisplayMate Technologies.
IPS Tablet Display Shoot-Out Comparison
Table
Below we
compare the IPS LCD displays on the Amazon Kindle Fire, Barnes & Noble Nook
Tablet, and Apple
iPad 2 based on objective measurement data and criteria.
For
additional background, context, and information see the 10 Inch Tablet Display
Technology Shoot-Out article that compares the larger Motorola Xoom, Asus
Transformer, Acer Iconia A500, and Samsung Galaxy Tab 10.1 Tablets with the
Apple iPad 2, and the dedicated iPad 2 LCD Display Shoot-Out
article with additional analysis for the iPad 2.
|
Categories
|
Amazon
Kindle
Fire
|
Barnes
& Noble
Nook
Tablet
|
Apple
iPad 2
|
Comments
|
|
Display Technology
|
7.0 inch
IPS LCD
|
7.0 inch
IPS LCD
|
9.7 inch
IPS LCD
|
Liquid Crystal Display
In Plane Switching
|
|
Screen Shape
|
1.71
Aspect
Ratio
|
1.71
Aspect
Ratio
|
4:3 =
1.33
Aspect
Ratio
|
The iPad screen has the same shape as
8.5x11 paper.
Kindle and Nook have active screens
similar to HDTVs.
|
|
OS Version for the Tests
|
6.2
|
1.4.0
|
4.3
|
The current OS versions available during
testing.
|
|
Display Resolution
|
1024 x 600
pixels
1024 x 500
Active
Small
Gallery Images
|
1024 x 600
pixels
1024 x 560
Active
Medium
Gallery Images
|
1024 x 768
pixels
1024 x 768
Active
Large Size
Images
|
The more Pixels and Sub-Pixels the
better.
Kindle and Nook reserve pixels for
Buttons and Status.
Active size is for the Gallery image
viewer.
|
|
Pixels Per Inch
|
169 ppi
Good
Noticeably
Sharper
64% higher
area density
|
169 ppi
Good
Noticeably
Sharper
64% higher
area density
|
132 ppi
Good
Noticeably
Less Sharp
39% lower
area density
|
At 12 inches from the screen 20/20 vision
is 286 ppi.
Best human vision is about 20/10 vision
or 572 ppi.
See this on
the visual acuity for a true Retina Display
|
|
Display Color Depth
|
Full
24-bit color
256
Intensity Levels
|
Full
24-bit color
256
Intensity Levels
|
Full
24-bit color
256
Intensity Levels
|
24-bit displays produce images with
relatively
smooth and artifact free colors and
intensities.
|
|
Gallery / Photo Viewer Color Depth
|
16-bit
color
32 – 64
Intensity Levels
Poorly
Calibrated
|
Full
24-bit color
256
Intensity Levels
Excellent
Calibration
|
Full
24-bit color
256
Intensity Levels
Very Good
Calibration
|
Kindle Fire has a
poor Android Gallery viewer
that provides 16-bit on-screen color.
|
|
|
Kindle
Fire
|
Nook
Tablet
|
iPad 2
|
|
|
Overall Assessments
This section summarizes
the results of all of the extensive Lab measurements and viewing tests
performed on all of the Tablets.
|
|
Viewing Tests
|
Washed Out
Highlights
False
Contouring
Rank 3
Small
Color Shifts
with
Viewing Angle
|
Whites Too
Yellow
Reds
Appear Orangey
Best –
Rank 1
Small
Color Shifts
with
Viewing Angle
|
Whites Too
Blue
Slight
Bluish Tint
Rank 2
Small
Color Shifts
with
Viewing Angle
|
The Viewing Tests examined the accuracy
of
photographic images by comparing the
displays
to a calibrated studio monitor and HDTV.
|
|
Overall Display Assessment
Lab Tests and Viewing Tests
|
Good Tablet Display
Needs Software Updates
|
Excellent Tablet
Display
For Current Generation
|
Excellent Tablet
Display
For Current Generation
|
The Nook Tablet had the best display
overall.
|
|
Overall Display Rank and Grade
|
Rank 3 B–
|
Best – Rank 1 A–
|
Rank 2 A–
|
The Nook Tablet scored slightly ahead of
the iPad 2.
|
|
|
Kindle
Fire
|
Nook
Tablet
|
iPad 2
|
|
|
All of these screens are large mirrors good enough
to use for personal grooming – but it’s actually a very bad feature…
We measured the light reflected from all directions
and also direct mirror (specular) reflections, which are much more
distracting and cause more eye strain. The 10 – 15
percent reflections can make the screen much harder to read even
in moderate ambient light levels, requiring ever
higher brightness settings that waste precious battery power. Hopefully
manufacturers will reduce the mirror reflections
with anti-reflection coatings and haze surface finishes.
|
|
Average Screen Reflection
Light From All Directions
|
14.8 percent
Very Poor
|
6.8 percent
Very Good
|
8.7 percent
Good
|
Measured using an Integrating
Hemisphere.
The Kindle Fire reflects more than
double
the ambient light as the Nook Tablet.
|
|
Mirror Reflections
Percentage of Light Reflected
|
16.3 percent
Very Poor
|
7.0 percent
Very Good
|
10.8 percent
Poor
|
These are the most annoying types of
reflections.
Measured using a narrow collimated
pencil beam
of light reflected off the screen.
|
|
|
Kindle
Fire
|
Nook
Tablet
|
iPad 2
|
|
|
Brightness and Contrast
The Contrast Ratio is the specification that gets
the most attention, but it only applies for low ambient light, which is
seldom
the case for mobile displays. Much more important
is the Contrast Rating, which indicates how easy it is to read the screen
under high ambient lighting and depends on both the
Maximum Brightness and the Screen Reflectance.
|
|
Measured Maximum Brightness
is the Peak Luminance for White
|
Brightness
354 cd/m2
Good
|
Brightness
342 cd/m2
Good
|
Brightness
410 cd/m2
Very Good
|
Maximum Brightness is very important for
mobile
because of the typically high ambient
light levels.
|
|
Black Level
at Maximum Brightness
|
Black is
0.34 cd/m2
Very Good
for Mobile
|
Black is
0.30 cd/m2
Very Good
for Mobile
|
Black is
0.43 cd/m2
Very Good
for Mobile
|
Black brightness is important for low
ambient light,
which is seldom the case for mobile
devices.
|
|
Contrast Ratio
Relevant for Low Ambient Light
|
1,041
Very Good
for Mobile
|
1,140
Very Good
for Mobile
|
962
Very Good
for Mobile
|
Only relevant for low ambient light,
which is seldom the case for mobile
devices.
Defined as Maximum Brightness / Black
Brightness.
|
|
Contrast Rating
for High Ambient Light
|
24
Mediocre
|
50
Very Good
|
47
Very Good
|
Defined as Maximum Brightness / Average Reflectance.
|
|
Screen Readability in Bright Light
|
Mediocre B–
|
Very Good A–
|
Very Good A–
|
Indicates how easy it is to read the
screen
under high ambient lighting. Very
Important!
|
|
|
Kindle
Fire
|
Nook
Tablet
|
iPad 2
|
|
|
The Color Gamut, Intensity Scale, and White Point
determine the quality and accuracy of all displayed images and all
the image colors. Bigger is definitely Not Better
because the display needs to match all the standards that were used
when the content was produced. For LCDs a wider
Color Gamut reduces the power efficiency and the Intensity Scale
affects both image brightness and color mixture
accuracy. The Intensity Scale for the Kindle Fire in its Gallery Viewer
is highly distorted, but its Intensity Scale in the
Browser is virtually identical to the Nook Tablet.
|
|
White Color Temperature
|
6,540
degrees Kelvin
Very Close
to D6500
|
6,016
degrees Kelvin
Slightly
Too Yellow
|
6,991
degrees Kelvin
Slightly
Too Blue
|
D6500 is the standard color of White for
Most Content and necessary for accurate
color reproduction.
|
|
Color Gamut
See Figure 2
|
Color
Gamut Too Small
55 percent
of Std
See Figure 2
|
Color
Gamut Too Small
55 percent
of Std
See Figure 2
|
Color
Gamut Too Small
61 percent
of Std
See Figure 2
|
sRGB / Rec.709 is the color standard for
most
content and needed for accurate color
reproduction.
Note that Too Large is visually worse
than Too Small.
|
|
Intensity Scale and Image Contrast
See Figure 3
|
Gallery
Awful
Browser
Same as Nook
|
Accurate
and Smooth
Close to
Standard
|
Very
Smooth But
Contrast
Too High
|
The Intensity Scale controls image
contrast needed
for accurate image reproduction. See Figure 3
|
|
Gamma for the Intensity Scale
Larger means more Image Contrast
See Figure 3
|
Gallery
0.1 to 2.81
Browser
2.29
|
Very Good
2.28
Close to
Standard
|
Good 2.66
Gamma Too
High
|
Gamma is the slope of the Intensity
Scale.
Gamma of 2.2 is the standard and needed
for
accurate image reproduction. See Figure 3
|
|
|
Kindle
Fire
|
Nook
Tablet
|
iPad 2
|
|
|
Viewing Angles
The
variation of Brightness, Contrast, and Color with viewing angle is especially
important for Tablets because of
their large
screen and multiple viewers. The typical manufacturer 176+ degree specification
for LCD Viewing Angle
is
nonsense because that is where the Contrast Ratio falls to a miniscule 10.
For most LCDs there are substantial
degradations
at less than ±30 degrees, which is not an atypical viewing angle for Tablets
|
|
Brightness Decrease
at a 30 degree Viewing Angle
|
51 percent
Decrease
Falls to
172 cd/m2
Very Large
Decrease
|
55 percent
Decrease
Falls to
153 cd/m2
Very Large
Decrease
|
58 percent
Decrease
Falls to
171 cd/m2
Very Large
Decrease
|
Screens become less bright when tilted.
LCD brightness variation is generally
very large.
|
|
Contrast Ratio
at a 30 degree Viewing Angle
|
612
Very Good
for Mobile
|
621
Very Good
for Mobile
|
564
Very Good
for Mobile
|
A measure of screen readability when the
screen
is tilted under low ambient lighting.
|
|
Primary Color Shifts
at a 30 degree Viewing Angle
|
Small
Color Shift
Δ(u’v’)
= 0.062
1.6 times
JNCD
|
Small
Color Shift
Δ(u’v’)
= 0.0077
1.9 times
JNCD
|
Small
Color Shift
Δ(u’v’)
= 0.0100
2.5 times
JNCD
|
JNCD is a Just Noticeable Color Difference.
IPS LCDs have smaller color shifts with
angle.
|
|
Color Shifts for Color Mixtures
at a 30 degree Viewing Angle
Reference Brown (255, 128, 0)
|
Small
Color Shift
Δ(u’v’)
= 0.0070
1.8 times
JNCD
|
Small
Color Shift
Δ(u’v’)
= 0.0040
1.0 times
JNCD
|
Small
Color Shift
Δ(u’v’)
= 0.0047
1.2 times
JNCD
|
JNCD is a Just Noticeable Color Difference.
Reference Brown is a good indicator of
color shifts
With angle because of unequal drive
levels and
roughly equal luminance contributions
from Red
and Green.
|
|
|
Kindle
Fire
|
Nook
Tablet
|
iPad 2
|
|
|
The power used by the Backlights at Maximum
Brightness accounts for roughly 50 percent of the total Tablet power.
Since the displays have different screen sizes and
maximum brightness, the values were also scaled to the same
screen brightness and screen area in order to
compare their relative power efficiencies. The larger iPad 2 screen
is significantly more efficient than the smaller 7
inch displays.
|
|
Display Backlight Power
at Maximum Brightness
|
1.7 watts
|
1.6 watts
|
2.7 watts
|
Lower power consumption is important for
energy
efficiency and improving running time on
battery.
|
|
Display Backlight Power Efficiency
same Peak Luminance 342 cd/m2
same 7.0 inch screen size area
|
1.7 watts
|
1.6 watts
|
1.1 watts
|
This compares the Relative Power
Efficiency
by looking at the same screen brightness
and
screen area.
|
|
|
Kindle
Fire
|
Nook
Tablet
|
iPad 2
|
|
|
Running Time on Battery
The running time on battery was determined with the
Brightness sliders set for maximum and minimum brightness,
with the Tablet in Airplane Mode, with no running
applications, and with Auto Brightness turned off (if equipped).
Note that Auto Brightness can have a considerable
impact on running time but we found abysmal performance for
both the iPhone and Android Smartphones in our BrightnessGate analysis of Ambient Light Sensors
and Automatic
Brightness. The Kindle Fire and Nook Tablet do not
have Ambient Light Sensors or Automatic Brightness. They need
a more convenient Manual Brightness Control as
described in the BrightnessGate article.
|
|
Running Time
At Maximum Brightness Setting
|
Running
Times
Not Yet
Available.
|
Running
Times
Not Yet
Available
|
7.2 hours
|
Display always On at the Maximum setting
with
Airplane Mode and no running
applications.
|
|
Running Time
At Minimum Brightness Setting
|
Running
Times
Not Yet
Available
|
Running
Times
Not Yet
Available
|
19.8 hours
|
Display always On at the Minimum setting
with
Airplane Mode and no running
applications.
|
|
Categories
|
Kindle
Fire
|
Nook
Tablet
|
iPad 2
|
Comments
|
About the Author
Dr. Raymond Soneira is
President of DisplayMate Technologies Corporation of Amherst, New Hampshire,
which produces video calibration, evaluation, and diagnostic products for
consumers, technicians, and manufacturers. See www.displaymate.com. He is a research
scientist with a career that spans physics, computer science, and television
system design. Dr. Soneira obtained his Ph.D. in Theoretical Physics from
Princeton University, spent 5 years as a Long-Term Member of the world famous
Institute for Advanced Study in Princeton, another 5 years as a Principal
Investigator in the Computer Systems Research Laboratory at AT&T Bell
Laboratories, and has also designed, tested, and installed color television
broadcast equipment for the CBS Television Network Engineering and Development
Department. He has authored over 35 research articles in scientific journals in
physics and computer science, including Scientific American. If you have any
comments or questions about the article, you can contact him at dtso.info@displaymate.com.
About DisplayMate Technologies
DisplayMate Technologies
specializes in advanced mathematical display technology optimizations and
precision analytical scientific display diagnostics and calibrations to deliver
outstanding image and picture quality and accuracy – while increasing the
effective visual Contrast Ratio of the display and producing a higher
calibrated brightness than is achievable with traditional calibration methods.
This also decreases display power requirements and increases the battery run
time in mobile displays. This
article is a lite version of our intensive scientific analysis of smartphone
and mobile displays – before the benefits of our advanced mathematical DisplayMate Display Optimization
Technology, which can correct or improve many of the deficiencies –
including higher calibrated brightness, power efficiency, effective screen
contrast, picture quality and color and gray scale accuracy under both bright
and dim ambient light, and much more. Our advanced
scientific optimizations can make lower cost panels look as good or better than
more expensive higher performance displays. For more information on our
technology see the Summary description of our Adaptive Variable Metric Display
Optimizer AVDO. If you are a display or product
manufacturer and want our expertise and technology to turn your display into a
spectacular one to surpass your competition then Contact DisplayMate Technologies
to learn more.
Article Links: Display Technology Shoot-Out
Article Series Overview and Home Page
Copyright © 1990-2011 by DisplayMate
Technologies Corporation. All Rights Reserved.
This article, or any part
thereof, may not be copied, reproduced, mirrored, distributed or incorporated
into any other work without
the prior written permission of DisplayMate Technologies Corporation