Samsung Galaxy S Super OLED Display Shoot-Out
Dr. Raymond M. Soneira
President, DisplayMate Technologies Corporation
Copyright © 1990-2010 by DisplayMate
Technologies Corporation. All Rights Reserved.
This article, or any part
thereof, may not be copied, reproduced, mirrored, distributed or incorporated
into any other work without
the prior written permission of DisplayMate Technologies Corporation
Series
Overview
This is part of a
comprehensive article series with in-depth measurements and analysis for the
OLED and LCD displays in the Google
Nexus One, the Apple iPhone 3GS, the Motorola Droid, the Samsung
Galaxy S, and the Apple iPhone 4. We will show you the good, the bad,
and also the ugly unfinished rough edges and problems lurking below the
surface of each of these displays and display technologies, and then
demonstrate how the displays can be improved by using images that have been
mathematically processed to correct color and imaging errors on each
smartphone so you can compare them to the originals. The series begins with
the Google Nexus One and Apple iPhone 3GS. It then continues with higher
performance “Super” displays in the Motorola Droid, the Samsung
Galaxy S, and the Apple iPhone 4. Finally, there is a five way Smartphone "Super" LCD-OLED Display
Technology Shoot-Out
that compares all of the units simultaneously.
|

|
Introduction
A key element in the success of all smartphones and mobile
devices is the quality and performance of their display. There have been
lots of articles comparing various smartphone LCD and OLED displays and
technologies, but almost all simply deliver imprecise off-the-cuff remarks
like “the display is gorgeous” with very little in the way of serious
attempts at objective or accurate display performance evaluations and
comparisons – and many just restate manufacturer claims and provide
inaccurate information, performance evaluations and conclusions. This article objectively
evaluates the display performance of the Samsung Galaxy S Super OLED
display based on extensive scientific lab measurements together with
extensive side-by-side visual tests.
The Galaxy S display is distinctive in several
respects: it is an Organic LED display, which is an emissive display
technology, whereas most mobile devices have an LCD display, which uses a
static backlight behind the panel. And it has Samsung’s next generation
premium OLED display marketed as a “Super AMOLED” display. The AM stands
for Active Matrix, but all smartphone displays have that. The screen is 4.0
inches diagonally and has a high-resolution high-density 800x480 pixel
display with a screen Aspect Ratio of 1.67, which is higher than the
iPhone’s 1.50, but lower than standard widescreen HDTV displays, which have
an Aspect Ratio of 1.78. There are several versions of the Samsung Galaxy S
smartphone. We tested the Vibrant model for T-Mobile.
The Samsung Galaxy S, Motorola
Droid and Nexus One use the Google Android OS. The Galaxy S and Nexus One
were tested with Android version 2.1 and the Motorola Droid with version
2.0.1. We discovered that Android 2.1 only processes 16-bit color for its
principal Browser and Gallery photo viewer, which substantially decreases
image and picture quality. Google
acknowledged these problems for Android 2.1 phones including the Nexus One
and Galaxy S. The next major release of the Android OS will fix these
issues and provide full 24-bit color and improved scaling. Click Here to
read the Google and Cooliris statements commenting on our results.
|
|
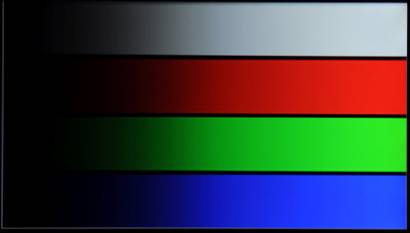
FIGURE 1
Figure 1. Revealing Screen Shots for
the Google Nexus One and Samsung Galaxy S.
|
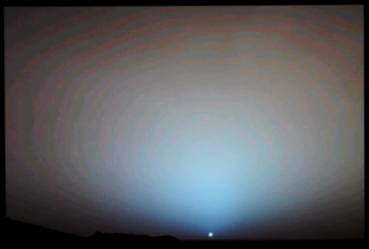
Nexus One: NASA
Photo - Sunset on Mars
Gallery Application:
Lots of false contouring and image noise
|
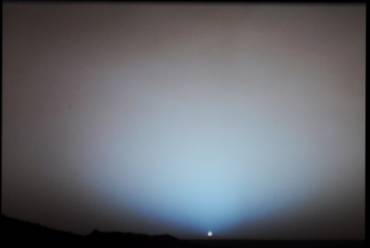
Motorola Droid:
NASA Photo - Sunset on Mars
Gallery Application:
The same as it looks on a studio monitor
|
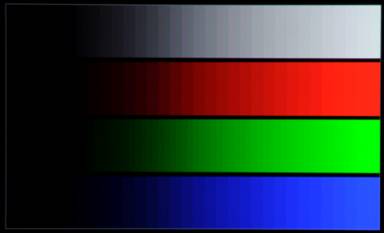
Nexus One: Intensity Scale Ramps
Gallery and Browser
Apps: Coarse steps and tinting on white
|
Motorola Droid: Intensity Scale Ramps
Gallery and Browser
Apps: Very smooth and artifact free
|
Figure 1. Revealing Screen Shots for
the Google Nexus One and Samsung Galaxy S.
The test patterns are 24-bit bmp at the native
resolution of each display.
Results and Conclusions
The display was evaluated
by downloading 24-bit native resolution 800x480 test patterns and 24-bit HD
resolution test photos to the phone. Note that we are testing and evaluating
the display on the Galaxy S with whatever hardware, firmware, OS and software
are provided by Samsung.
Color
Depth and Granularity: 16-bit Color Dithered to 24-bit Color
An absolutely shocking discovery for Android 2.1
smartphones is that the principal Android Browser and Gallery Applications use
only 16-bit color, so Red and Blue only have 32 possible intensity levels and
Green only has 64 possible intensity levels. Google
acknowledged these problems for Android 2.1 phones including the Nexus One,
Motorola Droid and Galaxy S. The next major release of the Android OS will fix
these issues and provide full 24-bit color and improved scaling. Click Here to read
the Google and Cooliris statements commenting on our results. The Galaxy S, which was tested with Android 2.1, performs
somewhat better than the Google Nexus One and Motorola Droid under Android 2.1.
It appears that the Browser and Gallery applications in the Galaxy S are
updated with dithering or filtering that partially obscures the 16-bit
interface.
Display
Image Quality, Colors and Artifacts: Very Good
Other than the over saturated colors due to a Color Gamut
that is too large and the issues mentioned under Color
Depth and Granularity above, the Galaxy S delivers very good picture
quality that is relatively free of artifacts. The PenTile arrangement of the
OLEDs has only two sub-pixels per pixel instead of the usual three, so it
sometimes appears more pixilated than its stated resolution implies – it’s
excellent for photographic images but is noticeably degraded for colored (red,
blue and magenta) text and graphics. In fact, the Galaxy S only has a combined
total of 0.38 Million Red and Blue sub-pixels, whereas the iPhone 4 has 1.23
Million, more than three times as many.
The Measurements with Explanations and
Interpretations:
The Measurements section
below has details of all of the lab measurements and tests with lots of
additional background information and explanations including the display’s
Maximum Brightness and Peak Luminance, Black Brightness, Contrast Ratio, Screen
Reflectance, Bright Ambient Light Contrast Rating, Dynamic Color and Contrast,
Color Temperature and White Chromaticity, Color Gamut, Intensity Scale and
Gamma, the variation of Brightness, Contrast Ratio and Color Shift with Viewing
Angle, the Power Consumption and Light Spectrum of the display.
The
Viewing Tests: Accurate Image Contrast But Too Much Color
We compared the Galaxy S
side-by-side to a calibrated Professional Sony High Definition Studio Monitor
using a large set of DisplayMate Calibration and Test Photographs. All of the
photos on the Galaxy S had too much color saturation, to the point of appearing
gaudy, particularly faces and well known objects such as fruits, vegetables,
flowers, grass, even a Coca-Cola can. Photos that include very color saturated
objects, such as a fire engine, were in some cases painful to look at. These
effects are similar to setting an HDTV to a Vivid picture mode and then turning
up the Color and Sharpness Controls. The punchy and excessively vibrant looking
images on the Galaxy S may initially get lots of oohs and aahs, like in many of
the early reviews, but after a while the gaudy looking images will become
tiresome and unpleasant.
Factory
Calibration and Quality Control: Good
The overall factory calibration and quality control for
the Samsung Galaxy S display is good. Unlike the “non-Super” OLED on the Nexus
One, which has horrible artifacts and factory calibration, the Galaxy S Super
OLED was reasonably well calibrated, with fairly smooth and artifact free
intensity scales. The color and gray-scale tracking are also very good, which
means that the Red, Green and Blue primaries have been carefully calibrated and
balanced.
Suggestions
for Samsung:
The Super OLED display is a tremendous step forward over
the earlier non-Super OLEDs, such as in the Google Nexus One. It’s an excellent
display, but here are some suggestions on how to make it better: The major
shortcoming is operating with a color gamut that is too large, producing gaudy
images that have too much color saturation. You can trade this excess color
saturation to boost the screen brightness by adjusting the software color
calibration matrices, which will also improve the color accuracy of the
display. Similarly, the White point is too blue, lower it to D6500, which will
improve color accuracy, slow the aging of the Blue OLED, reduce power
consumption, and improve battery run time. Part II
will include some important suggestions for correcting the Automatic Brightness
control, which is very important for screen readability, viewing comfort and
preserving battery power. Finally, keep after Google
to fix the image scaling and 16-bit interface issues in Android 2.1 and 2.2 –
it significantly reduces the picture quality of your display
This
article is a lite version of our intensive scientific analysis of smartphone
and mobile displays – before the benefits of our advanced mathematical DisplayMate Display Optimization
Technology, which can correct or improve many of the deficiencies –
including higher calibrated brightness, power efficiency, effective screen
contrast, picture quality and color and gray scale accuracy under both bright
and dim ambient light, and much more. If you are a
manufacturer and want our expertise and technology to turn your display into a
spectacular one to surpass your competition then Contact DisplayMate Technologies
to learn more.
Samsung Galaxy
S Conclusion: Excellent Mobile Display
wins Best New Mobile
Display Technology Award
 The Samsung
Galaxy S Super OLED is an excellent mobile display. What is particularly
impressive is how rapidly Samsung has been improving their OLED technology. The
“Super” OLED is a much more refined display with many fewer artifacts and a
much better factory calibration. Particularly impressive is the very low screen
reflectance, which is among the lowest we have ever measured – outdoors it can
have a significant impact on screen visibility. The over-saturated gaudy colors
are still there – they need to be properly managed and can be used
constructively in a calibrated fashion to counteract the effects of glare from
ambient light (Part II).
The big question remaining for OLEDs (and not covered by our tests) is whether
the previous uneven aging over time for the red-green-blue OLED sub-pixels has
been solved. While OLED is still a relatively young display technology that has
not yet been perfected to the performance levels of the very best mature LCDs,
the Galaxy S is already an impressive display for an upcoming and rapidly
evolving technology, so it earned our Best New Mobile Display
Technology Award. Samsung needs to keep up the good work and keep pushing
hard because there is lots of competition and everyone (except the competition)
is looking forward to the next generation “Super-Duper” OLEDs…
The Samsung
Galaxy S Super OLED is an excellent mobile display. What is particularly
impressive is how rapidly Samsung has been improving their OLED technology. The
“Super” OLED is a much more refined display with many fewer artifacts and a
much better factory calibration. Particularly impressive is the very low screen
reflectance, which is among the lowest we have ever measured – outdoors it can
have a significant impact on screen visibility. The over-saturated gaudy colors
are still there – they need to be properly managed and can be used
constructively in a calibrated fashion to counteract the effects of glare from
ambient light (Part II).
The big question remaining for OLEDs (and not covered by our tests) is whether
the previous uneven aging over time for the red-green-blue OLED sub-pixels has
been solved. While OLED is still a relatively young display technology that has
not yet been perfected to the performance levels of the very best mature LCDs,
the Galaxy S is already an impressive display for an upcoming and rapidly
evolving technology, so it earned our Best New Mobile Display
Technology Award. Samsung needs to keep up the good work and keep pushing
hard because there is lots of competition and everyone (except the competition)
is looking forward to the next generation “Super-Duper” OLEDs…
The Measurements with Explanations and Interpretations
This
section explains all of the measurements incorporated in the article. The
display was evaluated by downloading 24-bit native resolution 800x480 test
patterns and 24-bit HD resolution test photos to the Samsung Galaxy S. Note
that we are testing and evaluating the display on the Galaxy S with whatever
hardware, firmware, OS and software are provided by Samsung. All measurements
were made using DisplayMate
Multimedia Edition for Mobile Displays to generate the analytical test
patterns together with a Konica
Minolta CS-200 ChromaMeter, which is a Spectroradiometer. All measurements
were made in a perfectly dark lab to avoid light contamination. All devices
were tested with their Backlight set for maximum brightness with the Automatic
Brightness light sensor control turned off, and running on their AC power
adapter with a fully charged battery, so that the battery performance and state
was not a factor in the results. For further in-depth discussions and explanations
of the tests, measurements, and their interpretation refer to earlier articles
in the DisplayMate
Multimedia Display Technology Shoot-Out article series and the DisplayMate Mobile Display
Shoot-Out article series.
Konica Minolta CS-200
1. Peak Brightness: 365 cd/m2 –
305 cd/m2 Full Screen – Somewhat Low for a Mobile Display
This is the maximum brightness that the display
can produce, called the Peak White Luminance. We measured 365 cd/m2
when the screen was white in only one small spot, and 16 percent lower, 305
cd/m2 when the screen was mostly white, which is typical for most
web and app content. This is due to power management (below). 305 cd/m2
is fine for indoor lighting but is somewhat low for outdoors. Fortunately the
Galaxy S has a very low Screen Reflectance (below), which dramatically helps
screen readability under high ambient lighting.
2. Black Level Brightness: Less Than 0.005 cd/m2
– Outstanding
The Black Level is the
closest approximation to true black that the display can produce. Almost all
displays wind up producing a visible dark gray on-screen instead of true black.
This is a major problem for LCDs. The glow reduces image contrast and screen
readability and can be distracting or even annoying in dark environments. It
ruins the dark end of the display’s intensity/gray scale and washes out colors
in the image. But note that in bright ambient lighting the Black Level is
irrelevant because reflections off the screen dominate the screen background
brightness. OLED is an emissive technology, so the Galaxy S is able to produce
very close to true black, which is absolutely stunning in dark ambient
lighting. In fact, the Black Luminance was so low that the CS-200 was unable to
measure it, so we report it as less than 0.005 cd/m2, which means it
is nearly invisible to the eye even in the dark.
3. Contrast Ratio – Only Relevant for Low
Ambient Light:
Greater
Than 61,000 – Outstanding
The Contrast Ratio is a
measure of the full range of brightness that the display is capable of
producing. It is the ratio of Peak Brightness to Black Level Brightness. The
larger the Contrast Ratio the better, but it is only relevant for low ambient
lighting because reflections off the screen dominate the display’s Black Level
in bright ambient lighting. Note that any Contrast Ratio over 5,000 will not be
visually significant except in fairly dark viewing environments with dark image
content. Because the Galaxy S OLED display produces an extremely dark black its
Contrast Ratio is spectacularly large, among the highest we’ve ever measured
for a production display. Don’t confuse this true Contrast Ratio with the
tremendously inflated Dynamic Contrast Ratios that are published by many
manufacturers.
4. Screen Reflectance of Ambient Light: 4.4 Percent –
Excellent
The often overlooked
Screen Reflectance is actually the most important parameter for a mobile
display, even more important than Peak Brightness. The screen reflects a
certain percentage of the surrounding ambient light, which adds to the screen
background, washes out the image, and makes it harder to see what is on the
screen. In high ambient lighting the Screen Reflectance can significantly
reduce the visibility and readability of screen content. The lower the Screen
Reflectance the better. The value for the Galaxy S of 4.4 percent is among the
lowest values we’ve ever measured for mobile devices. Lowering the Screen
Reflectance increases the cost of a display, but it’s the easiest and best way
to improve screen readability under bright ambient light. The Screen
Reflectance measurements were done in accordance with VESA FPDM 308-1,
Reflectance with Diffuse Illumination, using an integrating hemispherical dome
and a calibrated diffuse white reflectance standard.
5. High Ambient Light Contrast Rating: 69 – 83 – Excellent
In the same way that the
Contrast Ratio measures the screen contrast under low ambient lighting, the
Bright Contrast Rating specifies the relative screen contrast under high
ambient lighting. It is the ratio of Peak Brightness to Screen Reflectance. The
higher the value the better you’ll be able to see what’s on the screen when you
are in a bright location. The values of 69 – 83 (depending on which peak
brightness value is used) is very high, so the Galaxy S is among the best
mobile displays for high ambient lighting. For all mobile devices the High
Ambient Light Contrast Rating is much more important than the Contrast Ratio.
6. Dynamic Color and Dynamic Contrast: Yes – But for Power
Management
Some displays dynamically adjust the color, gray
scale and contrast on every image that is displayed using an internal automatic
image processing algorithm. The goal is generally to jazz up and “enhance” the
picture by stretching and exaggerating the colors and intensity scale. It is
similar to the Vivid mode found in many digital cameras and HDTVs. Since it
alters and frequently distorts the image it is better left as an option for
people who aren’t concerned with picture accuracy and fidelity. Since the
Dynamic modes are generally triggered by changes in Average Picture Level, a
very simple test for Dynamic Contrast is to separately measure the brightness
of full screen Red, Green and Blue images and then compare them to White, which
should equal their sum. If they don’t agree then there is Dynamic Color and
Contrast processing. For the Galaxy S, the measured Luminance for Red=85,
Green=232 and Blue=23 cd/m2. Their sum is 340 cd/m2,
which is 11 percent greater than the measured value for White, 305 cd/m2,
so the Galaxy S employs some Dynamic Contrast. For the PenTile OLEDs this
appears to be caused by intentional power management – similar to Plasmas.
7. Color Temperature and Chromaticity: 9,688 degrees Kelvin –
Whites are Too Blue
White is not a single
color but rather falls within a range that is normally specified by a Color
Temperature. For accurate color reproduction of most content, including
photographs, images and web content it needs to be set to the industry standard
D6500, which is how most professional photo and video content is color
balanced. D6500 is the color of natural daylight and is similar to a Black Body
at 6500 degrees Kelvin. 9,688 Degrees is pretty far off and gives everything on
the screen, including photographs, a noticeable bluish cast or tint, like Cool
White fluorescent bulbs. Given the aging and efficiency problems with blue
OLEDs, it is surprising to see a bluish tint on the Galaxy S display, which
means that the Blue OLED is being driven extra hard. Better to back it off and
improve color accuracy, OLED aging, power consumption, and battery life all at
the same time. The measured CIE Chromaticity Coordinates of the White Point are
u’=0.1813 v’=0.4490. See the White Points in Figure 2 below.
8. Color Gamut: Much Larger than the Standard Gamut –
Colors are Inaccurate and Over Saturated
The Color Gamut of a
display is the range and set of colors that it can produce. The only way that a
display will deliver good color and gray scale accuracy is if it is accurately
calibrated to an industry standard specification, which for computers, digital
cameras, and HDTVs is sRGB or Rec.709. It’s the standard for most content and
necessary for accurate color reproduction. If the Color Gamut is smaller than
the standard then the image colors will appear too weak and under-saturated. If
the Color Gamut is greater than the standard then the image colors will appear
too strong and over-saturated. The important point here is that a Color Gamut
larger than the standard is also bad, not better. Wider gamuts will not show
you any colors or content that are not in the original images, which are almost
always color balanced for the sRGB / Rec.709 standard. Wider color gamuts
simply distort and decrease color accuracy and should be avoided, except for
some special applications.
Figure 2 shows the
measured Color Gamut for the Nexus One and the Samsung Galaxy S alongside the
Standard sRGB / Rec.709 Color Gamut in a CIE 1976 Uniform Chromaticity Diagram.
The dots in the center are the measured White Points for the phones along with
the D6500 Standard, which is marked as a white circle. The outermost curve are
the pure spectral colors and the diagonal line on the bottom right is the line
of purples. A given display can only reproduce the colors that lie inside of
the triangle formed by its primary colors. Highly saturated colors seldom occur
in nature so the colors that are outside of the standard sRGB / Rec.709
triangle are seldom needed and are unlikely to be noticed or missed in the
overwhelming majority of real images. When a camera or display can’t reproduce
a given color it simply produces the closest most saturated color that it can.
FIGURE 2
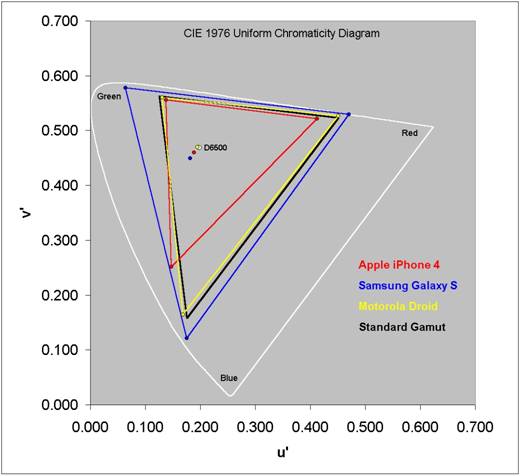
Figure 2. CIE 1976 Uniform
Chromaticity Diagram showing the Color Gamut and White Point for the Samsung
Galaxy S
Both the iPhone 4 and Galaxy S perform poorly with
reference to the standard Color Gamut, which is the black triangle in Figure 2.
The iPhone has much too small a color Gamut and the Galaxy S has much too large
a color Gamut. As a result the iPhone produces images that have significantly
too little color saturation and the Galaxy S produces images that have
significantly too much color saturation. This applies to all external content
viewed on the displays, including web content, such as images, photos and
videos. This was easy to see in the viewing tests where we compared the
displays side-by-side to a calibrated Professional Sony High Definition Studio
Monitor using a large set of DisplayMate Calibration and Test Photographs.
Galaxy S photos had too much color, to the point of appearing gaudy,
particularly faces, and well known objects such as fruits, vegetables, flowers,
grass, and even a Coca-Cola can. The iPhone had the reverse problem, all of the
photos looked somewhat pale, flat, washed-out and under-saturated.
9. Intensity Scale, Image Contrast and Gamma: Very Good Match to the
Standard
The display’s intensity
scale not only controls the contrast within an image but it also controls how
the Red, Green and Blue primary colors mix to produce all of the on-screen
colors. So if it doesn’t obey the industry standard intensity scale then the
colors and intensities will be wrong everywhere on-screen because virtually all
professional content and all digital cameras use the sRGB / Rec.709 standard,
so it’s necessary for accurate image, picture and color reproduction. The
standard intensity scale is not linear but rather follows a mathematical
power-law, so it is a straight line on a log-log graph. Its slope is called
Gamma, which is 2.2 in the standards. In order to deliver accurate color and
intensity scales a display must closely match the standard. Figure 3 shows the
measured (Transfer Function) Intensity Scale for the Samsung Galaxy S and
iPhone 4 alongside the industry standard Gamma of 2.2, which is a straight
line.
FIGURE 3
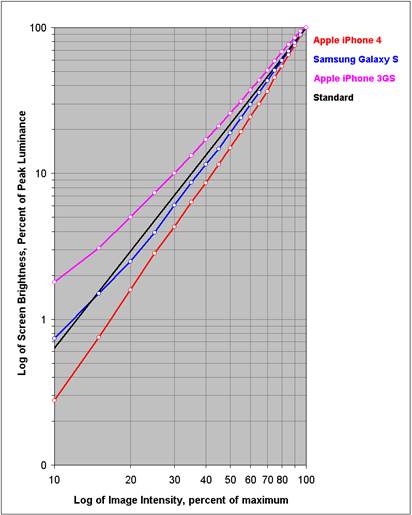
Figure 3. Intensity Scale for the
Samsung Galaxy S
The Galaxy S provides a good match with respect to the
standard intensity scale, which is needed in order to accurately reproduce
images and pictures for most content. Gamma is the slope of the intensity
scale, which should be a constant 2.2 like the straight line in Figure 3. The
Gamma for the Galaxy S is 2.36, which is a very good match to the standard.
10. Brightness Decrease with Viewing Angle:
28 percent decrease in 30 degrees – Surprisingly large for
an OLED
A major problem with many displays, especially
LCDs, is that the image changes with the viewing angle, sometimes dramatically.
The Peak Brightness, Black Luminance and Contrast Ratio generally change with
viewing angle (in addition to color, see below). Some display technologies are
much better than others. A pure OLED display should not show any viewing angle
effects, however, the Galaxy S shows a surprisingly large variation in
Brightness with viewing angle, undoubtedly due to the touchscreen layer and
anti-reflection absorption layer that are on top of the OLED layer. At a
moderate 30 degree viewing angle the Peak Brightness of the Galaxy S fell by a
surprisingly large 28 percent to 221 cd/m2.
11. Black Level and Contrast Ratio Shift with
Viewing Angle: Not Visually Significant
The Black Level and Contrast Ratio also vary
with Viewing Angle, but since they are both spectacular for the Galaxy S their
variation is of no visual significance.
12. Color Shift with Viewing Angle: Surprisingly Large for
an OLED
Colors generally shift
with viewing angle whenever the brightness shifts with viewing angle because
the Red, Green and Blue sub-pixels each shift independently and vary with
intensity level. At a moderate 30 degree viewing angle Red shifted the most, by
Δ(u’v’) = 0.0229, which is 6 times the Just Noticeable Color Difference.
Green shifted the least at Δ(u’v’) = 0.0104 and Blue shifted by 0.0147.
These are surprisingly large for an OLED, again, undoubtedly due to the
anti-reflection absorption layer that are on top of the OLED layer.
13. RGB Display Power Consumption: Relatively High –
Not a Green
Display…
Unlike LCDs, the power
consumed by OLEDs varies with the brightness of the individual Red, Green and
Blue sub-pixels, so the power consumption varies with the brightness and color
distribution of each image. When the display is all black, the OLED display
effectively uses no power, although the drive circuits still consume some.
Maximum power is used when the display shows Peak Intensity White over the
entire screen because all OLED sub-pixels are at their maximum brightness. It
is possible to indirectly determine the power used by the display by measuring
the AC power used by the Nexus One with different test patterns. The average power
used when the screen is all black is used as the baseline and is subtracted
from the power measured for the other states.
Table 1 lists the Measured
Relative Power, the Measured Luminance, and the Relative Luminous Efficiency,
which is just the Measured Luminance divided by the Measured Relative Power,
and normalized to 1.0 for White, which has the highest total efficiency.
Table 1. Samsung Galaxy
S LCD Display Power Consumption
|
Maximum Backlight
Full Screen
|
Black
|
Peak White
|
|
Measured Relative Power
|
0 watts
|
1.13 watts
|
|
Measured Luminance
|
0 cd/m2
|
305 cd/m2
|
|
Relative Luminous Efficiency
|
--
|
1.00
|
14. OLED and LCD Spectra: Very Interesting
The spectra of an LCD display is just the
spectrum of the backlight filtered through the individual Red, Green and Blue
sub-pixel filters within the panel. OLEDs are emissive devices so the spectra
of the Samsung Galaxy S is just the sum of the individual Red, Green and Blue
OLED spectra, modified slightly by the touchscreen layer and anti-reflection
absorption layer through which their light must pass. We thought it would be
very useful and interesting to compare the spectra of the Galaxy S with the
spectra of the Apple iPhone 4, so we asked Konica Minolta to
loan us their flagship CS-2000
Spectroradiometer to perform the measurements. The spectra for White, which
is the sum of the Red, Green and Blue primaries is shown in Figure 4 for both
the Galaxy S and Apple iPhone 4.
FIGURE 4
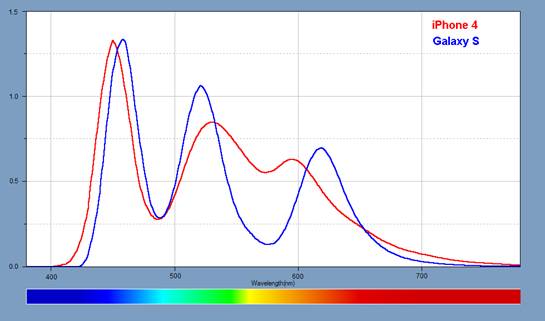
Figure 4. RGB Spectra for the iPhone
4 and Samsung Galaxy S
As
expected the OLED RGB spectra are relatively narrow because of their high color
saturation. The iPhone 4 LCD RGB spectra is a filtered broadband spectrum. The
backlight for the iPhone is a white LED, which consists of a Blue LED with a
yellow phosphor.
About the Author
Dr. Raymond Soneira is President
of DisplayMate Technologies Corporation of Amherst, New Hampshire, which
produces video calibration, evaluation, and diagnostic products for consumers,
technicians, and manufacturers. See www.displaymate.com.
He is a research scientist with a career that spans physics, computer science,
and television system design. Dr. Soneira obtained his Ph.D. in Theoretical
Physics from Princeton University, spent 5 years as a Long-Term Member of the
world famous Institute for Advanced Study in Princeton, another 5 years as a
Principal Investigator in the Computer Systems Research Laboratory at AT&T
Bell Laboratories, and has also designed, tested, and installed color
television broadcast equipment for the CBS Television Network Engineering and
Development Department. He has authored over 35 research articles in scientific
journals in physics and computer science, including Scientific American. If you
have any comments or questions about the article, you can contact him at dtso.info@displaymate.com.
About DisplayMate Technologies
DisplayMate Technologies specializes in
advanced mathematical display technology optimizations and precision analytical
scientific display diagnostics and calibrations to deliver outstanding image
and picture quality and accuracy – while increasing the effective visual
Contrast Ratio of the display and producing a higher calibrated brightness than
is achievable with traditional calibration methods. This also decreases display
power requirements and increases the battery run time in mobile displays. This article is a lite version of
our intensive scientific analysis of smartphone and mobile displays – before
the benefits of our advanced mathematical DisplayMate Display Optimization
Technology, which can correct or improve many of the deficiencies –
including higher calibrated brightness, power efficiency, effective screen
contrast, picture quality and color and gray scale accuracy under both bright
and dim ambient light, and much more. Our advanced
scientific optimizations can make lower cost panels look as good or better than
more expensive higher performance displays. For more information on our
technology see the Summary description of our Adaptive Variable Metric Display
Optimizer AVDO. If you are a display or product
manufacturer and want our expertise and technology to turn your display into a
spectacular one to surpass your competition then Contact DisplayMate Technologies
to learn more.
Article Links: Display Technology Shoot-Out
Article Series Overview and Home Page
Copyright © 1990-2010 by DisplayMate
Technologies Corporation. All Rights Reserved.
This article, or any part
thereof, may not be copied, reproduced, mirrored, distributed or incorporated
into any other work without
the prior written permission of DisplayMate Technologies Corporation
