Galaxy S4 Display Technology Shoot-Out
Samsung Galaxy S III – Samsung Galaxy S4 – Apple iPhone 5
Dr. Raymond M. Soneira
President, DisplayMate Technologies Corporation
Copyright © 1990-2013 by DisplayMate
Technologies Corporation. All Rights Reserved.
This article, or any part
thereof, may not be copied, reproduced, mirrored, distributed or incorporated
into any other work without
the prior written permission of DisplayMate Technologies Corporation
Introduction
The Samsung Galaxy S Smartphones are by far the most popular Android
Smartphones and are flagship products for Samsung to show off its latest and
greatest OLED display technology. The display on the Galaxy S4 is a major
enhancement and improvement over the Galaxy S III – it has a full HD 1920x1080
resolution display with 441 Pixels Per Inch. It is also better calibrated,
brighter, and bigger. We’ll analyze the Galaxy S4 with an in-depth objective
series of Lab tests and measurements included below.
Samsung provided DisplayMate Technologies with an early production unit
to test and analyze for our Display Technology Shoot-Out article series. It is
likely that the retail units will have additional display firmware and software
tweaks and improvements over our test unit. If that is the case, we will update
the article when our unit is upgraded by Samsung.
OLED Displays
While most mobile displays are still LCD based, OLEDs
have been capturing a rapidly increasing share of the mobile display market.
The technology is still very new, with the Google Nexus One Smartphone,
launched in January 2010, as the first OLED display product that received
widespread notoriety. In a span of just a few years this new display technology
has improved at a very impressive rate, now challenging the performance of the
best LCDs. Virtually all of the OLED displays used in mobile devices are
produced by Samsung Display. We have provided an in-depth analysis on the
evolution of OLEDs in our Galaxy S I, S
II, and S III Display Technology Shoot-Out article.
The Shoot-Out
To examine the performance of the Samsung Galaxy S4 we ran our in-depth series of Mobile Display Technology
Shoot-Out Lab tests and included the Galaxy S III
in order to determine how OLED displays have improved, and the iPhone 5 to
determine how it compares to a leading high-end LCD display. We take display
quality very seriously and provide in-depth objective analysis side-by-side
comparisons based on detailed laboratory measurements and extensive viewing
tests with both test patterns and test images. To see how far Smartphones have
progressed in just three years see our 2010 Smartphone
Display Shoot-Out, and for a real history lesson see our original 2006 Smartphone
Display Shoot-Out.
Results Highlights
In this Results section we provide Highlights of the
comprehensive Lab measurements and extensive side-by-side visual comparisons
using test photos, test images and test patterns that are presented in later
sections. The Comparison
Table in the following section summarizes the lab measurements in the
following categories: Screen Reflections, Brightness and Contrast, Colors and Intensities, Viewing Angles, Display Power Consumption, Running Time on Battery. You can also skip the Highlights
and go directly to the Conclusions.
A Full HD 1920x1080 Display
By far the most interesting recent development in
Smartphones is a full High Definition 1920x1080 display in a 5.5 inch or
smaller screen size – the same pixel resolution as your 50 inch living room
HDTV – that’s very impressive! First of all, this is a benchmark spec with
tremendous marketing power for driving consumer sales. But there are other
important reasons for going to Full HD in a Smartphone – there is a tremendous
amount of HD 1920x1080 content available. Displaying that content at its native
resolution (without the need to rescale up or down) results in the best
possible image quality, plus rescaling requires processing overhead that uses
(wastes) precious battery power. The Galaxy S4 is one of the first few
Smartphones to offer Full HD.
400+ Pixels Per Inch Displays
Apple started a major revolution in display marketing by
introducing their “Retina Display” with 326 Pixels Per Inch (PPI) on the iPhone
4 in 2010. While not equivalent to the resolution of the human retina, people
with 20/20 Vision cannot resolve the individual pixels when the display is held
at normal viewing distances of 10.5 inches or more. It started a display PPI
and Mega Pixel war similar to what happened with Smartphone digital cameras,
which is still an ongoing wild goose chase now into the stratosphere… Hopefully
the same thing won’t happen with mobile displays because there are tradeoffs
involved that affect other important display performance issues. The real
question is how high do we need to go before reaching a practical visual PPI
limit? I’ll cover this in an upcoming article. However, a new generation of
400+ PPI displays is already here, driven by the desire to produce a Full HD
1920x1080 display on a Smartphone screen. The Galaxy S4 has an incredible 441
Pixels Per Inch. People with 20/20 Vision cannot resolve the individual pixels
on a 441 PPI display for viewing distances of 7.8 inches or more, which is
exceedingly close for viewing a 5.0 inch display.
PenTile Displays
The pixels on most current OLED displays have only 2
sub-pixels in each pixel instead of the standard 3 Red, Green, and Blue
sub-pixels found in most other displays and display technologies. Half of the
PenTile pixels have Green and Red sub-pixels and the other half have Green and
Blue sub-pixels, so Red and Blue are always shared by two adjacent pixels. This
makes PenTile displays easier to manufacture and at a lower cost. It also
improves brightness and reduces aging effects. Because the eye has lower visual
acuity for color this works very well for photographic and video images. But
for digitally generated fine text and graphics with precise pixel layouts the
eye can visually detect the reduced number of Red and Blue sub-pixels unless
the number of Red and Blue Sub-Pixels Per Inch is very high. And it is for the
Galaxy S4 – there are 312 Red and Blue Sub-Pixels Per Inch, which is only a few
percent lower than Apple’s Benchmark 326 PPI iPhone Retina Display. Visually
the Galaxy S4 PenTile display delivers excellent visual sharpness across the
board.
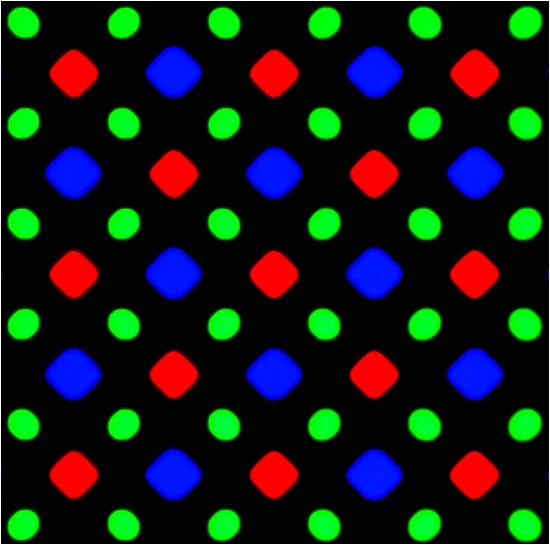
Diamond
Pixels
A high
resolution screen shot of the Galaxy S4 (provided by Samsung) shows an
interesting design and sub-pixel arrangement, which Samsung calls Diamond Pixels.
First of all, the Red, Green, and Blue sub-pixels have very different sizes –
Blue is by far the largest because it has the lowest efficiency, and Green is
by far the smallest because it has the highest efficiency. The alternating Red
and Blue sub-pixel PenTile arrangement discussed above leads to a 45 degree
diagonal symmetry in the sub-pixel layout. Then, in order to maximize the sub-pixel
packing and achieve the highest possible PPI, that leads to diamond rather than
square or stripe shaped Red and Blue sub-pixels. But not for the Green
sub-pixels, which are oval shaped because they are squeezed between two much
larger and different sized Red and Blue sub-pixels. It’s display art…
Digital Display Technology
Most consumers are not aware that LCDs are actually
non-linear analog displays that perform really well only as the result of
highly refined electronics and careful factory calibration. This is the same
reason why even living room HDTVs provide coarse and imprecise color and image
controls, and why professional calibration is desirable. One interesting
technical development is that the latest OLED displays use digital Pulse Width
Modulation to specify the brightness of every sub-pixel. This makes it possible
for OLED displays like the Galaxy S4 to precisely vary and directly digitally
control their Intensity Scales, Gamma values, White Points, color calibration
and color management of the display in firmware or software. Plasma and DLP
displays also use digital Pulse Width Modulation, but the OLED displays perform
better because of higher frequencies and faster response times.
Screen Modes
One important application of the Digital Display
Technology mentioned above is that this makes it relatively easy to provide a
number of different display calibration options and settings that will appeal
to differing consumer tastes and preferences under various viewing conditions
and applications. The Galaxy S4 (like its bigger cousin the Galaxy Note II)
includes 5 user selectable Screen Modes: Adaptive, Dynamic, Standard,
Professional Photo, and Movie, which we discuss below and include measurements
for the Standard and Movie Modes.
Color Gamut and Color Accuracy
The Galaxy S4 Movie Mode delivers the closest Color and
White Point calibration to the standard sRGB/Rec.709 consumer content that is
used for digital camera, HDTV, internet, and computer content, including
virtually all photos and videos. Use the Movie Mode for the best color and
image accuracy. Its Green primary is still somewhat too saturated – hopefully it
will get toned down some as in the Galaxy Note II, which is very accurate. The
Professional Photo Mode provides a fairly accurate calibration to the Adobe RGB
standard, which is rarely available in consumers displays, and is very useful
for high-end digital photography applications. The Standard Mode is the default
mode for the Galaxy S4 – it delivers higher color saturation, which appeals to
some, and is a better choice for high ambient light viewing conditions, which wash
out image colors and contrast. This mode is very similar to the Professional
Photo Mode, but has a more bluish White Point. Its Green primary is also too
saturated, but noticeably less than in the Galaxy S III. The Dynamic Mode
produces the most vibrant image and picture quality. Compare the Color Gamuts
in this Figure and
below.
Brightness and Power
Efficiency
OLED displays are generally not as bright as the
brightest LCD displays. There are two reasons for this: first, while OLED power
efficiency has been steadily improving they are not yet as power efficient as
the best LCDs. Second: there is a marketing obsession for producing ultra thin
and light weight Smartphones, which sacrifices much needed battery power. Since
the display often uses 50 percent or more of the total Smartphone power,
various display power management schemes are frequently used. The Galaxy S4
uses one innovative approach to overcome this – when Automatic Brightness is
turned on, the Peak Brightness becomes significantly brighter in high ambient
lighting than is possible with Manual Brightness, up to as high as 475 cd/m2,
which is 34 percent higher than is possible with Manual Brightness. This is
done so that users can’t permanently set the brightness to very high values,
which would run down the battery quickly.
Performance in High Ambient Lighting
Smartphones
are never used in the dark. In fact, they are often used in very bright ambient
lighting, which can significantly degrade and wash out their image and picture
quality. The Galaxy S4 performs very well in high ambient lighting in spite of
its typically lower screen brightness because it has one of the smallest screen
Reflectance values of any display we have ever tested, and its more saturated
colors can help cut through the reflected light glare. When Automatic
Brightness is turned on, the screen brightness increases considerably at high
levels of ambient lighting as mentioned above. The Galaxy S4 is then comparable
or brighter than most LCD Smartphones, but still 15 percent less than the much
smaller iPhone 5, which is the brightest Smartphone we have tested.
Viewing Tests
The Galaxy S4 Movie Mode provides very nice, pleasing,
and accurate colors and picture quality. The Movie Mode is recommended for
indoor and low ambient light viewing. The Standard Mode has significantly more
vibrant and saturated colors. Some people like that. The Standard Mode is
recommended for medium levels of ambient light viewing because it offsets some
of the reflected glare that washes out the images. The Dynamic Mode provides
incredibly powerful colors that are overwhelming in low ambient lighting. The
Dynamic Mode is recommended for high ambient light viewing only. For all of the
Modes a slight green color tint was sometimes noticeable, but not
objectionable. It results from the Green primary being more saturated than the
Red and Blue primaries, as shown in this Figure. Readjusting the internal
color management could fix this…
Comparing Displays on the Galaxy S III and Galaxy S4
The Galaxy S4 display is a major enhancement and
improvement over the Galaxy S III – a good reason to consider trading up. The
screen has Full HD 1920x1080 resolution with more than double the number of
pixels and with 44 percent higher Pixels Per Inch than the Galaxy S III. It is
25 percent brighter (and up to 68 percent brighter with Automatic Brightness)
and the display is 20 percent more power efficient. The Galaxy S4 also has 5
user selectable Screen Modes and delivers much better picture quality and color
accuracy.
Comparing the Galaxy S4 with the LCD Display on the iPhone 5
The
iPhone 5 is now more than half way through its product cycle, which is
important to keep in mind for our comparison. However, high-end LCDs like the
iPhone 5 are a very mature and refined display technology, so other than screen
size, resolution, and the Pixels Per Inch not much is likely to change in the
next generation, no matter what Apple decides to do. The iPhone 5 is
significantly brighter than the Galaxy S4, particularly for screens with mostly
peak white backgrounds. Its color calibration is a bit better, although the
Galaxy S4 has a more accurate White. The Galaxy S4 has a much bigger screen,
higher resolution, higher PPI, much darker blacks, and better screen uniformity
than the iPhone 5. They each have their own particular strengths and
weaknesses, but if you scan our color coordinated Comparison
Table below, both displays are quite good and comparable overall – so it’s
currently a tie – we’ll see how they both evolve and improve in the next
generation…
Conclusions: An Impressive OLED Display…
The
Galaxy S4 continues the rapid and impressive improvement in OLED displays and
technology. The first notable OLED Smartphone, the Google Nexus One, came in decidedly last
place in our 2010 Smartphone
Display Shoot-Out. In a span of just three years
OLED display technology is now challenging the performance of the best LCDs.
Each have their own particular strengths and weaknesses, but if you scan our
color coordinated Comparison
Table, both displays and technologies perform quite well and look quite
good and comparable overall – we’ll see how they both evolve and improve in the
next generation, which we consider next…
The biggest challenge for OLEDs is continuing to
improve their power efficiency and full screen peak brightness. We measured an
impressive 20 percent improvement in power efficiency between the Galaxy S4 and
S III, and a 25 percent
increase in brightness (and up to 68 percent with Automatic Brightness). If
this keeps up then OLEDs may pull ahead of LCDs in brightness and power
efficiency in the near future…
Of course, LCDs are not standing still either.
There has been a remarkable increase in their resolution and Pixels Per Inch.
IGZO and more advanced Metal Oxide backplanes will help to significantly
improve their efficiency and performance. Quantum Dots should help them to
efficiently enlarge their Color Gamuts to catch up with OLEDs, which is
important for delivering accurate color and image contrast in high ambient
lighting.
Both OLEDs and LCDs need to carefully expand
their color management and color calibration. The biggest improvements for
mobile displays will come from dynamically changing the display Color Gamuts
and Intensity Scales to automatically compensate and correct for reflected
glare and image wash out from ambient light. Which ever one succeeds is likely
to win in the next generation of mobile displays…
DisplayMate Display Optimization Technology
All
Smartphone and Tablets displays can be significantly improved using
DisplayMate’s advanced scientific analysis and mathematical display modeling
and optimization of the display hardware, factory calibration, and driver
parameters. We help manufacturers with expert display procurement and quality
control so they don’t make mistakes similar to those that are exposed in our
Display Technology Shoot-Out series. We can also improve the performance of any
specified set of display parameters. This article is a lite version of our
intensive scientific analysis – before the benefits of our DisplayMate Display Optimization
Technology, which can correct or improve all of these issues. If you are a
display or product manufacturer and want to significantly improve display
performance for a competitive advantage then Contact DisplayMate Technologies.
Display Shoot-Out Comparison Table
Below we
compare the display on the Samsung Galaxy S4 with the Samsung Galaxy S
III and Apple
iPhone 5 based on objective measurement data and criteria. For
additional background and information see the Flagship Smartphone
Display Technology Shoot-Out between the iPhone 5
and the Galaxy S III, and the Samsung
Galaxy S OLED Display Technology Shoot-Out that compares and analyzes the
evolution of the OLED displays on the Galaxy S I, II, and III.
|
Categories
|
Samsung
Galaxy S III
|
Samsung
Galaxy S4
|
Apple
iPhone 5
|
Comments
|
|
Display Technology
|
4.8 inch
PenTile
OLED
|
5.0 inch
PenTile
OLED
|
4.0 inch
IPS LCD
|
Organic Light Emitting Diode
Liquid Crystal Display with In Plane Switching
|
|
Screen Shape
|
16:9 =
1.78
Aspect
Ratio
|
16:9 =
1.78
Aspect
Ratio
|
16:9 =
1.78
Aspect
Ratio
|
The Galaxy S4 and Galaxy S III screens
have the
same shape as widescreen HDTV video
content.
|
|
Screen Area
|
9.8 Square
Inches
|
10.6
Square Inches
|
6.7 Square
Inches
|
A better measure of size than the
diagonal length.
|
|
Relative Screen Area
|
92 percent
|
100
percent
|
63 percent
|
Screen Area relative to the Galaxy S4.
|
|
Display Resolution
|
1280 x 720
pixels
|
1920 x
1080 pixels
|
1136 x 640
pixels
|
The more Pixels and Sub-Pixels the
better.
|
|
Pixels Per Inch
|
PenTile
306 PPI
Very Good
|
PenTile
441 PPI
Excellent
|
326 PPI
Excellent
|
At 12 inches from the screen 20/20
vision is 286 ppi.
See this on
the visual acuity for a true Retina Display
|
|
Sub-Pixels Per Inch
|
Red 216
SPPI
Green 306
SPPI
Blue 216
SPPI
|
Red 312
SPPI
Green 441
SPPI
Blue 312
SPPI
|
Red 326
SPPI
Green 326
SPPI
Blue 326
SPPI
|
PenTile displays have only half the
number of Red
and Blue Sub-Pixels as standard RGB
displays.
|
|
Total Number of Sub-Pixels
|
Red 462
KSP
Green 922
KSP
Blue 462
KSP
|
Red
1,037 KSP
Green
2,074 KSP
Blue
1,037 KSP
|
Red 727
KSP
Green 727
KSP
Blue 727
KSP
|
Number of Kilo Sub-Pixels KSP for Red,
Green, Blue.
PenTile displays have only half the
number of Red
and Blue Sub-Pixels as standard RGB
displays.
|
|
20/20 Vision Distance where Pixels
or Sub-Pixels are not resolved
|
11.2 inches White / Green
15.9
inches Red / Blue
|
7.8 inches White / Green
11.0
inches Red / Blue
|
10.5
inches for All
|
For 20/20 Vision the minimum Viewing
Distance
where the screen appears perfectly sharp
to the eye.
|
|
Gallery / Photo Viewer Color Depth
|
Full
24-bit color
No
Dithering Visible
256
Intensity Levels
|
Full
24-bit color
No
Dithering Visible
256
Intensity Levels
|
Full
24-bit color
No
Dithering Visible
256
Intensity Levels
|
Many Android Smartphones and Tablets
still have some
form of 16-bit color depth
in the Gallery Photo Viewer
Samsung Galaxy S4 and S III do not have this
issue.
|
|
|
Galaxy S III
|
Galaxy S4
|
iPhone 5
|
|
|
Overall Assessments
This section summarizes
the results of all of the extensive Lab measurements and viewing tests
performed on all of the displays.
|
|
Viewing Tests
in Subdued Ambient Lighting
|
Good
Images
Photos and
Videos
have too
much color
and
accurate contrast
|
Movie
Mode
Very Good
Images
Photos and
Videos
have very
good color
and
accurate contrast
|
Very Good
Images
Photos and
Videos
have
excellent color
and
accurate contrast
|
The Viewing Tests examined the accuracy
of
photographic images by comparing the
displays
to a calibrated studio monitor and HDTV.
|
|
Variation with Viewing Angle
|
Medium
Color Shifts
with
Viewing Angle
Medium
Brightness Shift
with
Viewing Angle
|
Medium
Color Shifts
with
Viewing Angle
Small
Brightness Shift
with
Viewing Angle
|
Small
Color Shifts
with
Viewing Angle
Large
Brightness Shift
with
Viewing Angle
|
The iPhone 5 LCD has a very large
Brightness
decrease with Viewing Angle but somewhat
smaller color shifts than the Galaxy S4.
|
|
Overall Display Assessment
Lab Tests and Measurements
|
Very Good OLED Display
|
Excellent OLED Display
|
Excellent LCD Display
|
The Galaxy S4 and iPhone 5 are both Best
of Breed.
|
|
Overall Display Calibration
Lab Tests and Viewing Tests
|
Calibration Needs
Major Improvement
|
Movie Mode
Very Good Calibration
|
Excellent Calibration
|
The iPhone 5 currently has a somewhat more
accurate calibration than the Movie Mode.
|
|
Overall Display Grade
|
B+
|
A
|
A
|
The Galaxy S4 and iPhone 5 displays both
have their strengths. Overall they are
both
excellent displays for the current
generation.
|
|
|
Galaxy S III
|
Galaxy S4
|
iPhone 5
|
|
|
Screen Reflections
All of these screens are large mirrors good enough
to use for personal grooming – but it’s actually a very bad feature…
We measured the light reflected from all directions
and also direct mirror (specular) reflections, which are much more
distracting and cause more eye strain. Many
Smartphones still have greater than 10 percent reflections that make the
screen much harder to read even in moderate ambient
light levels, requiring ever higher brightness settings that waste
precious battery power. Hopefully manufacturers
will reduce the mirror reflections with anti-reflection coatings and
matte or haze surface finishes.
|
|
Average Screen Reflection
Light From All Directions
|
Reflects
5.0 percent
Excellent
|
Reflects
4.4 percent
Excellent
|
Reflects
4.6 percent
Excellent
|
Measured using an Integrating
Hemisphere.
The best value we have measured is 4.4
percent
and the current worst is 14.8 percent.
|
|
Mirror Reflections
Percentage of Light Reflected
|
7.1 percent
Very Good
|
6.1 percent
Very Good
|
6.1 percent
Very Good
|
These are the most annoying types of
reflections.
Measured using a narrow collimated
pencil beam
of light reflected off the screen.
|
|
|
Galaxy S III
|
Galaxy S4
|
iPhone 5
|
|
|
Brightness and Contrast
The Contrast Ratio is the specification that gets
the most attention, but it only applies for low ambient light, which is
seldom
the case for mobile displays. Much more important
is the Contrast Rating, which indicates how easy it is to read the screen
under high ambient lighting and depends on both the
Maximum Brightness and the Screen Reflectance.
|
|
Measured Average Brightness
50% Average Picture Level
|
Brightness
251 cd/m2
Good
|
Brightness
313 cd/m2
Very Good
|
Brightness
556 cd/m2
Excellent
|
This is the Brightness for typical
screen content
that has a 50% Average Picture Level.
|
|
Measured Brightness
100% Full Screen White
|
Brightness
224 cd/m2
Poor
|
Brightness
287 cd/m2
Good
|
Brightness
556 cd/m2
Excellent
|
This is the Brightness for a screen that
is entirely
all white with 100% Average Picture
Level.
|
|
Measured Peak Brightness
1% Full Screen White
|
Brightness
283 cd/m2
Good
|
Brightness
355 cd/m2
Very Good
|
Brightness
556 cd/m2
Excellent
|
This is the Peak Brightness for a screen
that
has only a tiny 1% Average Picture
Level.
|
|
Measured Peak Brightness
with Automatic Brightness
|
Brightness
283 cd/m2
Good
|
Brightness
475 cd/m2
Excellent
|
Brightness
556 cd/m2
Excellent
|
Some Smartphones including the Galaxy S4
have higher Brightness in Auto
Brightness Mode.
|
|
Black Level
at Maximum Brightness
|
0 cd/m2
Outstanding
|
0 cd/m2
Outstanding
|
Black is
0.41 cd/m2
Very Good
for Mobile
|
Black brightness is important for low
ambient light,
which is seldom the case for mobile
devices.
|
|
Contrast Ratio
Relevant for Low Ambient Light
|
Infinite
Outstanding
|
Infinite
Outstanding
|
1,356
Very Good
for Mobile
|
Only relevant for low ambient light,
which is seldom the case for mobile
devices.
|
|
Contrast Rating
for High Ambient Light
|
45 - 57
Good
|
65 – 81
Auto
Brightness to 108
Very Good
|
121
Excellent
|
Defined as Maximum Brightness / Average Reflectance.
|
|
Screen Readability in Bright Light
|
Good B
Very Good B+
High Color Saturation
|
Very Good
A–
Excellent A
High Color Saturation
|
Excellent
A
|
Indicates how easy it is to read the
screen
under high ambient lighting. Very
Important!
See High
Ambient Light Screen Shots
|
|
|
Galaxy S III
|
Galaxy S4
|
iPhone 5
|
|
|
The Color Gamut, Intensity Scale, and White Point
determine the quality and accuracy of all displayed images and all
the image colors. Bigger is definitely Not Better
because the display needs to match all the standards that were used
when the content was produced. For LCDs a wider
Color Gamut reduces the power efficiency and the Intensity Scale
affects both image brightness and color mixture
accuracy.
|
|
White Color Temperature
Degrees Kelvin
|
7,860 K
Somewhat
Too Blue
|
7,186 K Standard Mode
6,591 K Movie Mode
Movie Mode
Excellent
|
7,461 K
Somewhat
Too Blue
|
D6500 is the standard color of White for
most
Content and needed for accurate color
reproduction.
|
|
Color Gamut
Measured in the dark at 0 lux
See Figure 1
|
Gamut Too
Large
139
percent
See Figure 1
|
Somewhat
Large
132 % Standard Mode
122 % Movie Mode
See Figure 1
|
Close to
Perfect
104 percent
See Figure 1
|
sRGB / Rec.709 is the color standard for
most
content and needed for accurate color
reproduction.
Note that Too Large a Color Gamut is
visually
worse than Too Small.
|
|
Dynamic Brightness
Reduction in Luminance with APL
|
21 percent
Good
|
18 percent
Good
|
None
Excellent
|
This is the percent Brightness reduction
with APL
Average Picture Level. Ideally should be
0 percent.
|
|
Intensity Scale and Image Contrast
See Figure 2
|
Very
Smooth
Contrast
is Very Good
See Figure 2
|
Very
Smooth
Contrast
is Very Good
See Figure 2
|
Very
Smooth
Contrast
is Very Good
See Figure 2
|
The Intensity Scale controls image
contrast needed
for accurate image reproduction. See Figure 2
|
|
Gamma for the Intensity Scale
Larger means more Image Contrast
See Figure 2
|
Very Good
2.38 But
Dim-end
Steepens 2.73
Slightly
Too High
|
Very Good
2.42
Straight
and Constant
Slightly
Too High
|
Very
Good 2.36
Straight
and Constant
Slightly
Too High
|
Gamma is the slope of the Intensity
Scale.
Gamma of 2.20 is the standard and needed
for
accurate image reproduction. See Figure 2
|
|
|
Galaxy S III
|
Galaxy S4
|
iPhone 5
|
|
|
Viewing Angles
The variation of
Brightness, Contrast, and Color with viewing angle is especially important
for Smartphones because of
their large screen and
multiple viewers. The typical manufacturer 176+ degree specification for LCD
Viewing Angle
is nonsense because that
is where the Contrast Ratio falls to a miniscule 10. For most LCDs there are
substantial
degradations at less
than ±30 degrees, which is not an atypical viewing angle for Smartphones.
Note that the Viewing
Angle performance is also very important for a single viewer because the
Viewing Angle varies
based on how the
Smartphone is held, and the angle can be very large if the Smartphone is
resting on a table or desk.
|
|
Brightness Decrease
at a 30 degree Viewing Angle
|
28
percent Decrease
Medium
Decrease
|
22
percent Decrease
Small
Decrease
|
60 percent
Decrease
Very Large
Decrease
|
Most screens become less bright when
tilted.
OLED decrease is due to anti-reflection
absorption..
LCD brightness variation is generally
very large.
|
|
Contrast Ratio
at a 30 degree Viewing Angle
|
Infinite
Outstanding
|
Infinite
Outstanding
|
594
Very Good
for Mobile
|
A measure of screen readability when the
screen
is tilted under low ambient lighting.
|
|
Primary Color Shifts
at a 30 degree Viewing Angle
|
Medium
Color Shift
Δ(u’v’)
= 0.0234
5.9 times
JNCD
|
Medium
Color Shift
Δ(u’v’)
= 0.0359
9.0 times
JNCD
|
Small
Color Shift
Δ(u’v’)
= 0.0077
1.9 times
JNCD
|
JNCD is a Just Noticeable Color Difference.
IPS LCDs have smaller color shifts with
angle.
|
|
Color Shifts for Color Mixtures
at a 30 degree Viewing Angle
Reference Brown (255, 128, 0)
|
Medium
Color Shift
Δ(u’v’)
= 0.0168
4.2 times
JNCD
|
Small
Color Shift
Δ(u’v’)
= 0.0076
1.9 times
JNCD
|
Small
Color Shift
Δ(u’v’)
= 0.0098
2.4 times
JNCD
|
JNCD is a Just Noticeable Color Difference.
Color Shifts for non-IPS LCDs are about 10
JNCD.
Reference Brown is a good indicator of
color shifts
with angle because of unequal drive
levels and
roughly equal luminance contributions
from
Red and Green.
|
|
|
Galaxy S III
|
Galaxy S4
|
iPhone 5
|
|
|
The display power was measured using a Linear
Regression between Luminance and AC Power with a fully charged battery.
Since the displays have different screen sizes and
maximum brightness, the values were also scaled to the
same screen brightness (Luminance) and screen area
in order to compare their relative Power Efficiencies.
|
|
Average Display Power
Maximum Brightness at
50% Average Picture Level
|
0.61 watts
|
0.70 watts
|
0.74 watts
|
This measures the average display power
for
typical image content.
|
|
Maximum Display Power
Full White Screen
at Maximum Brightness
|
1.30 watts
|
1.50 watts
|
0.74 watts
|
This measures the display power for a
screen
that is entirely all Peak White.
|
|
Display Average Power Efficiency
same Luminance
same 5.0 inch screen size area
|
0.83 watts
|
0.70 watts
|
0.66 watts
|
This compares the Average Power
Efficiency
by looking at the same screen brightness
and
same screen area.
|
|
|
Galaxy S III
|
Galaxy S4
|
iPhone 5
|
|
|
Running Time on Battery
The running time on battery was determined with the
Brightness sliders at Maximum, in Airplane Mode,
with no running
applications, and with Auto Brightness turned off.
Note that Auto Brightness can have a considerable
impact on running time but we found abysmal performance for
both the iPhone and Android Smartphones in our BrightnessGate analysis of Ambient Light Sensors
and Automatic
Brightness. They all need a more convenient Manual
Brightness Control as described in the BrightnessGate article.
|
|
Running Time
at the Average Display Power
|
Not Yet Available
Coming Soon
|
Not Yet Available
Coming Soon
|
6.6 hours
Very Good
|
Display always On at 50% APL power with
Airplane Mode and no running
applications.
|
|
Running Time
at the Maximum Display Power
|
5.6 hours
Very Good
|
Not Yet Available
Coming Soon
|
6.6 hours
Very Good
|
Display always On at Maximum power with
Airplane Mode and no running
applications.
|
|
Categories
|
Galaxy S III
|
Galaxy S4
|
iPhone 5
|
Comments
|
About the Author
Dr. Raymond Soneira is
President of DisplayMate Technologies Corporation of Amherst, New Hampshire,
which produces video calibration, evaluation, and diagnostic products for
consumers, technicians, and manufacturers. See www.displaymate.com. He is a research
scientist with a career that spans physics, computer science, and television
system design. Dr. Soneira obtained his Ph.D. in Theoretical Physics from
Princeton University, spent 5 years as a Long-Term Member of the world famous
Institute for Advanced Study in Princeton, another 5 years as a Principal
Investigator in the Computer Systems Research Laboratory at AT&T Bell
Laboratories, and has also designed, tested, and installed color television
broadcast equipment for the CBS Television Network Engineering and Development
Department. He has authored over 35 research articles in scientific journals in
physics and computer science, including Scientific American. If you have any
comments or questions about the article, you can contact him at dtso.info@displaymate.com.
DisplayMate Display Optimization Technology
All
Smartphone and Tablet displays can be significantly improved using
DisplayMate’s advanced scientific analysis and mathematical display modeling
and optimization of the display hardware, factory calibration, and driver
parameters. We help manufacturers with expert display procurement and quality
control so they don’t make mistakes similar to those that are exposed in our
Display Technology Shoot-Out series. We can also improve the performance of any
specified set of display parameters. This article is a lite version of our
intensive scientific analysis – before the benefits of our DisplayMate Display Optimization
Technology, which can correct or improve all of these issues. If you are a
display or product manufacturer and want to significantly improve display
performance for a competitive advantage then Contact DisplayMate Technologies.
About DisplayMate Technologies
DisplayMate Technologies specializes in proprietary
sophisticated scientific display calibration and mathematical display
optimization to deliver unsurpassed objective performance, picture quality and
accuracy for all types of displays including video and computer monitors,
projectors, HDTVs, mobile displays such as smartphones and tablets, and all
display technologies including LCD, OLED, 3D, LED, LCoS, Plasma, DLP and CRT. This article is a lite version of
our intensive scientific analysis of Smartphone and Smartphone mobile displays
– before the benefits of our advanced mathematical DisplayMate Display Optimization
Technology, which can correct or improve many of the display deficiencies. We offer DisplayMate display
calibration software for consumers and advanced DisplayMate display diagnostic
and calibration software for technicians and test labs.
For
manufacturers we offer Consulting Services that include advanced Lab testing
and evaluations, confidential Shoot-Outs with competing products, calibration
and optimization for displays, cameras and their User Interface, plus on-site
and factory visits. See our world renown Display Technology Shoot-Out
public article series for an introduction and preview. DisplayMate’s advanced scientific
optimizations can make lower cost panels look as good or better than more
expensive higher performance displays. For more information on our technology
see the Summary description of our Adaptive
Variable Metric Display Optimizer AVDO. If you
are a display or product manufacturer and want to turn your display into a
spectacular one to surpass your competition then Contact DisplayMate Technologies
to learn more.
Article Links: Display Technology Shoot-Out
Article Series Overview and Home Page
Copyright © 1990-2013 by DisplayMate
Technologies Corporation. All Rights Reserved.
This article, or any part
thereof, may not be copied, reproduced, mirrored, distributed or incorporated
into any other work without
the prior written permission of DisplayMate Technologies Corporation


