Surface RT Display Technology Shoot-Out
Microsoft Surface RT – Apple
iPad 3 – Samsung Galaxy Tab 10.1
Dr. Raymond M. Soneira
President, DisplayMate Technologies Corporation
Copyright © 1990-2012 by DisplayMate
Technologies Corporation. All Rights Reserved.
This article, or any part
thereof, may not be copied, reproduced, mirrored, distributed or incorporated
into any other work without
the prior written permission of DisplayMate Technologies Corporation
Introduction
The
new Windows Tablets, led by Microsoft’s Surface, provide a third major family of Tablets for
consumers and the computing world. The significance and stakes are enormous
because Tablets are among the most important developments in computing and
consumer products in the last 20 years. Like Google's Android Tablets, the
Windows Tablets will be made by many different manufacturers. And just like
Google’s Nexus, which provides reference designs for the Android product line,
Microsoft is producing its own Surface Tablets for the Windows product line.
With large numbers of
Tablets and Smartphones running virtually identical software, the display
becomes the single most important way for manufacturers to differentiate their
products – that’s been true for Android and the same will apply for Windows
devices. A top notch display makes everything that runs on a Tablet or
Smartphone look great or as good as possible – including all of the Apps, web
content, photos, and videos – looking a lot better than on devices with
inferior displays. The inferior displays will be either cheap low-end displays,
or expensive displays manufactured with bad parameter choices, or high quality
displays ruined through improper calibration at the factory. It will be
interesting to see which manufacturers play for the top, and those that try to
get away with playing the bottom…
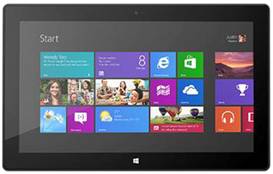
The Microsoft Surface
and all Windows Tablets are coming in two versions: the just launched Windows
RT with a 1366x768 display that we test here, and the Windows Pro Tablets with
a 1920x1080 display that will launch in early 2013. In this Display Shoot-Out
we’ll tell you all about the Microsoft Surface display with extensive Lab
measurements, viewing tests, and objective in-depth analysis. For other aspects
including its OS, Apps, and overall operation and functionality you'll need to
refer to reviews that cover these issues in detail but generally provide little
information about the display.
The Shoot-Out
To examine the performance of the Microsoft Surface RT we ran our in-depth series of Mobile Display Technology
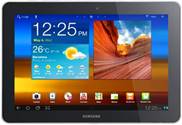
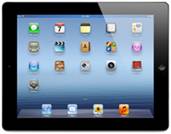
Shoot-Out tests and compared it to Apple iPad 3
and the Samsung Galaxy Tab 10.1. The Galaxy Tab
10.1 was chosen for this Shoot-Out because it has the best display performance
for the standard resolution 10 inch Android Tablets
in our Display Shoot-Out series. The Apple iPad 2 is
also included in the comparisons.
We take display quality very seriously and provide
in-depth objective analysis side-by-side comparisons based on detailed
laboratory measurements and extensive viewing tests with both test patterns and
test images. For additional background and information see the iPad Display Technology
Shoot-Out article that compares the iPad 2
and the new iPad 3, the 10 Inch Tablet Display
Technology Shoot-Out that compares 5 “popular” full size Tablets, and the 7 Inch Tablet
Display Technology Shoot-Out that compares the Amazon
Kindle Fire HD and the Google Nexus 7.
Results Highlights
In this Results section we provide Highlights of the
comprehensive lab measurements and extensive side-by-side visual comparisons
using test photos, test images and test patterns that are presented in later
sections. The Comparison
Table in the following section summarizes the Lab measurements in the
following categories: Screen Reflections, Brightness and Contrast, Colors and Intensities, Viewing Angles, Display Backlight Power Consumption, Running Time on Battery. You can also skip the Highlights
and go directly to the Conclusions.
Sharpness and Resolution:
The
Surface RT screen resolution of 1366x768 pixels is comparable to most existing
Tablets, but many of the latest Tablets have been launching at 1920x1080 or
above, which provides double the total number of pixels, and 50 percent greater
Pixels Per Inch, or more. Specs aside, what is the actual visual significance of the lower pixel
count? Most consumers are unlikely to notice much of a visual difference in
photos and videos because they are inherently fuzzy – it’s really only critical
for providing visually sharp text.
The
Surface RT uses Sub-Pixel Rendering (called ClearType in Microsoft’s
implementation) that in our tests significantly improves the visual sharpness
of text over standard Pixel Rendering that is used in most mobile displays. In
our comparison tests, text on the Surface RT was significantly sharper than on
the iPad 2 and all 1280x800 10 inch Android Tablets, but it wasn’t as sharp as
the iPad 3.
Screen Reflectance:
The screens on almost all Tablets and Smartphones are
mirrors good enough to use for personal grooming. Even in moderate ambient
lighting the image contrast and colors can noticeably degrade from ambient
light reflected by the screen, washing out the images and colors and producing
distracting mirror reflections superimposed on the screen. So low Reflectance
is extremely important in determining real world picture quality. The lower the
better…
Our
Lab measurements found the Surface RT to have the lowest Screen Reflectance of
any Tablet in our Display Shoot-Out article series. The Surface RT also has the
highest Contrast Rating for High Ambient Light for Tablets, which
quantitatively measures screen visibility under bright ambient lighting – the
higher the better… This article
has screen shots that show how screen images degrade in High Ambient Lighting.
Color Gamut and Color Accuracy:
While
the display Pixels Per Inch and pixel Resolution seem to get most of the
attention, it is the display’s Color Gamut together with the Factory Display
Calibration (below) that play the most important role in determining the Wow
factor and true picture quality and color accuracy of a display. The Color
Gamut is the range of colors that a display can produce. If you want to see
accurate colors in photos, videos, and all standard consumer content the
display needs to closely match the Standard Color Gamut that was used to
produce the content, which is called sRGB / Rec.709. Most of the existing LCD
Tablets and Smartphones have smaller Color Gamuts around 60 percent of the
Standard Gamut, which produces somewhat subdued colors. The main reason for
providing a smaller Color Gamut is to improve screen Brightness, Power
Efficiency, and Battery Running Time, which is important for many users.
The Surface RT has a smaller 57 percent Color Gamut,
which is disappointing in an otherwise excellent set of display performance
specifications. While that‘s comparable to most existing LCDs in Tablets and
Smartphones, many mobile displays are now coming with larger Color Gamuts from
80 to 100 percent, which significantly improves color saturation, accuracy, and
vividness.
Factory Display Calibration:
The
raw LCD panel hardware first needs to be adjusted and calibrated at the factory
with specialized firmware and software data that are downloaded into the device
in order for the display to produce a usable image – let alone an accurate and
beautiful one. This is actually a science but most manufacturers seem to treat
it as if it were a modern art form, so few Tablets, Smartphones, and even HDTVs
produce accurate high quality images.
Microsoft
has paid careful attention to factory display calibration unlike most other
manufacturers – including most of the Android and Nexus devices that we have
tested. The Surface RT has an accurate White Point and an accurate Intensity
Scale, which are both very important for accurate image reproduction. Apple has
been a leader in accurate display calibration, but all of the iPads and iPhones
that we have tested have White Points that are slightly too blue, which can
impart a cold or bluish caste to some images – such as in shifting the
complexions of faces slightly.
Viewing Tests:
Using our extensive library of challenging test and
calibration photos, we compared the Surface RT to a calibrated professional
studio monitor and to the new iPad 3, which has a virtually perfect Factory
Calibration and Color Gamut.
Images
on the Surface RT were accurate with good contrast, but with somewhat subdued
colors like most existing Tablets and Smartphones due to its smaller Color
Gamut. As a result, the Surface RT display was unable to produce very saturated
colors, like fire engine red, which was not as vibrant and appeared with a
noticeable shift towards orange. Very saturated purples are also especially
difficult to reproduce on LCD displays with a reduced color Gamut. For example,
the Surface RT appeared almost identical to the iPad 2 in this screen shot comparing
the iPad 2 to the new iPad 3.
Conclusions for the Microsoft Surface RT
Display
The
display on the Microsoft Surface RT outperforms all of the standard resolution
full size 10 inch Tablets that we have tested in our Display Shoot-Out series.
The Lab tests and measurements documented in the Shoot-Out Comparison
Table below indicate that Microsoft has paid a
lot of attention to display performance for the Surface RT. In particular,
on-screen text is significantly sharper, it has a better factory display
calibration, and also significantly lower screen Reflectance than the iPad 2
and all full size 1280x800 Android Tablets. But it is not as sharp as the iPad
3 or 4, nor does it have their large full Color Gamut. We’ll have to wait for
the high resolution Windows Pro Tablets that will be launching in early 2013
for direct comparisons with the high resolution iPads and Android Tablets. This
is a great start for Windows Tablets and brings much needed competition to the
Tablet marketplace. In addition, many other manufacturers will be launching
their own branded Windows RT and Pro Tablets – we’ll include the best of them
in future Mobile Display
Shoot-Outs.
Before
we discuss the comparisons with the Apple iPads and Android Tablets we’ll first discuss the principal issues
for the Surface RT display. The test and measurement details are provided in
the Comparison
Table below.
Screen
Resolution
The
1366x768 Surface RT screen resolution has been the source for lots of
discussions. While it’s comparable to most existing Tablets, many of the latest
Tablets have been launching at 1920x1080 or above, which provide double the
total number of pixels, and 50 percent greater Pixels Per Inch, or more. Specs
aside, what is the actual visual significance of the lower pixel count? While
most consumers are unlikely to notice much of a visual difference in photos and
videos because they are inherently fuzzy, where the higher pixel counts can
make a big difference is with small text and fine graphics.
Enhanced
Screen Sharpness
While
Screen Resolution gets lots of attention from both consumers and marketers –
it’s really only critical for providing visually sharp text – but that applies
for most applications running on a Tablet. As we have pointed out a
number of times, the best way to increase text visual sharpness on any display
is by using Sub-Pixel Rendering (performed in software). Surface RT and all
Windows displays use Sub-Pixel Rendering (called ClearType in Microsoft’s
implementation) that in our tests significantly improved the visual sharpness
of text over standard Pixel Rendering that is used in most mobile displays –
see the comparisons below. Finally, if the lower Screen Resolution spec is an
issue, simply wait for the Surface Pro and Window Pro Tablets with 1920x1080
resolution that will launch in early 2013. With their ClearType Sub-Pixel
Rendering they should provide visual text sharpness that is comparable to the
highest resolution Tablet displays being introduced.
Low
Screen Reflectance
Low
Screen Reflectance is very important because Tablets are almost never viewed in
the dark, so screen reflections often significantly degrade image quality,
color accuracy, and screen readability – washing out the images and colors and
producing distracting mirror reflections superimposed on the screen. As a
result, low Screen Reflectance is extremely important for real world visual
display performance and image quality. It also allows the display to run with
lower Screen Brightness settings, which extends the Battery Running Time. Our
Lab measurements found the Surface RT to have the lowest Screen Reflectance of
any Tablet in our Display Shoot-Out article series. For comparison, the iPad 3 reflects 33
percent more Ambient Light than the Surface RT and the Galaxy Tab 10.1 reflects
41 percent more. Mirror Reflections are 52 percent and 62 percent brighter than
the Surface RT. The Surface RT also has the highest Contrast Rating for High
Ambient Light
for Tablets, which quantitatively measures screen visibility under bright
ambient lighting – the higher the better… This article
has screen shots that show how screen images degrade in High Ambient Lighting.
Smaller
Color Gamut
The Surface RT has a smaller 57 percent Color Gamut,
which is disappointing in an otherwise excellent set of display performance
specifications. While that‘s comparable to most existing LCDs in Tablets and
Smartphones, many mobile displays are now coming with larger Color Gamuts from
80 to 100 percent of the sRGB / Rec.709 Standard, which significantly improves
color saturation, accuracy, and vividness. The subdued colors were quite
apparent in our photo comparison tests. The main reason for providing a smaller
Color Gamut is to improve screen Brightness, Power Efficiency, and Battery
Running Time. In that regard, the Surface RT has the second longest Battery
Running Time at Maximum Brightness for any Tablet that we have tested – for
many users that will be considered a good strategic tradeoff.
Comparisons
with the Android Tablets
The
Surface RT out performs the displays on all of the full size 10 inch 1280x800
Android Tablets that we have tested. However, the 7 inch Amazon Kindle Fire HD
and Google Nexus 7 have a larger 86 percent Color Gamut and much higher Pixels
Per Inch screens. In terms of visual sharpness, the Surface RT with ClearType
Sub-Pixel Rendering improves text sharpness significantly so that it is
significantly sharper than the Galaxy Tab 10.1 and other 10 inch 1280x800
Tablets, but not quite as sharp as the 7 inch Kindle Fire HD and Nexus 7 in our
visual comparison tests. The Kindle Fire HD has a very good factory calibration
like the Surface RT (but the Nexus 7 does not). We’ll compare the 1920x1200
Android Tablets with the 1920x1080 Surface Pro in a future Display Shoot-Out.
For details see the 10 Inch Tablet Display
Technology Shoot-Out and the 7 Inch Tablet
Display Technology Shoot-Out.
Comparisons
with the Apple iPads
The
Surface RT out performs the display on the iPad 2 across the board except for
the Color Gamut. The Surface RT is comparable or better than the iPad 3 in all
test categories except two: Screen Resolution and Color Gamut. The iPad 3 has a
much higher resolution of 2048x1536 and a much larger 99 percent Color Gamut.
In terms of visual sharpness, the Surface RT with ClearType Sub-Pixel Rendering
improves text sharpness significantly so that it is significantly sharper than
the iPad 2, but not as sharp as the iPad 3. In terms of the Color Gamut, the
new iPad 3 has significantly better color saturation and color accuracy. While
the Surface RT Color Gamut is similar to the iPad 2, the iPad 2 has somewhat
better color saturation because of its steeper Intensity Scale and Gamma (as
explained in Figure 3
below). For details see the new iPad 3 and
iPad 2 Display Technology Shoot-Out.
The
Next Generation of Tablet Displays
See
our new
iPad Shoot-Out Conclusion for a discussion of the many improvements that
are needed for the next generation of Tablet displays.
DisplayMate Display Optimization Technology
All Tablet
and Smartphone displays can be significantly improved using DisplayMate’s
advanced scientific analysis and mathematical display modeling and optimization
of the display hardware, factory calibration, and driver parameters. We help
manufacturers with expert display procurement and quality control so they don’t
make mistakes similar to those that are exposed in our Display Technology
Shoot-Out article series. We can also improve the performance of any specified
set of display parameters. This article is a lite version of our intensive
scientific analysis – before the benefits of our DisplayMate Display Optimization
Technology, which can correct or improve all of these issues. If you are a
display or product manufacturer and want to significantly improve display
performance for a competitive advantage then Contact DisplayMate Technologies.
Display Shoot-Out Comparison Table
Below we
compare the display on the Microsoft Surface RT to the Apple iPad 3 and the Samsung Galaxy Tab
10.1 based on objective measurement
data and criteria. We also include some comparisons with the Apple iPad 2. The Samsung
Galaxy Tab 10.1 was chosen because it has the best display performance
for the standard resolution 10 inch Android Tablets
in our Display Shoot-Out series. Note that the Tablets were all purchased
independently by DisplayMate Technologies through standard retail channels.
For additional background and information see the iPad Display Technology
Shoot-Out article that compares the iPad 2
and the new iPad 3, the 10 Inch Tablet Display
Technology Shoot-Out that compares 5 “popular” full size Tablets, and the 7 Inch Tablet
Display Technology Shoot-Out that compares the Amazon
Kindle Fire HD and the Google Nexus 7.
|
Categories
|
Samsung
Galaxy
Tab 10.1
|
Microsoft
Surface
RT
|
Apple
new iPad
3
|
Comments
|
|
Screen Diagonal Size
Display Technology
|
10.1 inch
PLS LCD
|
10.6 inch
PLS LCD
|
9.7 inch
IPS LCD
|
Liquid Crystal Display
Plane to Line Switching or In Plane Switching
IPS and PLS LCDs have wide viewing angles.
|
|
Screen Shape
|
16:10 = 1.60
Aspect
Ratio
|
16:9 =
1.78
Aspect
Ratio
|
4:3 =
1.33
Aspect
Ratio
|
The Surface screen has the same shape as
HDTVs.
The iPad screen has the same shape as 8.5x11
paper.
|
|
Screen Area
|
45.8
Square Inches
|
48.0
Square Inches
|
45.2
Square Inches
|
A better measure of size than the
diagonal length.
|
|
Relative Screen Area
|
95 percent
|
100
percent
|
94 percent
|
Screen Area relative to the Surface RT.
|
|
Display Resolution
|
1280 x 800
pixels
|
1366 x 768
pixels
|
2048 x
1536 pixels
|
The more Pixels and Sub-Pixels the
better.
|
|
Active Display Area
|
1280 x 752
pixels
|
1366 x 768
pixels
|
2048 x
1536 pixels
|
The Galaxy Tab reserves 48 pixels for a
navigation bar.
|
|
Pixels Per Inch
|
149 ppi
Good
|
148 ppi
Good
|
264 ppi
Excellent
|
At 12 inches from the screen 20/20 vision
is 286 ppi.
See this on
the visual acuity for a true Retina Display
|
|
20/20 Vision Retina Display
down to this Viewing Distance
|
20/20
“Retina Display”
to 23
inches Viewing
|
20/20
“Retina Display”
to 23
inches Viewing
|
20/20
“Retina Display”
to 13
inches Viewing
|
For 20/20 Vision the minimum Viewing
Distance
where the screen appears perfectly sharp
to the eye.
|
|
Pixels Per Square millimeter
|
34 ppmm2
|
34 ppmm2
|
108 ppmm2
|
Image elements like text letters are
seen as
2D objects drawn as a small area of
pixels.
|
|
Sub-Pixel Rendering
Improves Sharpness
|
No
Pixel
Rendering
|
Yes
Text and
Graphics
|
No
Pixel
Rendering
|
Sub-Pixel Rendering improves visual
image
sharpness for Text and Graphics.
|
|
Small Text Readability
|
Somewhat
Fuzzy
|
Reasonably
Good
|
Excellent
|
Perceived visual sharpness reading small
text such
as on The New York Times website front
page.
|
|
Gallery / Photo Viewer Color Depth
|
Full
24-bit color
No
Dithering Visible
256
Intensity Levels
|
Full
24-bit color
No
Dithering Visible
256
Intensity Levels
|
Full
24-bit color
No
Dithering Visible
256
Intensity Levels
|
Many Android Tablets and Smartphones
still have some
form of 16-bit color depth
in the Gallery Photo Viewer
|
|
|
Galaxy
Tab 10.1
|
Surface
RT
|
new iPad
3
|
|
|
Overall Assessments
This section summarizes
the results of all of the extensive Lab measurements and viewing tests
performed on all of the displays.
|
|
Viewing Tests
|
Good
Images
Photos and
Videos
have too
much color
and too
much contrast
|
Good
Images
Photos and
Videos
have too
little color
and
accurate contrast
|
Very Good
Images
Photos and
Videos
have
accurate color
and
accurate contrast
|
The Viewing Tests examined the accuracy
of
photographic images by comparing the
displays
to a calibrated studio monitor and HDTV.
|
|
Variation with Viewing Angle
|
Small
Color Shifts
with
Viewing Angle
Large
Brightness Shift
with
Viewing Angle
|
Small
Color Shifts
with
Viewing Angle
Large
Brightness Shift
with
Viewing Angle
|
Small
Color Shifts
with
Viewing Angle
Large
Brightness Shift
with
Viewing Angle
|
IPS and PLS LCDs have Small Color
Shifts.
TN LCDs have Large Color Shifts.
All LCDs have Large Brightness Shifts
|
|
Viewing the Screen with
Polarized Sunglasses
|
No Extinction
View Any Orientation
|
No Extinction
View Any Orientation
|
Portrait Extinction
View in Landscape
|
Polarized Sunglasses are increasingly
popular,
which often makes the screen invisible
black for
certain orientations.
|
|
Overall Display Assessment
Lab Tests and Viewing Tests
|
Very Good Display
Good Calibration
|
Very Good Display
Very Good Calibration
|
Excellent Display
Excellent Calibration
|
Lab and Viewing Test Assessments
|
|
Major Display Weaknesses
|
Higher Reflectance
Smaller Color Gamut
|
Smaller Color Gamut
|
Higher
Reflectance
|
Notable Display Weaknesses
|
|
Major Display Strengths
|
Brighter Display
|
Low Reflectance
Sub-Pixel Rendering
|
Accurate Color Gamut
Very Sharp Display
|
Notable Display Strengths
|
|
Current Overall Display Grade
|
Good B+
|
Very Good A–
|
Excellent A
|
Our Overall Assessments based on all
criteria
|
|
|
Galaxy
Tab 10.1
|
Surface
RT
|
new iPad
3
|
|
|
All of these screens are large mirrors good enough
to use for personal grooming – but it’s actually a very bad feature…
We measured the light reflected from all directions
and also direct mirror (specular) reflections, which are much more
distracting and cause more eye strain. The 10 – 15
percent reflections can make the screen much harder to read even
in moderate ambient light levels, requiring ever
higher brightness settings that waste precious battery power. Hopefully
manufacturers will reduce the mirror reflections
with anti-reflection coatings and haze surface finishes.
Low Screen Reflectance
is extremely important because the Tablets are generally viewed in moderate
to high Ambient Lighting.
Screen readability, picture quality, color
accuracy, and gray scale accuracy are all adversely affected by reflections.
As a result screen Reflectance is much more
important than Black Level and Contrast Ratio, and even Screen Brightness.
The Surface RT has the lowest
Reflectance we have measured for all of the Tablets in our Display
Shoot-Outs.
The iPad 3 reflects 33 percent more
Ambient Light than the Surface RT and the Galaxy Tab 10.1 reflects 41 percent
more.
The iPad 3 has 52 percent brighter Mirror
Reflections than the Surface RT and the Galaxy Tab 10.1 has 62 percent more.
|
|
Cover Glass
with Air Gap or Bonded to Display
See Figure 1
|
Cover Glass Bonded
No Air Gap
|
Cover
Glass Bonded
No Air Gap
|
Air Gap
|
A Cover Glass with an Air Gap is easier
to
manufacture. Optical Bonding reduces
both
external and internal Reflections. See Figure 1
|
|
Average Screen Reflections
Percentage of Reflected
Light From All Directions
|
Reflects 8.2 percent
Good
|
Reflects
5.8 percent
Very Good
|
Reflects
7.7 percent
Very Good
|
Measured using an Integrating Hemisphere
that
produces a uniform anisotropic light
distribution.
|
|
Specular Mirror Reflections
Percentage of Light Reflected
See Figure 1
|
Reflects 10.5 percent
Poor
|
Reflects 6.5 percent
Very Good
|
Reflects 9.9 percent
Good
|
These are the most annoying types of
reflections.
Measured using a narrow collimated
pencil beam of
light reflected off the screen. See Figure 1
|
|
|
Galaxy
Tab 10.1
|
Surface
RT
|
new iPad
3
|
|
|
Brightness and Contrast
The Contrast Ratio is the specification that gets
the most attention, but it only applies for low ambient light, which is
seldom
the case for mobile displays. Much more important
is the Contrast Rating, which indicates how easy it is to read the screen
under high ambient lighting and depends on both the
Maximum Brightness and the Screen Reflectance.
All of the Tablets have comparable
Brightness and Contrast Ratios, but Contrast Ratio is only relevant for low
ambient light.
The Surface RT has the Best Contrast
Rating for High Ambient Light for all of the Tablets in our Display
Shoot-Outs.
|
|
Measured Maximum Brightness
is the Peak Luminance for White
|
Brightness
464 cd/m2
Very Good
|
Brightness
428 cd/m2
Very Good
|
Brightness
421 cd/m2
Very Good
|
Maximum Brightness is very important for
mobile
because of the typically high ambient
light levels.
|
|
Black Level
at Maximum Brightness
|
Black is
0.51 cd/m2
Very Good
for Mobile
|
Black is
0.39 cd/m2
Very Good
for Mobile
|
Black 0.48
cd/m2
Very Good
for Mobile
|
Black brightness is important for low
ambient light,
which is seldom the case for mobile
devices.
|
|
Contrast Ratio
Relevant for Low Ambient Light
|
916
Very Good
for Mobile
|
1,097
Very Good
for Mobile
|
877
Very Good
for Mobile
|
Measured in absolute darkness.
Only relevant for low ambient light.
|
|
Contrast Rating
for High Ambient Light
|
57
Good
|
74
Very Good
|
55
Good
|
Visual Contrast in High Ambient Lighting.
Defined as Maximum Brightness / Average Reflectance.
|
|
Screen Readability in Bright Light
|
Good B+
|
Very Good A–
|
Good B+
|
Indicates how easy it is to read the
screen
under high ambient lighting. Very
Important!
See High
Ambient Light Screen Shots
|
|
|
Galaxy
Tab 10.1
|
Surface
RT
|
new iPad
3
|
|
|
The Color Gamut, Intensity Scale, and White Point
determine the quality and accuracy of all displayed images and all
the image colors. Bigger is definitely Not Better
because the display needs to match all the standards that were used
when the content was produced. For LCDs a wider
Color Gamut reduces the power efficiency and the Intensity Scale
affects both image brightness and color mixture
accuracy.
The Surface RT is very well calibrated
but its Color Gamut is at the low end of what we have seen in Tablets and
Smartphones.
Some important issues regarding the
Color Gamut are explained in Figure 2
and the Intensity Scale in Figure
3.
|
|
White Color Temperature
|
8,380
degrees Kelvin
White is
Too Blue
|
6,571
degrees Kelvin
Close to
Standard
|
7,085 degrees
Kelvin
Somewhat
Too Blue
|
D6500 is the standard color of White for
most content
and necessary for accurate color
reproduction.
|
|
Color Gamut
See Figure 2
|
64 percent
of Std
Gamut Too Small
See Figure 2
|
57 percent
of Std
Gamut Too
Small
See Figure 2
|
99 percent
of Std
Gamut
Excellent
See Figure 2
|
sRGB / Rec.709 is the color standard for
most
content and needed for accurate color
reproduction.
Note that Too Large a Color Gamut is
visually
worse than Too Small.
|
|
Dynamic Contrast or Backlight
|
None
Excellent
|
None
Excellent
|
None
Excellent
|
Many manufacturers manipulate the
Intensity Scale
and Backlight based on image content.
That results
in inaccurate colors and images.
|
|
Intensity Scale and Image Contrast
See Figure 3
|
Very
Smooth But
Contrast
is Too High
See Figure 3
|
Very
Smooth
Contrast
is Very Good
See Figure 3
|
Very
Smooth
Contrast
is Perfect
See Figure 3
|
The Intensity Scale controls Image
Contrast needed
for accurate image reproduction. See Figure 3
|
|
Gamma for the Intensity Scale
Larger means more Image Contrast
See Figure 3
|
Good 2.32
– 2.77
Gamma Too High
Systematically
Increases
|
Very Good
2.14
Gamma
Slightly Low
|
Outstanding
2.20
Gamma is
Perfect
|
Gamma is the slope of the Intensity
Scale.
Gamma of 2.20 is the standard and needed
for
accurate image reproduction. See Figure 3
|
|
|
Galaxy
Tab 10.1
|
Surface
RT
|
new iPad
3
|
|
|
Viewing Angles
The variation of
Brightness, Contrast, and Color with viewing angle is especially important
for Tablets because of
their large screen and
multiple viewers. The typical manufacturer 176+ degree specification for LCD
Viewing Angle
is nonsense because that
is where the Contrast Ratio falls to a miniscule 10. For most LCDs there are
substantial
degradations at less
than ±30 degrees, which is not an atypical viewing angle for Tablets. IPS and
PLS LCDs do well.
Note
that the Viewing Angle performance is also very important for a single viewer
because the Viewing Angle
varies
based on how the Tablet is held, and the angle can be very large if the
Tablet is resting on a table or desk.
All
of these Tablets have LCDs that perform very well with similar Viewing Angle
performance.
|
|
Brightness Decrease
at a 30 degree Viewing Angle
|
52 percent
Decrease
Falls to
224 cd/m2
Very Large
Decrease
|
53
percent Decrease
Falls to
201 cd/m2
Very Large
Decrease
|
57
percent Decrease
Falls to
182 cd/m2
Very Large
Decrease
|
Most screens become less bright when
tilted.
LCD brightness variation is generally
very large.
|
|
Contrast Ratio
at a 30 degree Viewing Angle
|
518
Very Good
for Mobile
|
622
Very Good
for Mobile
|
528
Very Good
for Mobile
|
A measure of screen readability when the
screen
is tilted under low ambient lighting.
|
|
Primary Color Shifts
at a 30 degree Viewing Angle
|
Small
Color Shift
Δ(u’v’)
= 0.0048
1.2 times
JNCD
|
Small
Color Shift
Δ(u’v’)
= 0.0054
1.3 times
JNCD
|
Small
Color Shift
Δ(u’v’)
= 0.0046
1.2 times
JNCD
|
JNCD is a Just Noticeable Color Difference.
IPS and PLS LCDs have smaller color
shifts.
|
|
Color Shifts for Color Mixtures
at a 30 degree Viewing Angle
Reference Brown (255, 128, 0)
|
Small
Color Shift
Δ(u’v’)
= 0.0034
0.8 times
JNCD
|
Small
Color Shift
Δ(u’v’)
= 0.0056
1.4 times
JNCD
|
Small
Color Shift
Δ(u’v’)
= 0.0073
1.8 times
JNCD
|
JNCD is a Just Noticeable Color Difference.
Reference Brown is a good indicator of
color shifts
with angle because of unequal drive
levels and
roughly equal luminance contributions
from
Red and Green.
|
|
|
Galaxy
Tab 10.1
|
Surface
RT
|
new iPad
3
|
|
|
The Display Backlight power does not include the
power used by the LCD itself or by the display electronics.
Since the displays have different screen sizes and
maximum brightness, the values are also scaled to the
same screen brightness (Luminance) and screen area
in order to compare their relative Power Efficiencies.
The Surface RT is significantly more
Power Efficient than both the Galaxy Tab 10.1 and the new iPad 3.
This is consistent with its much longer
Running Time on Battery, below.
|
|
Display Backlight Power
at Maximum Brightness
|
4.7 watts
|
2.3 watts
|
7.0 watts
|
Lower power consumption is important for
energy
efficiency and improving running time on
battery.
|
|
Display Backlight Power Efficiency
same Peak Luminance 428 cd/m2
same 10.6 inch screen size area
|
4.5 watts
|
2.3 watts
|
7.6 watts
|
This compares the Relative Power
Efficiency
by looking at the same screen brightness
and
screen area.
|
|
|
Galaxy
Tab 10.1
|
Surface
RT
|
new iPad
3
|
|
|
Running Time on Battery
The running time on battery was determined with the
Brightness sliders at Maximum, in Airplane Mode,
with no running applications, and with Auto Brightness
turned off.
Note that Auto Brightness can have a considerable
impact on running time but we found abysmal performance for
both the iPhone and Android Smartphones in our BrightnessGate analysis of Ambient Light Sensors
and Automatic
Brightness. They all need a more convenient Manual
Brightness Control as described in the BrightnessGate article.
The Surface RT has the second longest
Battery Running Time at Maximum Brightness for any Tablet we have tested.
Since the display consumes the most
device power, the Running Times at lower Brightness settings will be longer.
|
|
Running Time
At the Maximum Brightness Setting
|
4.8 hours
|
8.1 hours
|
5.8 hours
|
Display always On at the Maximum setting
with
Airplane Mode and no running
applications.
|
|
Categories
|
Galaxy
Tab 10.1
|
Surface
RT
|
new iPad
3
|
Comments
|
About the Author
Dr. Raymond Soneira is
President of DisplayMate Technologies Corporation of Amherst, New Hampshire,
which produces video calibration, evaluation, and diagnostic products for
consumers, technicians, and manufacturers. See www.displaymate.com. He is a research
scientist with a career that spans physics, computer science, and television
system design. Dr. Soneira obtained his Ph.D. in Theoretical Physics from
Princeton University, spent 5 years as a Long-Term Member of the world famous
Institute for Advanced Study in Princeton, another 5 years as a Principal
Investigator in the Computer Systems Research Laboratory at AT&T Bell
Laboratories, and has also designed, tested, and installed color television
broadcast equipment for the CBS Television Network Engineering and Development
Department. He has authored over 35 research articles in scientific journals in
physics and computer science, including Scientific American. If you have any
comments or questions about the article, you can contact him at dtso.info@displaymate.com.
DisplayMate Display Optimization Technology
All Tablet
and Smartphone displays can be significantly improved using DisplayMate’s
advanced scientific analysis and mathematical display modeling and optimization
of the display hardware, factory calibration, and driver parameters. We help
manufacturers with expert display procurement and quality control so they don’t
make mistakes similar to those that are exposed in our Display Technology
Shoot-Out series. We can also improve the performance of any specified set of
display parameters. This article is a lite version of our intensive scientific
analysis – before the benefits of our DisplayMate Display Optimization
Technology, which can correct or improve all of these issues. If you are a
display or product manufacturer and want to significantly improve display
performance for a competitive advantage then Contact DisplayMate Technologies.
About DisplayMate Technologies
DisplayMate Technologies specializes in proprietary
sophisticated scientific display calibration and mathematical display
optimization to deliver unsurpassed objective performance, picture quality and
accuracy for all types of displays including video and computer monitors,
projectors, HDTVs, mobile displays such as smartphones and tablets, and all
display technologies including LCD, OLED, 3D, LED, LCoS, Plasma, DLP and CRT. This article is a lite version of
our intensive scientific analysis of Tablet and Smartphone mobile displays –
before the benefits of our advanced mathematical DisplayMate Display Optimization
Technology, which can correct or improve many of the display deficiencies. We offer DisplayMate display
calibration software for consumers and advanced DisplayMate display diagnostic
and calibration software for technicians and test labs.
For manufacturers
we offer Consulting Services that include advanced Lab testing and evaluations,
confidential Shoot-Outs with competing products, calibration and optimization
for displays, cameras and their User Interface, plus on-site and factory
visits. See our world renown Display
Technology Shoot-Out public article series for an introduction and preview.
DisplayMate’s
advanced scientific optimizations can make lower cost panels look as good or
better than more expensive higher performance displays. For more information on
our technology see the Summary description of our Adaptive Variable Metric Display
Optimizer AVDO. If you are a display or product
manufacturer and want to turn your display into a spectacular one to surpass
your competition then Contact
DisplayMate Technologies to learn more.
Article Links: new iPad 3
and iPad 2 Display Technology Shoot-Out
Article Links: 7
Inch Tablet Display Technology Shoot-Out
Article Links: Display Technology Shoot-Out
Article Series Overview and Home Page
Copyright © 1990-2012 by DisplayMate
Technologies Corporation. All Rights Reserved.
This article, or any part
thereof, may not be copied, reproduced, mirrored, distributed or incorporated
into any other work without
the prior written permission of DisplayMate Technologies Corporation