Galaxy S10 OLED Display Technology Shoot-Out
Dr. Raymond M. Soneira
President, DisplayMate Technologies
Corporation
Copyright © 1990-2019 by DisplayMate
Technologies Corporation. All Rights Reserved.
This article, or any part
thereof, may not be copied, reproduced, mirrored, distributed or incorporated
into any other work without
the prior written permission of DisplayMate Technologies Corporation
|
Galaxy S10
|
Introduction and Overview
The key element for a great
Smartphone has always been a truly innovative and top performing display, and
the best leading edge Smartphones have always flaunted their super high tech
displays. It is the display performance that determines how good and how
beautiful everything on the Smartphone looks, including the camera photos and
all of your Apps, and also how readable and how usable the screen is in high
ambient lighting. The Display is the crown jewel of the Smartphone!
The Galaxy S10 is Samsung’s newest flagship Smartphone
with the latest most advanced state-of-the-art OLED
Display with a Full Screen design. With
mobile OLED display technology advancing faster than ever, there are many
important new display performance enhancements and improvements. The Galaxy S10 has the latest dual-edge curved screen Flexible OLEDs, which are developed and manufactured
by Samsung Display.
Every new OLED generation has provided significant enhancements and
improvements that are first introduced in the Samsung Galaxy Smartphones.
The level of Display
Performance and Excellence has been increasing each year, and the Galaxy S10
has again Raised the Bar significantly higher.
Record Setting Display Performance Improvements for the
Galaxy S10
OLED has evolved into a highly refined and mature display technology
that now produces the best and highest performance displays for Smartphones.
OLED Display Performance continues to provide major Record Setting
improvements with every new generation. For the Galaxy
S10, Samsung has concentrated on
significantly raising the on-screen Absolute Picture
Quality and Absolute Color Accuracy of
the OLED display by implementing Precision Factory
Display Calibration, moving the overall Galaxy
S10 display performance up to impressive Record Setting Outstanding levels
with over a dozen Display Performance Records,
including Absolute Color Accuracy at a very
impressive 0.4 JNCD that is Visually Indistinguishable From Perfect. The Galaxy S10 is the most Color Accurate Display that we
have ever tested.
This shift in emphasis from
primarily improving the Display Hardware Performance to enhancing the overall
display Picture Quality and Color Accuracy is an important step that
DisplayMate Technologies has been pushing for many years in our Display Technology Shoot-Out
article series, so it is great to see manufacturers improving and competing on
these metrics.
The Galaxy S10 OLED Hardware
Performance has also been significantly improved, for example with a
Record Peak Brightness of 1,215 nits, a 17% Brightness increase in the High Brightness Mode over the Galaxy S9, providing
much higher screen visibility and readability in High Ambient Light.
As a result of the
continuing improvements in display performance, we have added a new set of Advanced Color Accuracy tests and we have also Raised the Performance Bar in order to receive
DisplayMate’s Very Good Ratings for our Color
Accuracy and Intensity Scale measurements and results, which are highlighted in
Green in the Measurement Results Table.
Even with our new tougher grading standards and new tests,
the Galaxy S10 receives 100% All Green Very Good to Excellent Ratings in All
Categories, earning DisplayMate’s highest ever A+ grade.
In this article we Lab test, measure, analyze, and evaluate in-depth the
display on the Galaxy S10. This is an
independent scientific objective Lab test and analysis of OLED displays written
for consumers and journalists. It is the latest edition in our nine year
article series that has Lab tested, tracked and analyzed the development of
mobile OLED displays and display technology, from its early beginnings in 2010,
when OLED displays started out in last place, into a rapidly improving and
evolving display technology that now has a commanding first place lead and
continues pushing ahead aggressively.
The Move to OLED Displays
LCDs are a great cutting edge high performance display technology for
Tablets to TVs, but for small handheld Smartphones, OLED displays provide a
number of significant advantages over LCDs including: being much thinner, much
lighter, without needing a bezel providing a rimless edge-to-edge design. They
can be made flexible and into curved screens, plus they have a very fast
response time, better viewing angles, and an always-on display mode.
Many of the OLED performance advantages result from the fact that every
single sub-pixel in an OLED display is independently directly electrically
powered to emit light, so only the active image sub-pixels draw power based on
their individual brightness levels. OLEDs can also provide better color
accuracy, image contrast accuracy, and screen uniformity because the
irregularities and variations in LCD Backlights introduce color and brightness
irregularities and variations over the screen.
As the result of their very versatile power management capabilities,
OLEDs are not only more power efficient than LCDs for most image content, but
they now deliver much higher Peak Brightness than LCDs because the maximum
power can be delivered to just the sub-pixels that are needed for producing the
current image. However, for mostly all white screen content LCDs are likely to
remain brighter and more power efficient for a while.
OLED
displays now have tremendous performance advantages over LCDs, so high-end and
flagship Smartphones need OLED displays in order to compete at state-of-the-art
performance levels, securing OLED as the definitive premier display technology
for Top Tier Smartphones in the foreseeable future over the next 3-5 years.
With the continuing improvements in OLED hardware performance, picture quality,
and precision accuracy, it will be much harder for new display technologies to
challenge OLED.
Some of the Galaxy S10 Display Highlights
These are a few of the Galaxy
S10 Display Highlights that we will be covering in detail throughout the
article:
· Record Very High Absolute
Color Accuracy (0.4 JNCD) that is Visually
Indistinguishable From Perfect.
· Record Very High Image
Contrast Accuracy and Intensity Scale Accuracy that is Visually Indistinguishable From Perfect.
· Record High Brightness Mode
that is up to 17% Brighter (1,215 nits) than
the Galaxy S9 in High Ambient Light.
· Record
Peak Luminance, Color
Accuracy and Intensity Scales that are Independent of the on-screen image content.
· Record
Small Shifts in Brightness and Color with Viewing
Angle, particularly White, which is the
most used background color.
· Record Setting Galaxy S10
matches or sets over a dozen new Smartphone Display
Performance Records, earning DisplayMate’s highest ever A+ grade.
· Highlights: The Highlights and Performance Results section below
has detailed information and analysis on the Galaxy S10 display.
· Features: The Display Performance Functions
and Features section lists all of the major functions and features.
· Records: The Display
Performance Records section lists the Lab Measurement performance records.
· Data: The Display Shoot-Out Lab
Measurements Comparison Table has all of the detailed measurements and test
details.
· Conclusions: You can also go directly to the Galaxy S10 Conclusions section which summarizes all of
the Features, Functions and Results.
We’ll cover all of the these display performance topics and much
more, with in-depth expert comprehensive display tests, measurements and
analysis that you will find nowhere else.
Article Overview
This article has the following major sections:
· Galaxy S10
Highlights and Performance Results
· Galaxy S10
Conclusions
· Galaxy
S10 Display Performance Functions and Features
· Galaxy
S10 Display Performance Records
· The Future of
OLED Smartphones
· Improving
Display Performance for Real World Ambient Light
· Galaxy S10 Lab
Measurements Comparison Table
The Display Shoot-Out
To examine the
performance of the new Galaxy S10 OLED Display
we ran our in-depth series of Mobile
Display Technology Shoot-Out Lab Tests and Measurements in order to
determine how the latest OLED displays have improved. We take display quality
very seriously and provide in-depth objective analysis based on detailed
laboratory tests and measurements and extensive viewing tests with both test patterns,
test images and test photos. To see how far OLED and LCD mobile displays have
progressed see our 2010 Smartphone
Display Shoot-Out, and for a real history lesson see our original 2006 Smartphone Display
Shoot-Out.
Samsung provided DisplayMate Technologies with pre-release production
units of the Galaxy S10 so that we could perform our well known objective and
comprehensive DisplayMate Lab tests, measurements, and analysis, explaining
in-depth the new display performance results for consumers, reviewers, and
journalists as early as possible.
Galaxy S10 Highlights and Performance
Results
In this section we review and explain the principal
results from the extensive DisplayMate Lab Tests and Measurements
in the following categories: Display
Specifications, Overall Assessments, Screen Reflections, Brightness
and Contrast,
Colors and Intensities,
Absolute Color Accuracy, Viewing Angles, OLED Spectra,
Display Power.
Display Lab Tests and
Measurement Data Table
See the Display Shoot-Out Lab
Measurements Comparison Table below for the complete set of DisplayMate Lab
Tests and Measurements.
Main Topics Covered
This Display Highlights and
Performance Results section has detailed information and analysis on the
Galaxy S10 Display for the main topics listed
below.
You can skip this section and go directly to the Galaxy S10 Conclusions for a Summary of the Display Test
Results.
· Large Full Screen Display
· 3K High Resolution Display
· Record Very High
Absolute Color Accuracy
· Record Very High Contrast
Accuracy and Intensity Scale Accuracy
· Record Peak Luminance
that is Independent of the on-screen Image Content
· Record Color Accuracy and
Intensity Scales that are Independent of the Image Content
· Industry Standard Color Gamuts
· New Automatic Color Management
· Selectable Screen Modes
· Natural DCI-P3 Screen
Mode
· Natural sRGB Screen Mode
· Vivid Screen Mode with User Adjustable White Point
· Vivid Screen Mode in Ambient Light
· High Screen Brightness and Performance in High
Ambient Light
· Record High Brightness
Mode
· Improved High Dynamic Range Mobile
HDR10+ Display
· Improved Viewing Angle Performance
· Improved Blue Light Spectrum
· Night Mode Blue Light Filter for Better Night Viewing
· Front and Back Dual Ambient Light Sensors
· Interactive Personalized Automatic Brightness
· Vision Accessibility Display Modes
· Super Dimming Mode
· Always On Display Mode
· Diamond Pixels
· Viewing Tests Performance
· Improved Display Power
Efficiency
· Improved Display
Related Enhancements
· Large 6.1 inch Full Screen Display with a Wide Aspect Ratio
of 19 : 9
The Galaxy S10 has a large 6.1 inch State-of-the-Art Curved Full Screen Flexible OLED display that fills almost the entire front face of the
phone from edge-to-edge. While the OLED display itself is flexible, the screen
remains rigid under an outer hard cover glass. The Galaxy S10 display is 10% larger in screen area
than the Galaxy S9 due to much smaller bezels and borders, providing a higher
90% Screen-to-Body Ratio, compared to 85% for the Galaxy S9.
The display also has a form factor with a taller height to width Aspect Ratio of 19 : 9 = 2.11, which
is 19% larger than the 16 : 9 = 1.78 on most Smartphones (and widescreen
TVs) because the display now has the same overall shape as the entire phone. It
is taller in Portrait mode and wider in Landscape mode. This provides extra
space for Notifications and for displaying multiple Apps and content
simultaneously on-screen side-by-side.
The main screen has rounded corners and is curved along both the left
and right edges, which provides two additional user configurable Edge Screen areas that can
be viewed from both the front or the sides, and even when the phone is placed
face down. This is particularly helpful for status messages, notifications,
memos, an Edge Clock, and a Night Clock in the Always
On Display mode, which we cover below.
· 3K High Resolution Quad HD+ 3040x1440 Display with 550
pixels per inch
As a result of its larger display size and larger Aspect
Ratio, the Galaxy S10 has a 3K Higher Resolution Quad
HD+ display with 3040x1440 pixels and 550 pixels per inch, with 4.4 Mega Pixels, more than
double the number on your HDTV. It can display more than four complete HD
1280x720 images at once. The display has Diamond
Pixels (see below) and Sub-Pixel Rendering
with 550 pixels per inch (ppi), providing significantly higher image sharpness
than can be resolved with normal 20/20 Vision at the typical viewing distances
of 10 inches or more for Smartphones, so the display appears perfectly sharp.
The Galaxy S10 uses Sub-Pixel
Rendering, which further improves image sharpness because the individual
Red, Green and Blue Sub-Pixels are treated as independent addressable image
elements and are not bound together into fixed Pixels, so the closest sub-pixel
is used when rendering the image. In some cases Sub-Pixel Rendering can make
the screen appear to have up to 3 times the resolution of traditional Pixel
Rendering. As a result, for Smartphones it is
absolutely pointless to further increase the display resolution and pixels per
inch (ppi) up to 4K (3940x2160 pixels) for a silly marketing wild goose chase
into the stratosphere, with no visual benefit for humans!
· Record Very High
Absolute Color Accuracy for Calibrated Screen Modes
All of the recent model Galaxy OLED Smartphones have
supported multiple Color Gamut Standards for different image and picture
content, including both DCI-P3 and sRGB / Rec.709. For each of the Calibrated Screen
Modes we carefully measure the Absolute Color Accuracy
using an advanced series of spectroradiometer measurements with 41 Reference Colors that provide a detailed map of
the Color Accuracy throughout the entire Color Gamut for each Screen Mode.
Absolute Color Accuracy is measured in terms of Just
Noticeable Color
Differences, JNCD.
See this Figure for an
explanation and visual definition of JNCD and
the detailed Color
Accuracy Plots showing the measured Color Errors for the 41 Reference Colors for each of the Color Gamuts.
The Galaxy S10 is the Most Color
Accurate Display that we have ever measured. It is Visually Indistinguishable
From Perfect, and almost certainly considerably better than your existing
Smartphone, living room HDTV, Tablet, Laptop, and computer monitor.
See the detailed Absolute Color Accuracy Plots
with 41 Reference Colors for the Calibrated
Screen Modes, which are covered and measured individually below.
· Record Very High
Contrast Accuracy and Intensity Scale Accuracy
The
Intensity Scale (sometimes called the Gray Scale) not only controls the Image
and Picture Contrast within all displayed images but it also controls how the
Red, Green and Blue primary colors mix to produce all of the on-screen colors.
So if the Intensity Scale doesn't accurately follow the Standard that is used
to produce virtually all consumer content then the Image Colors, Image
Contrast, and their Brightness Intensities will be wrong everywhere in all
images. Unfortunately, many manufacturers are quite sloppy with the Intensity
Scale on their displays (because it is logarithmic and not linear).
Fortunately, the Intensity Scale on Galaxy S10 is a close to perfect match of
the Intensity Scale Standard, which is essential for High Absolute Color Accuracy.
See Figure 3 for a plot of the
measured Intensity Scale and the Contrast and Intensity Scale section for measurements and details.
· Record Peak Luminance
that is Independent of the on-screen Image Content
On almost all existing OLED displays the Peak Brightness
(Luminance) changes with the Average Picture Level APL of the on-screen image,
increasing by up to 50 percent or more between High APL and Low APL. This
increasing High Brightness effect can be very useful in improving screen
readability in High Ambient Light, and also to highlight certain on-screen
image content. But the changing display Brightness can distort the brightness relationships
when viewing photos, in videos, and other images.
As a result, Samsung has been reducing this variation in
Peak Brightness for all the Screen Modes except the Vivid mode, which takes
advantage of this High Brightness effect. For example, on the Galaxy S8, the
Luminance variation was 28 percent. Then on the Galaxy S9 the Luminance
variation went down to only 6 percent, and now on the Galaxy S10 it is down to
just 2 percent, which is impressive. But as we
discuss next, the real reason for doing this is actually to improve the
Absolute Color Accuracy and Absolute Contrast Accuracy of the display. See the Screen Brightness section for the measurements and
details.
· Record Color Accuracy
and Intensity Scales that are Independent of the on-screen Image Content
The Absolute Color Accuracy and
Intensity Scale of the display should not change as the on-screen image content
changes.
As we discussed above, the first step is to make sure
that the Peak Brightness (Luminance) of the display does not change with the
Average Picture Level APL of the on-screen image because High Color Accuracy is
impossible when that occurs.
With the continuing improvements in display performance
we have added a new set of advanced tests that measure the variations in the
Absolute Color Accuracy and the Intensity Scales with changing
Average Picture Level APL, comparing the Shifts between Low APL and 50% High APL.
Previous generation displays with large Peak Luminance changes with APL
typically show Large Shifts in the Intensity
Scale and Large Shifts in Absolute Color
Accuracy with APL. Since the Galaxy S10 has a small 2
percent change in Luminance with APL, we expect Small
Shifts in Accuracy with APL, which we analyze next...
The Variation
in the Intensity Scales between Low APL and 50% APL is shown Figure 3. Any change in
the Intensity Scale will affect the Absolute Color Accuracy. There is only a
small Shift in the Intensity Scales, with the Gamma varying from 2.20 for Low APL to 2.22 for
50% APL. As a result, we expect the Absolute Color Accuracy to only show
small variations with APL.
The Variation
in the Absolute Color Accuracy between Low APL and 50% APL for the Natural
sRGB and DCI-P3 Modes is shown in Figure 4. The Color
Shifts with APL are small, with an Average Color Shift
of just 0.4 JNCD and the Largest Color Shifts
only 1.0 JNCD for the Natural Modes. In addition, the White Point Shifts with APL are just 0.1 JNCD.
All the Shifts with APL are very small and Excellent. See
this Figure for an
explanation and visual definition of JNCD and
the Color APL Shifts section for measurements and
details.
· Industry Standard Color Gamuts
The Galaxy S10 supports the two most important Industry Standard Color Gamuts: the sRGB / Rec.709 Color
Gamut that is used for most current consumer
content, and the new Wide DCI-P3 Color Gamut that is used in 4K Ultra HD TVs. The DCI-P3 Gamut is
26 percent larger than the sRGB / Rec.709 Gamut. However, Automatic Color Management provides support for a
large number of other Standard and Non-Standard Color Gamuts...
· New Automatic Color
Management
Most Smartphones and Tablets generally provide only one
to up to several fixed Color Gamuts. The Galaxy S10 has
Automatic Color Management that automatically switches to the proper
Color Gamut for any displayed image content that has an ICC Profile within the
OLED Wide Color Space, so images automatically appear with the correct colors,
neither over-saturated or under-saturated. Automatic
Color Management with multiple and varying Color Gamuts is a very useful and
important state-of-the-art capability that all manufacturers will need to
provide in the future.
· Selectable Screen Modes
The Galaxy S10 provides 2 user selectable Screen Modes that provide control of the vividness of
displayed images for each Color Gamut. They are the Natural
Mode, which provides the most Accurate Colors, and the Vivid
Mode, which provides a Vibrant and Dynamically adjustable Wide Color Gamut up
to the Full Native Color Gamut of the OLED display.
Use Display Settings to switch
between the Selectable Screen Modes.
See this Figure for the Color Gamuts and Color Modes
and the Colors and Intensities section for
the measurements and details. Note that the Vivid mode
is the standard and factory default Screen Mode. Use Display Settings to switch
between the Screen Modes. We discuss each of the tested Screen Modes
next…
· DCI-P3 Natural Mode with a Very Accurate Standard DCI-P3
Color Gamut
The Galaxy S10 has the newest Standard Wide Color Gamut called DCI-P3
for Digital Cinema
Initiative, which is being used for 4K
Ultra HD TVs and in Digital Cinema for the movie industry. So the Galaxy S10
can display the latest high-end 4K video content. The DCI-P3 Gamut is 26
percent larger than the Rec.709 Gamut used in 2K Full HD TVs, both are compared
in this accurately colorized Reference
Figure. The larger DCI-P3 Color Gamut and its wider range of more saturated
colors are also useful in many advanced imaging applications, including HDR High Dynamic Range, which is discussed below.
The measured Color Gamut
of the DCI-P3 Natural mode is a Very Accurate 100 percent of the Standard DCI-P3
Color Gamut, and the measured Absolute Color
Accuracy is a Record Setting Very Accurate 0.4 JNCD,
which is the Most Color Accurate Display we have ever
measured, and is Visually
Indistinguishable From Perfect, and almost certainly considerably
better than your existing Smartphone, living room HDTV, Tablet, Laptop, and
computer monitor.
The Galaxy S10 is one of the first displays to reach full
100% of the DCI-P3 as the result of using a new high saturation “Deep Red” OLED. See the Color
Accuracy section and the detailed Color Accuracy Plots for
the measurements and details. Select the Natural mode
using Display Settings – it is not the default screen mode for the Galaxy S10.
· sRGB Natural Mode with a Very Accurate Standard sRGB /
Rec.709 Color Gamut
The sRGB Natural mode
provides a very accurate Color and White Point calibration for the Standard sRGB / Rec.709 Color Gamut that is used to
produce most current consumer content for digital cameras, TVs, the internet,
and computers, including photos, videos, and movies.
The measured Color Gamut
of the sRGB Natural mode is a Very Accurate 102
percent of the Standard sRGB / Rec.709 Color Gamut, and the measured Absolute Color Accuracy is a Record Setting Very
Accurate 0.5 JNCD, which is the Most Color
Accurate Display we have ever measured, and is Visually Indistinguishable From Perfect, and almost certainly considerably better than
your existing Smartphone, living room HDTV, Tablet, Laptop, and computer
monitor.
Use the Natural mode for
the best color and image accuracy for most current consumer content, which is
especially important when viewing photos from family and friends (because you
often know exactly what they actually should look like), for some TV shows,
movies, and sporting events with image content and colors that you are familiar
with, and also for viewing online merchandise, so you have a very good idea of
exactly what colors you are buying and are less likely to return them. See the Color Accuracy section and the detailed Color Accuracy Plots for
the measurements and details. Select the Natural mode
using Display Settings – it is not the default screen mode for the Galaxy S10.
· Vivid Screen Mode with the Largest Color Gamut
The Vivid mode has the
Wide Native OLED Color Gamut. It provides significantly higher Color
Saturation, with a large 142 percent of the Standard
sRGB / Rec.709 Color Gamut and 113 percent of
the Standard DCI-P3 Color Gamut, the highest that we have ever measured
for Smartphones and Tablets. The Vivid mode also provides real-time Adaptive
processing that can dynamically adjust images and videos. For some applications
it will vary the White Point, Color Gamut, and Color Saturation based on the
image content and the color of the surrounding ambient lighting measured by the
Ambient Light Sensor (which measures color in addition to brightness).
Some people like the more saturated and Vibrant Colors,
plus it is useful for special applications, and especially when using the
Galaxy S10 in medium to high levels of Ambient Light, because it offsets some
of the reflected light glare that washes out the on-screen image colors. We
examine the change in the Color Gamut with Ambient Light below. See the Color Accuracy section for the measurements and
details. Select the Vivid mode using Display Settings
– it is the factory default screen mode for the Galaxy S10.
· Vivid Screen Mode with a User Adjustable White Point
The default White Point for
the Vivid mode has a somewhat Bluish 7,102 K Color Temperature, which is
noticeably less Bluish than 7,621 K on the equivalent Galaxy S9 Adaptive
Display Mode. The Galaxy S10 has a user adjustable White Point with Color Balance slider controls that allows users to
change color of White for the Vivid mode. The slider controls allow the White
Point Color Temperature to range from 6,400 K,
which is close to the Standard D65 White, up to 7,900
K, which has a moderate Bluish Tint that some people like. So with the
Galaxy S10 you can set the Color of White that you prefer.
· Vivid Mode Offsets the Loss of Color Saturation and Color
Gamut in Ambient Light
The Vivid mode is particularly useful in moderate to high
levels of Ambient Light because its larger Native
Color Gamut offsets some of the loss of Color Saturation and Color Gamut
that occurs when using the other Accurately Calibrated Standard Screen Modes.
This Figure
shows the measured decrease in the Vivid and Natural Modes with increasing
Ambient Light, from 0 lux, which is perfectly dark, up through 2,000 lux, which
corresponds to typical outdoor daylight in shade.
At 500 lux, which
corresponds to typical office lighting, the measured on-screen Color Gamut for
the Natural modes decreases to 88%. At 1,000 lux, which corresponds to very bright indoor
lighting or outdoor daylight with an overcast sky, the measured on-screen Color
Gamut decreases to 77%, and at 2,000 lux the measured on-screen Color Gamut
decreases to 61%. This loss of color saturation
and wash out in Ambient Light is well known to all display users.
The way to improve the display color accuracy and
performance in Ambient Light is to start with a larger Color Gamut, like the
Vivid mode, which is shown in this Figure compared
to the Natural modes for 0 lux up through 2,000 lux. At 1,000 lux the Vivid
mode provides a much better match to the sRGB / Rec.709 Color Gamut than the
sRGB Natural mode. The Vivid mode also provides a good match to the DCI-P3
Color Gamut at 500 lux. So the Vivid mode provides
more accurate on-screen colors in moderate to high Ambient Lighting than the
Calibrated Natural Modes, which are designed and calibrated for Low Ambient
Light. Applying Dynamic Color Management based on the current Ambient
Light lux level in the future will able to further improve color accuracy over
a wide range of Ambient Light levels, which we discuss further in the Improving Display Performance for Real World Ambient
Light section in the Conclusion.
· High Screen Brightness and Performance in High Ambient
Lighting
Mobile displays are often used under relatively bright
ambient lighting, which washes out the image color saturation and contrast,
reducing picture quality and making it harder to view or read the screen. To be
usable in high ambient light a display needs a dual combination of high Screen Brightness and low Screen
Reflectance – the Galaxy S10 has both. This is extremely important for
screen readability, picture quality, and color accuracy in ambient light.
With Automatic Brightness turned Off and the Brightness
slider set Manually to Maximum, the Galaxy S10 produces between 394 cd/m2 and 530
cd/m2 (nits), based on the current Screen Mode and the Average Picture Level APL of the image content, among the very brightest that we have ever measured for a
Smartphone with Automatic Brightness turned Off.
See the Screen Brightness section for the
measurements and details.
The measured Galaxy S10 Screen
Reflectance is 4.4 percent, very close to the lowest that we have ever
measured for a Smartphone. Our Contrast Rating for
High Ambient Light quantitatively measures screen visibility and image
contrast under bright Ambient Lighting – the higher the better. As a result of
its high Brightness and low Reflectance, the Galaxy S10 has a Contrast Rating for High Ambient Light that ranges
from 90 to 120, among the very highest that we have
ever measured for a Smartphone. See the Screen
Reflectance section for the measurements and details.
· Record High Brightness Mode with Automatic Brightness On
On the Galaxy S10 the
Maximum Screen Brightness can go much higher when Automatic
Brightness is turned On, so that users can’t permanently park the Manual
Brightness slider to very high values, which would run down the battery
quickly. High Screen Brightness is only needed for
High Ambient Light, so turning Automatic Brightness On will provide
better high ambient light screen visibility and also longer battery running
time.
When Automatic Brightness
is turned On, the Galaxy S10 has a High Brightness Mode that produces between 786 cd/m2 and
1,215 cd/m2 (nits) in High Ambient Light, which is where high
Brightness is really needed, and is considerably Brighter than with Manual
Brightness when Automatic Brightness is turned Off.
The 786 nits is for the Natural Mode with an All
White Full Screen 100% Average Picture Level APL image, which is the
most challenging image for an OLED display because all the pixels are at full
power. This is 14% Brighter than on the Galaxy
S9, and a Contrast Rating for High Ambient Light
that is also 13% higher than on the Galaxy S9.
For the Vivid Mode it is 804 nits and 17% Brighter than
the Galaxy S9. These are Record Setting Brightness for
OLED displays with 100% Average Picture Level APL images.
The Peak Brightness of 1,215
nits is 8% higher than the 1,130 nits on the Galaxy S9, but that is only
for very low APL. See the Brightness and Contrast,
the High Ambient Light and the Screen Reflections sections for the measurements and
details.
· Improved High Dynamic
Range Mobile HDR10+ Display
The Galaxy S10 can play 4K High Dynamic Range content
made for 4K UHD TVs. High Dynamic Range
(HDR) is the newest performance enhancement feature developed for the latest 4K
Ultra HD TVs. The Galaxy S10 has the new enhanced Mobile HDR10+ that supports Dynamic Metadata and Dynamic
Tone Mapping.
HDR provides expanded Color, Contrast, and Brightness of
video content. In order to provide HDR, the Galaxy S10 has the required Digital
Cinema DCI-P3 Wide Color Gamut, plus perfect Blacks and an Infinite Contrast
Ratio from its OLED display, and a peak Brightness of over 1,000 nits that is
needed for High Dynamic Range. The Galaxy S10 can play the latest streamed
mobile HDR videos, and its built-in video processor also allows it to provide
an Expanded Dynamic Range for standard video
content that produces an HDR-like effect.
· Improved Viewing Angle
Performance
While Smartphones are
primarily single viewer devices, the variation in display performance with
viewing angle is still very important because single viewers frequently hold
the display at a variety of viewing angles. The angle is often up to 30
degrees, more if the phone is resting on a table or desk.
While LCDs typically
experience a 55 percent or greater decrease in Brightness at a 30 degree
Viewing Angle, the OLED Galaxy S10 display shows a much smaller 23 percent
decrease in Brightness at 30 degrees. This also applies to multiple
side-by-side viewers as well, and is a significant advantage of OLED displays.
All
displays have Color Shifts with Viewing Angle:
The Color Shift of White, which is the most used
background color is particularly noticeable on many OLED and LCD displays. The
Galaxy S10 has a very small White Shift of just 0.7
JNCD at 30 degrees, which is unlikely to be noticeable, and is the
smallest for any OLED display that we have ever tested. The largest Color
Shifts with Viewing Angle on the Galaxy S10 are all relatively small with Very
Good to Excellent ratings. See the Viewing Angles
section for the measurements and details.
· Improved Blue Light Spectrum
For the
Galaxy S10 the amount of potentially harmful very short wavelength Blue Light
has been reduced by 42% compared to the Galaxy S9, while still maintaining the
same Wide Color Gamut. The Galaxy S10 has been TUV
Certified for Eye Comfort with Reduced Blue
Light. This has been accomplished with a new Blue OLED with an improved
light spectrum that has a reduced short wavelength component. The Improved Blue
Light Spectrum also works in conjunction with the Night
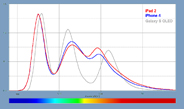
Mode Blue Light Filter...
· Night Mode Blue Light Filter for Better Night Viewing
The Night Mode Blue Light Filter on the Galaxy S10 is
designed to change the color balance of the display in order to reduce the
amount of Blue light produced by the display, which some recent research
indicates can affect how well users sleep afterwards. In a separate article we
explain and analyze the Blue Light issue for displays. The Galaxy S10 includes
a user adjustable slider (called Filter Opacity) to vary the amount of Blue
light produced by the display and a timer that allows the Blue Light Filter to
be turned on and off automatically every day. The measured variation in the
display light spectrum with the adjustable Blue Light Filter is shown in this Figure and
below.
As the Blue Light Filter Opacity setting is increased, the
amount of Blue light emitted by the display decreases. When that happens, White
and all screen colors take on an increasing yellowish tint and color cast. At
the Middle setting the measured White Color
Temperature decreases to 5,600 K, and at the Maximum setting it decreases to 2,400 K, the Color Temperature of traditional
incandescent lighting, which is yellowish. With the Blue Light Filter turned On
and the Opacity at its Maximum setting, the measured Blue Light component from
the Galaxy S10 is reduced by 80 percent. Turning down the screen Brightness
will further decrease the amount of Blue Light. The
measured display spectra for several of the Blue
Light Filter settings are included in this
Figure and
below.
· Front and Back Dual
Ambient Light Sensors for Improved Automatic Brightness Settings
Other Smartphones and
Tablets have just a single Ambient Light Sensor on the front of the screen that
measures the amount of light falling on the front of the screen. When Automatic
Brightness is turned On, the display Brightness is adjusted based on this
single measured value. But that is only part of the story because the phone is
often in the shadow of your head, so the front ambient light level is often
reduced there. However, your eyes are generally more adapted to the surrounding
ambient light level that is behind and around the phone, which needs to be
taken into account in setting the proper screen Brightness, particularly with
the most common back lighting situations that exist when holding the phone.
I proposed dual Ambient
Light Sensors back in 2010, with an article
that described “How Automatic Brightness Should Work.”
The Galaxy S10 (together with the Galaxy S9 and Galaxy Note9) are the only
Smartphones to have a second Ambient Light Sensor on the back that also
measures the surrounding ambient light behind the phone and then uses both
measured values to adjust the display Brightness based on the front and back
lighting. The Galaxy S10 Automatic Brightness Control has also been enhanced to
provide improved response and transition times with changing ambient light
levels to give your eyes the proper amount of time to adjust to the new levels.
· Interactive Personalized Automatic Brightness Control that
Works Well
The Galaxy S10 has an
Interactive Personalized Automatic Brightness Control
that learns and stores the display brightness settings that you make for
varying ambient light levels, so from then on you get your own customized
personal visual brightness preferences instead of some pre-programmed
manufacturer settings found in other Smartphones, Tablets, and TVs. I proposed
this back in 2010, with an article
that described “How Automatic Brightness Should Work.”
The Galaxy S10, Galaxy S9 and Galaxy Note9 are the first Smartphones, Tablets,
or TVs to do Automatic Brightness correctly.
When Automatic
Brightness is turned On (under Display Settings), if you adjust the Brightness
Slider, the Galaxy S10 will remember your setting along with the current
Ambient Light level that is measured by its Ambient Light Sensors (ALS). From
then on the Galaxy S10 will automatically adjust the screen Brightness by
measuring the current ambient light level and then adjusting the display
Brightness based on the settings that you have previously made, so you’ll get a
customized screen Brightness setting that you’ve previously trained it to produce
for the current level of ambient light – and you can continue to tweak and
adjust it as needed. Other smartphones operate using the antiquated opposite
approach based on factory set defaults, which work backwards and poorly, and
often results in users disabling Automatic Brightness.
· Vision Accessibility Display Modes
The Galaxy S10 has a
number of Vision Accessibility display modes to help people with vision
impairments.
A Color Lens mode provides 12 types of color filtering
with selective transparency to improve the readability of text. A Color Adjustment mode allows display colors to be
adjusted interactively based on their visual similarity and appearance using a
simple finger drag and place method.
Other Vision
Accessibility display modes include Font Size, Font Zoom, Font Style, Custom Downloadable Fonts, High
Contrast Themes, High Contrast Fonts, Inverted
Negative Colors, Area Magnification, and Screen Magnification.
· Super Dimming Mode
The Galaxy S10 also has a Super
Dimming Mode that allows the Maximum Screen Brightness to be set all the
way down to just 2 cd/m2 (nits)
using the Brightness Slider. This is perfect for night use on a beside table,
and useful for working comfortably without eye strain or bothering others in
very dark environments, or affecting the eye’s dark adaptation, such as when
using a telescope. The display still provides full 24-bit color and the picture
quality remains excellent.
· Always On Display Mode
The Galaxy S10 has an Always On
Display AOD mode that takes advantage of the very low power capability
of an OLED display when most of the image pixels are black, because every
sub-pixel is independently powered, and therefore doesn’t use any power when
black. The AOD mode is super power efficient and typically requires only 3 to 5
percent of the maximum display power. So when the phone is off (in standby) it
is possible to always display some text and graphics on a black background all
day and all night without a significant power drain that would reduce the
battery running time. The Always On Display mode uses only 50 to 100 mW
(milli-Watts) in normal daytime ambient light, and much less in the dark mode
at night. For moving AOD content, such as in an Analog Clock with a second
hand, the display is updated via Integrated Circuit hardware rather than App
software, resulting in lower power consumption. A feature on the Galaxy S10
also allows you to a add personal photo to the Always On Display.
The Always On Display produces an illuminated main screen image 24 hours
a day so you can always discreetly check it with just a glance. It shows various personalized clock and calendar screens,
plus status messages, memos, notifications, and images on the main screen when
the phone is off (in standby). It measures the ambient light and provides 4
Brightness levels from night and day. It will stay off when the phone display
is face down, or if it senses a dark confined space like a pocket or handbag.
The day mode has a measured Luminance of 35 cd/m2 (nits) on a black background, which is very readable but not
distracting for normal indoor ambient lighting, and is visible outdoors if you
shade the screen with your hand. The night mode is entered for very low Ambient
Light lux levels and runs like the Super
Dimming Mode down to as low as 1 nit, so it
makes a great Night Clock that won’t disturb you if it is on your bedside
table.
· Diamond Pixels
A
high resolution screen shot (provided by Samsung) shows an interesting
design and sub-pixel arrangement for the Galaxy S10, which Samsung calls Diamond
Pixels. First of all, the Red, Green, and Blue sub-pixels have very
different sizes – Blue is by far the largest because it has the lowest light
emission efficiency, and Green is by far the smallest because it has the highest
efficiency. The alternating Red and Blue sub-pixel arrangement leads to a 45
degree diagonal symmetry in the sub-pixel layout. This allows vertical,
horizontal, and particularly diagonal line segments and vectors to be drawn
with reduced aliasing and artifacts. In order to maximize the sub-pixel packing
and achieve the highest possible pixels per inch (ppi), that leads to diamond
rather than square or stripe shaped Red and Blue sub-pixels. But not for the
Green sub-pixels, which are oval shaped because they are squeezed between two
much larger and different sized Red and Blue sub-pixels. It’s a form of
high-tech display art…
· Viewing Tests Performance
The calibrated Natural
Modes on the Galaxy S10 provide very nice, pleasing and Very Accurate Colors
and Picture Quality. The very challenging set of DisplayMate Test and
Calibration Photos that we use to evaluate picture quality looked absolutely stunning and Beautiful, even to my
experienced hyper-critical eyes.
The Absolute Color Accuracy on the Galaxy S10 is the Most Color Accurate Display we have ever measured. It is
Visually Indistinguishable From Perfect,
and almost certainly considerably better than your existing Smartphone, living
room HDTV, Tablet, Laptop, and computer monitor,
as demonstrated in our extensive Absolute Color Accuracy Lab
Measurements.
In order to see the Galaxy S10 High Color Accuracy, the Display Setting
needs to be set to the Natural Mode, which Automatically Switches to the proper
Gamut for the current on-screen content.
For indoor and low ambient light viewing use the Natural mode for most standard consumer content
including digital camera, TV, internet, and computer content, including photos,
videos, and movies, and also for your online purchases in order to see accurate
product colors, and also for viewing the newest DCI 4K Ultra HD TV and Digital
Cinema content and videos, including HDR content.
The Vivid mode provides
significantly more Vibrant and Saturated Colors, which some people prefer. The
Vivid mode is also recommended for viewing in medium to high levels of ambient
light because it offsets some of the reflected light glare that washes out the
image colors, which is demonstrated in this Figure for
ambient light levels up through 2,000 lux.
· Improved Display Power
Efficiency
Since 2013 the Display Power
Efficiency of the Galaxy series of Smartphones has improved by a very
impressive 65%.
The Galaxy S10 has 10% higher
Relative Display Power Efficiency than the display on the Galaxy S9.
For the same Screen Area and
same Luminance as the Galaxy S9 the Galaxy S10 display would use 9% less power.
While LCDs remain more power efficient for images with
mostly full screen white content (like all text screens on a white background,
for example), OLEDs are more power efficient for typical mixed image content
because they are emissive displays so their power varies with the Average
Picture Level (average Brightness) of the image content over the entire screen.
For LCDs the display power is fixed and independent of
the image content. But for OLEDs, the display power decreases with the type of
image content. Black pixels and sub-pixels don’t use any power so screens with
Black or dark backgrounds are very power efficient for OLEDs. Photos and videos
also have relatively low Average Picture Levels and so require much less power
on OLEDs than LCDs. Currently, OLED displays are more power efficient than LCDs
for Average Pictures Levels of 70 percent or less, and LCDs are more power
efficient for Average Picture Levels above 70 percent. Since both technologies
are continuing to improve their power efficiencies, the crossover will continue
to change with time.
The Galaxy S10 also has 4 user selectable Performance and Power Saving modes that reduce the
Display Power by lowering the screen Brightness and Resolution, and also
setting the background to Black, which can significantly reduce display power
and more than double the running time on battery. All of our tests and
measurements were performed in the High Performance
Mode. See the Display Power section for the
measurements and details.
· Improved Display
Related Enhancements
· The
Galaxy S10 has the new Gorilla Glass 6, which provides much higher resistance
to breakage.
· The
Galaxy S10 is IP68 water resistant in up to 5 feet of water for up to half an
hour, which means you can comfortably view the display in typical wet indoor
and outdoor conditions – even carefully use it in a tub or shower, and it
should be fine if you accidentally drop it in a sink or toilet.
· The
Galaxy S10 can be used with Polarized Sunglasses in both the Portrait and
Landscape orientations unlike LCDs, which generally work in only one of the two
orientations.
· The
Galaxy S10 accepts a microSD card, which makes it easier to add large photo and
video files.
Galaxy S10 Conclusions: A Record Setting
Impressive Smartphone Display…
The primary goal of this Display Technology Shoot-Out
article series has always been to publicize and promote display excellence
so that consumers, journalists and even manufacturers are aware of and
appreciate the very best in displays and display technology. We point out which
manufacturers and display technologies are leading and advancing the
state-of-the-art for displays by performing comprehensive and objective
scientific Lab Tests and Measurements together with in-depth analysis. We point
out who is leading, who is behind, who is improving, and sometimes
(unfortunately) who is back pedaling… all based solely on the extensive
objective careful Lab measurements that we also publish, so that everyone can
judge the data for themselves as well…
OLED Display
Evolution:
What is particularly significant and impressive is that
Samsung has been systematically improving OLED display performance with every
Galaxy generation since 2010, when we started tracking OLED
displays. The first notable OLED Smartphone, the Google
Nexus One, came in decidedly last place in our 2010 Smartphone
Display Shoot-Out. As a result of the improvements with each new
generation, mobile OLED display technology now has a commanding first place
lead and continues pushing ahead aggressively. The Galaxy
S10 continues the impressive improvements in mobile OLED displays and
technology. As a result, OLEDs have developed into excellent Smartphone
displays that now significantly outperform the best LCD Smartphones. With the continuing improvements in OLED hardware
performance, picture quality, and precision accuracy, it will be much harder
for new display technologies to challenge OLED.
Summary of the Galaxy S10 Display
Functions, Features, and Performance Records:
The Galaxy S10 has many
major and important state-of-the-art Display Performance Functions and Features,
and many new Display Performance
Records that are listed below.
See the Display Shoot-Out Lab
Measurements Comparison Table section for the complete set of detailed
DisplayMate Lab measurements and tests.
See the Highlights and Performance
Results section for a detailed overview with expanded discussions and
explanations.
See the Display Assessments
section for the Evaluation details.
The Galaxy S10 has the following
State-of-the-Art Display Performance Functions and Features:
· A State-of-the-Art Curved
Screen Flexible OLED display that is
manufactured on a flexible plastic substrate so that it can bend around corners
on both sides of the phone to provide two curved Edge Display areas that can be viewed
and controlled from both the front or the sides. While the OLED display itself
is flexible, the screen remains rigid under an outer hard cover glass.
· A Full Screen design
with a large 6.1 inch
OLED display that fills almost the entire
front face of the Galaxy S10 from edge-to-edge, providing a
significantly larger display for the same phone size. The Galaxy S10 display is
10% larger in screen area than the Galaxy S9
due to much smaller bezels and borders, providing a Screen-to-Body Ratio of
90%, compared to 85% for the Galaxy S9. The Home
button and Navigations buttons are now incorporated within the touchscreen
display.
· A new display form factor with a taller height to width Aspect Ratio of 19 : 9 = 2.11, which is 19% larger than the 16 : 9 = 1.78 on most
Smartphones (and widescreen TVs) because the display now has the same overall
shape as the entire phone. It is taller in Portrait mode and wider in Landscape
mode. This provides extra space for Notifications and for displaying multiple
Apps and content simultaneously on-screen side-by-side.
· 3K High Resolution 3040 x 1440 Full HD+ Display with 550 pixels per inch, and Diamond Pixels
with Sub-Pixel Rendering for enhanced sharpness
and higher Peak Brightness.
· The Galaxy
S10 display appears Perfectly Sharp for normal 20/20
Vision at Typical Smartphone Viewing Distances of 10 to 18 inches (25 to 46
cm).
· Very Low Screen Reflectance
of 4.4 percent.
· Image Luminance that is
Independent of the on-screen Image Content.
· High Brightness Mode with 100% APL Full Screen Peak Display Brightness of 804 nits, which is 17 percent
higher than the Galaxy S9, and significantly improves screen visibility in very
high Ambient Light, and also provides the high screen Brightness needed for HDR.
.
· Very High Absolute Color Accuracy
(0.4 JNCD) that is Visually Indistinguishable
From Perfect.
· Very
High Image and Picture Contrast Accuracy and Intensity Scale Accuracy (2.20
Gamma) that is Visually Indistinguishable From Perfect.
· Color Accuracy and Intensity Scales that are Independent
of the Image Content.
· Automatic Color Management that automatically switches to the proper Color Gamut for
any displayed image content that has an ICC Profile within the OLED Wide
Color Space, so images automatically appear with the correct colors, neither
over-saturated or under-saturated.
· 2 Industry Standard Calibrated Color Gamuts: the sRGB / Rec.709 Color
Gamut that is used for most current consumer
content, and the new Wide DCI-P3 Color Gamut that is used in 4K Ultra HD TVs. The DCI-P3 Gamut is
26 percent larger than the sRGB / Rec.709 Gamut.
· 2 Selectable Screen Modes that
provide user control of the color from the Accurate Natural Mode to the Vivid Mode.
· A full 100%
DCI-P3 Color Gamut with the Natural mode that is also
used for 4K Ultra HD TVs, so the Galaxy S10 can display the latest
high-end 4K video content. The DCI-P3 Gamut is 26 percent larger than the
Rec.709 Gamut that is used in 2K Full HD TVs.
· A larger Native Color Gamut with
a new high saturation “Deep Red” OLED,
resulting in a very impressive 113% of DCI-P3 and
142% of sRGB / Rec.709 Gamuts that also
provides much better on-screen Colors in High Ambient Light.
· A new
Blue OLED with an improved light spectrum that reduces the amount of
potentially harmful very short wavelength Blue Light while still maintaining
the same full wide Color Gamut.
· A Night Mode with
a Blue Light Filter
that allows the user to adjust and reduce the amount of blue light from the
display for better night viewing and improved sleep.
· A Video Enhancer
that provides HDR-like Expanded Dynamic Range for all videos that don’t have
HDR coding.
· High Dynamic Range Mobile HDR10+ Display which allows the Galaxy
S10 to play 4K High Dynamic Range content produced for 4K
UHD TVs. The Galaxy S10 has the new enhanced Mobile HDR10+ that supports
Dynamic Metadata and Tone Mapping.
· Front and
back Dual Ambient Light
Sensors for significantly improved Automatic Brightness settings.
· User Adjustable White Point
with Color Balance slider controls that can change
the color of White for the Vivid mode.
· Always On Display
mode and Personalized
Auto Brightness Control.
· Small Color Shifts and Brightness
Shifts with Viewing Angle,
particularly White, which is the most used
background color.
· Vision Accessibility
Display Modes to help people with vision impairments.
· The Galaxy S10
can be used with Polarized Sunglasses in both
the Portrait and Landscape orientations unlike LCDs, which generally work in
only one of the two orientations.
· A strong
curved Gorilla Glass 6 protecting the display.
The Galaxy
S10 matches or sets new Smartphone Display Performance Records for:
· Highest Absolute Color Accuracy (0.4 JNCD) – Visually Indistinguishable From Perfect.
· Highest Image Contrast Accuracy and
Intensity Scale Accuracy (2.20 Gamma) – Visually
Indistinguishable From Perfect.
· Smallest Change in Peak Luminance with the Image Content Average
Picture Level APL (2 percent).
· Smallest Shift in Color
Accuracy and Intensity Scale with the Image Content APL (0.4 JNCD).
· Highest Full Screen Brightness
for OLED Smartphones (804 nits at 100% APL).
· Highest Peak Display Brightness (1,215 nits for Low APL).
· Largest Native Color Gamut (113% DCI-P3 and 142% sRGB /
Rec.709).
· Highest Contrast Ratio (Infinite).
· Lowest Screen Reflectance (4.4 percent).
· Highest Contrast Rating in Ambient Light (183 for 100%
APL and 276 for Peak Brightness).
· Smallest Brightness Variation with Viewing Angle (23 percent
at 30 degrees).
· Smallest Color Variation of White with Viewing Angle (0.7
JNCD at 30 degrees).
· Highest Visible Screen Resolution
3K (3040x1440) – 4K Does Not Appear Visually
Sharper on a Smartphone.
The Best
Smartphone Display
OLED has evolved into a highly refined and mature display technology that
now produces the best and highest performance displays for Smartphones.
OLED Display Performance continues to
provide major Record Setting improvements with every new generation.
For the Galaxy S10, Samsung has concentrated on significantly raising
the on-screen Absolute Picture Quality and Absolute Color Accuracy of the OLED display by
implementing Precision Factory Display Calibration,
moving the overall Galaxy S10 display
performance up to Record Setting Outstanding Levels,
and setting many new Display Performance Records,
including Record Absolute Color Accuracy at a
very impressive 0.4 JNCD that is Visually Indistinguishable From Perfect. The Galaxy S10 is the most Color Accurate Display that we
have ever tested.
With consumers now spending rapidly increasing amounts of
time watching content on their Smartphones, the shift in emphasis from
primarily improving Display Hardware Performance to enhancing the overall
display Picture Quality and Color Accuracy is an important step that
DisplayMate Technologies has been pushing for many years in our Display
Technology Shoot-Out article series, so it is great to see
manufacturers improving and then competing on these metrics.
The Galaxy S10 is the most
innovative and high performance Smartphone display that we have ever Lab
tested, breaking and establishing many new Display Performance Records that are listed above. The
Galaxy S10 delivers uniformly consistent all around
Top Tier Display Performance and receives All Green (Very Good to Excellent) Ratings in All of the DisplayMate Lab Test and Measurement
Categories.
The level of Display Performance
and Excellence has been increasing each year, and the Galaxy S10 has again
Raised the Bar significantly higher.
Data Tables: See
the Display Shoot-Out Lab Measurements Comparison Table
section below for all of the measurements and details.
Highlights: See
the Highlights and Performance Results section above
for expanded discussions and explanations.
Features: See the Display Performance Functions and Features
section above.
Records: See
the Display Performance Records section above.
Assessments: See
the Display Assessments section below for the
evaluation details.
OLED
displays now have tremendous performance advantages over LCDs, so high-end and
flagship Smartphones need OLED displays in order to compete at state-of-the-art
performance levels, securing OLED as the definitive premier display technology
for Top Tier Smartphones in the foreseeable future over the next 3-5 years.
With the continuing improvements in OLED hardware performance, picture quality,
and precision accuracy, it will be much harder for new display technologies to
challenge OLED.
Based on our extensive Lab
Tests and Measurements, the Galaxy S10 has an Impressive Display that
establishes many new Display Performance Records, earning DisplayMate’s Best
Performing Smartphone Display Award, and receiving our highest ever A+ grade.
Follow DisplayMate
on Twitter to learn about our upcoming Smartphone display technology
coverage.
The Future of OLED Smartphones
The Galaxy S10 is the latest in a new generation of OLED Smartphones.
OLEDs have now evolved and emerged as the premium mobile Smartphone display
technology. More than two dozen manufacturers
already make OLED Smartphones, and the new Full Screen Display design using a
flexible OLED will be the new Flagship for all the upcoming future Top Tier
Smartphones.
LCDs are a great cutting edge high performance display technology for
Tablets to TVs, but for small handheld Smartphones, OLED displays provide a
number of major advantages over LCDs including: being much thinner, much
lighter, without needing a bezel providing a rimless edge-to-edge design. They
can be made flexible and into curved screens, plus they have a very fast
response time, better viewing angles, and an always-on display mode.
Many of the OLED performance advantages result from the fact that every
single sub-pixel in an OLED display is independently directly electrically
powered to emit light, so only the active image sub-pixels draw power based on
their individual brightness levels. OLEDs can also provide better color
accuracy, image contrast accuracy, and screen uniformity because the
irregularities and variations in LCD Backlights introduce color and brightness
irregularities and variations over the screen.
As the result of their very versatile power management capabilities,
OLEDs are not only more power efficient than LCDs for most image content, but
they now deliver much higher peak Brightness than LCDs because the maximum
power can be delivered to just the sub-pixels that are needed for producing the
current displayed image. However, for mostly all white screen content LCDs are
likely to remain brighter and more power efficient for a while.
OLED displays are also manufactured on flexible substrates that can
bend, which allows the screens to be curved and rounded and provides a number
of innovative new screen geometries. The most popular one is expanding the
front main screen so that it extends around to both the right and left sides of
the phone by bending around the corners like on the Galaxy S10, and earlier
models starting with the original Galaxy Edge and Galaxy Round.
As a result, OLED displays now have tremendous performance advantages
over LCDs, so high-end and flagship Smartphones need OLED displays in order to
compete at state-of-the-art performance levels, securing OLED as the definitive
premier display technology for Top Tier Smartphones in the foreseeable future
over the next 3-5 years. With the continuing improvements in OLED hardware
performance, picture quality, and precision accuracy, it will be much harder
for new display technologies to challenge OLED.
The main production and availability issue for the next several years
will be that the demand for high performance OLED displays will significantly
exceed the manufacturing capacity as we discuss in Flagship 2017
OLED Smartphones.
Follow DisplayMate on Twitter to learn
about these developments and our upcoming display technology coverage.
Improving the
Next Generation of Mobile Displays
The Galaxy S10 has a very
high resolution 3K 3040x1440 pixel display with 550 pixels per inch (ppi)
producing images that look perfectly sharp with normal 20/20 Vision under all
normal viewing conditions, which always includes some ambient light that always
lowers the visible image contrast and perceived image sharpness (Modulation
Transfer MTF). Note that displays are almost never
viewed in absolute darkness under perfect viewing conditions with ideal image
content. Some clueless reviewers have been pining for 4K 3840x2160
Smartphones, which would require almost double the pixels, memory, and
processing power of the 3040x1440 display on the Galaxy S10, but there would be
no visual benefit for humans! As a result, it is absolutely pointless to further increase
the display resolution and pixels per inch (ppi) for a marketing wild goose
chase into the stratosphere, with no visual benefit for humans!
Improving Display Performance
for Real World Ambient Light Viewing Conditions
With screen size and resolution already functionally
maxed out, manufacturers should instead dedicate their efforts and resources
into improving real world display performance in ambient light by using
advanced technology to restore and compensate for the loss of color gamut,
color saturation, and image contrast due to ambient light, something that every
consumer will benefit from, and will also immediately notice and appreciate –
providing a true sales and marketing advantage…
Currently all existing displays
are Accurate only when viewed in Absolute Darkness 0 lux. The most
important improvements for OLED and LCD mobile displays will come from
improving their image and picture quality and screen readability in Real World Ambient Light, which washes out the screen
images, resulting in Reduced Image Contrast, Reduced Color Saturation, and Reduce Color Accuracy. The key will be in lowering the Screen Reflectance and implementing Dynamic Color Management with automatic real-time
modification of the display’s native Color Gamut and Dynamic
Intensity Scales based on the measured Ambient Light level in order to
have them compensate for the reflected light glare and image wash out that
causes a loss of color saturation and image contrast from ambient light as
discussed in our Innovative
Displays and Display Technology and SID
Display Technology Shoot-Out articles.
The displays, technologies, and
manufacturers that succeed in implementing this new real world high ambient
light performance strategy will take the lead in the next generations of mobile
displays… Follow DisplayMate
on Twitter to learn about these developments and our upcoming display
technology coverage.
DisplayMate Display Optimization Technology
All Smartphone,
Tablet, Monitor and TV displays can be significantly improved using
DisplayMate’s proprietary very advanced scientific analysis and mathematical
display modeling and optimization of the display hardware, factory calibration,
and driver parameters. We help manufacturers with expert display procurement,
prototype development, display performance improvement and optimization,
testing displays to meet contract specifications, and production quality
control so that they don’t make mistakes similar to those that are exposed in
our public Display Technology Shoot-Out series for consumers. This article is a
lite version of our advanced scientific analysis – before the benefits of our DisplayMate Display Optimization
Technology, which can correct or improve all of these issues. If you are a
display or product manufacturer and want to significantly improve display
performance for a competitive advantage then Contact DisplayMate Technologies.
|
Galaxy S10
|
Display Shoot-Out Lab Measurements
Comparison Table
Below we
examine in-depth the OLED display performance of the Samsung
Galaxy S10 based on objective Lab
measurement data
and
criteria in the following sections: Display
Specifications, Overall Assessments, Screen Reflections, Brightness
and Contrast,
Colors and Intensities, Absolute Color Accuracy, Viewing Angles, OLED
Spectra, Display Power.
For
additional background and comparison information see this earlier article
covering the Galaxy
S9 Display Technology Shoot-Out.
For
comparisons with the other leading Smartphone displays see our Mobile Display Technology
Shoot-Out series.
Detailed Test and Measurement Comparisons between
the Galaxy S10 and Galaxy S9
You can directly compare the data and measurement results
for the Galaxy S10 with the Galaxy S9 display in detail
by using a Tabbed web browser with our comprehensive Lab
measurements and analysis for each of the displays.
For each Tab click on a Link below. The entries are
mostly identical with only minor formatting differences,
so it is easy to make detailed side-by-side comparisons
by simply clicking through the Tabs.
Samsung Galaxy S10 Lab Measurements Comparison Table
Samsung
Galaxy S9 Lab Measurements Comparison Table
|
Categories
|
Samsung
Galaxy S10
|
Comments
|
|
Display Technology
|
Flexible
OLED Display with Diamond
Pixels
6.1 inch
Diagonal / 15.5 cm Diagonal
Excluding the Rounded
Corners
|
Flexible Organic Light Emitting Diode
Diamond Pixels with
Diagonal Sub-Pixel Symmetry.
|
|
Screen Aspect Ratio
|
19 : 9 =
2.11
New Higher
Aspect Ratio
Most
Smartphones and Widescreen TVs have 16 : 9 = 1.78
|
Height to Width Aspect Ratio
Galaxy S10 display screen is 19% longer
than
most Smartphones and widescreen 16:9 TV
content.
|
|
Screen Size
|
2.61
x 5.52 inches
6.64 x
14.03 cm
|
Display Width and Height in inches and
cm.
|
|
Screen Area
|
14.4
square inches / 93.2 square cm
After
Subtracting the Camera Opening but not the Rounded Corners
|
A better measure of size than the
diagonal length.
|
|
Supported Color Gamuts
|
Vivid mode
– Wide OLED Color Gamut
Natural
DCI-P3 mode – DCI-P3 Standard Color Gamut
Natural
sRGB mode – sRGB / Rec.709 Standard Color Gamut
Automatic
Color Management for Content with ICC Color Profiles
|
The Galaxy S10 supports 2 Standard Color
Gamuts including the new wider DCI-P3 Color Gamut that is
used in 4K Ultra HD TV content.
|
|
Display Resolution
|
3040 x 1440
pixels
New 3K
Quad HD+
|
Screen Pixel Resolution.
Quad HD can display four 1280x720 HD
images.
|
|
Total Number of Pixels
|
4.4 Mega
Pixels
|
Total Number of Display Pixels.
|
|
Pixels Per Inch PPI
|
550 PPI
with Diamond Pixels
Excellent
|
Sharpness depends on the viewing distance
and PPI.
See this on
the visual acuity for a true Retina Display
|
|
Sub-Pixels Per Inch
|
Red
390 SPPI
Green
550 SPPI
Blue
390 SPPI
|
Diamond Pixel displays have only half the
number of
Red and Blue Sub-Pixels as RGB Stripe
displays.
See Diamond Pixels
|
|
Total Number of Sub-Pixels
|
Red
2.2 Million Sub-Pixels
Green 4.4
Million Sub-Pixels
Blue
2.2 Million Sub-Pixels
|
Number of Mega Sub-Pixels for Red,
Green, Blue.
Diamond Pixel displays have only half the
number of
Red and Blue Sub-Pixels as RGB Stripe
displays.
At High PPI this is generally not visible
due to the
use of Sub-Pixel Rendering.
|
|
20/20 Vision Distance
where Pixels or Sub-Pixels
are Not Resolved
|
6.2
inches / 15.9 cm for White and Green Sub-Pixels with 20/20 Vision
8.8
inches / 22.4 cm for Red and Blue Sub-Pixels with 20/20 Vision
|
For 20/20 Vision the minimum Viewing
Distance
where the screen appears perfectly sharp
to the eye.
At 10 inches from the screen 20/20 Vision
is 344 PPI.
|
|
Display Sharpness
at Typical Viewing Distances
|
Galaxy S10 Display
appears Perfectly Sharp
Pixels are
not Resolved with 20/20 Vision
at Typical
Viewing Distances of
10 to
18 inches
25 to 46
cm
|
The Typical Viewing Distances for this
screen size
are in the range of 10 to 18 inches or
25 to 46 cm.
Also note that eye’s resolution is much
lower for
Red and Blue color content than White
and Green.
|
|
Appears Perfectly Sharp
at Typical Viewing Distances
|
Yes
|
Typical Viewing Distances are 10 to 18
inches
or 25 to 46 cm for this screen size.
|
|
Photo Viewer Color Depth
|
Full
24-bit Color
No
Dithering Visible
256
Intensity Levels
|
Some Smartphones and Tablets still have
some
form of 16-bit color depth in the
Gallery Viewer.
The Samsung Galaxy S10 does not have
this issue.
|
|
Overall Assessments
This section summarizes
the results for all of the extensive Lab Measurements and Viewing Tests
performed on the display.
See Screen Reflections, Brightness
and Contrast, Colors and Intensities,
Viewing Angles, OLED
Spectra, Display Power.
The
Galaxy S10 has ICC Color Management that automatically switches to the
appropriate Color Gamut for the on-screen content.
Here
we provide results for the Vivid mode, which has the Native Wide Color Gamut of the OLED
display,
the
Natural DCI-P3 mode, which is calibrated for the new DCI-P3 Gamut that is used
in 4K Ultra HD TVs, and
the
Natural sRGB mode, which is calibrated for the sRGB / Rec.709 Gamut that is used for most current
consumer photo, video,
web, and computer content.
|
Categories
|
Vivid
mode
Wide Color
Gamut
|
Natural
mode
DCI-P3
Content
|
Natural
mode
sRGB
Content
|
Comments
|
|
Viewing Tests
in Subdued Ambient Lighting
|
Very Good
Images
Photos and
Videos
have Vivid
Color
and
Accurate Contrast
Wide Color
Gamut Mode
Intentionally
Vivid Colors
|
Excellent
Images
Photos and
Videos
have
Excellent Color
and
Accurate Contrast
Accurate
DCI-P3 Content
|
Excellent
Images
Photos and
Videos
have Excellent
Color
and
Accurate Contrast
Accurate
sRGB Content
|
The Viewing Tests examine the accuracy
of
photographic images by comparing the
displays
to a calibrated studio monitor and TV.
|
|
Variation with Viewing Angle
Colors and Brightness
See Viewing Angles
|
Small Color
Shifts
with
Viewing Angle
Small
Brightness Shifts
with
Viewing Angle
|
Small Color
Shifts
with
Viewing Angle
Small
Brightness Shifts
with
Viewing Angle
|
Small Color
Shifts
with
Viewing Angle
Small
Brightness Shifts
with
Viewing Angle
|
The Galaxy S10 display has a relatively
small
decrease in Brightness with Viewing
Angle and
relatively small Color Shifts with
Viewing Angle.
See the Viewing Angles section for details.
|
|
Overall Display Assessment
Lab Tests and Measurements
|
Excellent
OLED Display
Wide Color
Gamut Mode
|
Excellent
OLED Display
Accurate
DCI-P3 Content
|
Excellent
OLED Display
Accurate
sRGB Content
|
The Galaxy S10 OLED Display performed
very well in the Lab Tests and Measurements.
|
|
|
|
Absolute Color Accuracy
Measured over Entire Gamut
See Figure 2 and Colors
|
Good Color
Accuracy
Colors
More Saturated
Intentionally
Vivid Colors
|
Excellent
Color Accuracy
Color
Errors are Very Small
Accurate
DCI-P3 Content
|
Excellent
Color Accuracy
Color
Errors are Very Small
Accurate
sRGB Content
|
Absolute
Color Accuracy is measured with a
Spectroradiometer
for 41
Reference Colors
uniformly
distributed within the entire Color Gamut.
See
Figure 2 and Colors for details.
|
|
Image Contrast Accuracy
See Figure 3 and Contrast
|
Very Good
Accuracy
Image
Contrast
Slightly
Too High
|
Excellent
Accuracy
Image
Contrast
Very
Accurate
|
Excellent
Accuracy
Image
Contrast
Very
Accurate
|
The
Image Contrast Accuracy is determined by
measuring
the Log Intensity Scale and Gamma.
See
Figure 3 and Contrast for details.
|
|
Performance in Ambient Light
Display Brightness
Screen Reflectance
Contrast Rating
See Brightness and Contrast
See Screen Reflections
|
High
Display Brightness
Very Low
Reflectance
High
Contrast Rating
for
Ambient Light
Higher
Brightness with
Auto
Brightness On
|
High Display
Brightness
Very Low
Reflectance
High
Contrast Rating
for
Ambient Light
Higher
Brightness with
Auto
Brightness On
|
High
Display Brightness
Very Low
Reflectance
High
Contrast Rating
for
Ambient Light
Higher
Brightness with
Auto
Brightness On
|
Smartphones
are seldom used in the dark.
Screen
Brightness and Reflectance determine
the
Contrast Rating for High Ambient Light.
See
the Brightness and Contrast section for details.
See
the Screen Reflections section for details.
|
|
Overall Display Calibration
Image and Picture Quality
Lab Tests and Viewing Tests
|
Intentionally Vivid Colors
Wide Color
Gamut Mode
|
Excellent Calibration
Accurate
DCI-P3 Content
|
Excellent Calibration
Accurate
sRGB Content
|
Galaxy S10 display has a Natural Mode
that
delivers accurately calibrated colors
and images
and a Vivid Color Mode that is preferred
by
some users and for some applications.
|
|
|
Overall Display Grade
Overall
Assessment
|
Overall Galaxy S10 Display
Grade is Excellent A+
Best Performing Most
Accurate Smartphone Display that we have ever tested.
Samsung continues systematically
improving OLED Displays
|
The Galaxy S10 display delivers excellent
image quality, has both Natural Color
Accurate
modes and a Vivid Mode with a Wide Color
Gamut,
has High Screen Brightness and low
Reflectance,
has good Viewing Angles, and is an all
around
top performing Smartphone display.
|
|
Wide Color Gamut Mode
Also Best
for Viewing in
High
Ambient Light
|
Accurate
DCI-P3 Content
For Viewing
4K UHD TV
DCI-P3
Cinema Content
|
Accurate
sRGB mode
For Viewing
Most Content
Photo Video
Movie Web
|
Categories
|
Vivid
mode
Wide Color
Gamut
|
Natural
mode
DCI-P3
Content
|
Natural
mode
sRGB
Content
|
Comments
|
|
Screen Reflections
All display screens are mirrors good enough to use
for personal grooming – but that is actually a very bad feature…
We measured the light reflected from all directions
and also direct mirror (specular) reflections, which are much more
distracting and cause more eye strain. Many
Smartphones still have greater than 10 percent reflections that make
the screen much harder to read even in moderate
ambient light levels, requiring ever higher brightness settings that
waste precious battery power. Manufacturers should
reduce the mirror reflections with anti-reflection coatings and
matte or haze surface finishes.
Our Lab Measurements include Average
Reflectance for Ambient Light from All Directions and for Mirror Reflections.
We use an Integrating Hemisphere and a
highly collimated pencil light beam together with a Spectroradiometer.
Note that the Screen
Reflectance is exactly the same for all of the Galaxy S10 Screen Modes.
The Galaxy S10 has very close to the
lowest Screen Reflectance that we have ever measured for a Smartphone.
These results are extremely important
for screen readability, picture quality, and color accuracy in ambient light.
For Comparison the Galaxy S9 has 4.4 percent Average Screen
Reflectance and 5.7 percent Mirror Reflections.
|
Categories
|
Galaxy
S10
|
Comments
|
|
Average Screen Reflection
Light From All Directions
|
4.4 percent
for
Ambient Light Reflections
Excellent
|
Measured using an Integrating Hemisphere
and
a Spectroradiometer.
The lowest value we have ever measured
for a Smartphone is 4.3 percent.
|
|
Mirror Reflections
Percentage of Light Reflected
|
5.6
percent
for Mirror Reflections
Very Good
|
These are the most annoying types of
Reflections.
Measured using a Spectroradiometer and a
narrow
collimated pencil beam of light
reflected off the screen.
The lowest value we have ever measured
for a Smartphone is 5.4 percent.
|
|
Brightness and Contrast
The Contrast Ratio
is the specification that gets the most attention, but it only applies for
low ambient light, which is seldom
the case for mobile displays.
Much more important is the Contrast
Rating for High Ambient Light, which indicates how easy it is to read
the screen under
high ambient lighting and depends on both
the Maximum Brightness and the Screen Reflectance. The larger the better.
The display’s actual on-screen Contrast Ratio changes with the Ambient Light lux
level and is proportional to the Contrast Rating.
|
Categories
|
Vivid
mode
Wide Color
Gamut
|
Natural
mode
DCI-P3
Content
|
Natural
mode
sRGB
Content
|
Comments
|
|
Home Screen Peak Brightness
Measured for White
|
Brightness
440 cd/m2
Very Good
|
Brightness
370 cd/m2
Very Good
|
Brightness
370 cd/m2
Very Good
|
The Peak Brightness for White on the
Home Screen.
|
|
Measured Average Brightness
50% Average Picture Level
|
Brightness
460 cd/m2
Very Good
|
Brightness
397 cd/m2
Very Good
|
Brightness
397 cd/m2
Very Good
|
This is the Brightness for typical
screen content
that has a 50% Average Picture Level.
|
|
Measured Full Brightness
100% Full Screen White
|
Brightness
420 cd/m2
Very Good
|
Brightness
403 cd/m2
Very Good
|
Brightness
404 cd/m2
Very Good
|
This is the Brightness for a screen that
is entirely
all white with 100% Average Picture
Level.
|
|
Measured Peak Brightness
1% Average Picture Level
|
Brightness
530 cd/m2
Excellent
|
Brightness
395 cd/m2
Very Good
|
Brightness
394 cd/m2
Very Good
|
This is the Peak Brightness for a screen
that
has only a tiny 1% Average Picture
Level.
|
|
Dynamic Brightness
Change in Luminance with
Average Picture Level APL
|
21 percent
Decrease
Intentionally
Large
|
2 percent
Decrease
Excellent
|
2 percent
Decrease
Excellent
|
This is the percent Brightness decrease
with APL
Average Picture Level. Ideally should be
0 percent.
|
|
Low Ambient Light
|
|
Lowest Peak Brightness
Super Dimming Mode
Brightness Slider to Minimum
|
2 cd/m2
For Very
Low Light
|
2 cd/m2
For Very
Low Light
|
2 cd/m2
For Very
Low Light
|
This is the Lowest Brightness with the
Slider set to
Minimum. This is useful for working in
very dark
environments. Picture Quality remains
Excellent.
|
|
Black Brightness at 0 lux
at Maximum Brightness Setting
|
0 cd/m2
Outstanding
|
0 cd/m2
Outstanding
|
0 cd/m2
Outstanding
|
Black Brightness is important for Low
Ambient Light,
which is seldom the case for mobile
devices.
|
|
Contrast Ratio at 0 lux
Relevant for Low Ambient Light
|
Infinite
Outstanding
|
Infinite
Outstanding
|
Infinite
Outstanding
|
Only relevant for Low Ambient Light,
which is seldom the case for mobile
devices.
|
|
High Brightness Mode
Automatic Brightness in High Ambient
Light
|
|
Measured High Brightness Mode
50% Average Picture Level
|
High
Brightness Mode
942 cd/m2
Excellent
|
High
Brightness Mode
905 cd/m2
Excellent
|
High
Brightness Mode
905 cd/m2
Excellent
|
This is the Brightness for typical
screen content
that has a 50% Average Picture Level.
|
|
Measured High Brightness Mode
100% Full screen White
|
High
Brightness Mode
804 cd/m2
Excellent
|
High
Brightness Mode
786 cd/m2
Excellent
|
High
Brightness Mode
786 cd/m2
Excellent
|
This is the Brightness for a screen that
is entirely
all white with 100% Average Picture
Level.
|
|
Measured High Brightness Mode
1% Average Picture Level
|
High
Brightness Mode
1,215 cd/m2
Excellent
|
High
Brightness Mode
1,153 cd/m2
Excellent
|
High
Brightness Mode
1,153 cd/m2
Excellent
|
This is the Peak Brightness for a screen
that
has only a small 1% Average Picture
Level.
|
|
High Ambient Light Contrast Rating
|
|
Contrast Rating
for High Ambient Light
The Higher the Better
for Screen Readability
in High Ambient Light
|
95 – 120
With Manual
Brightness
Very Good
183 – 276
High
Brightness Mode
Excellent
|
90 – 92
With Manual
Brightness
Very Good
179 – 262
High
Brightness Mode
Excellent
|
90 – 92
With Manual
Brightness
Very Good
179 – 262
High
Brightness Mode
Excellent
|
Depends on the Screen Reflectance and
Brightness.
Defined as Maximum Brightness / Average Reflectance.
The display’s actual on-screen Contrast
Ratio
changes with the Ambient Light lux level
and
is proportional to the Contrast Rating.
|
|
Screen Readability
in High Ambient Light
|
Very Good A
With Manual
Brightness
Excellent
A+
With Auto
Brightness On
|
Very Good A
With Manual
Brightness
Excellent A+
With Auto
Brightness On
|
Very Good A
With Manual
Brightness
Excellent A+
With Auto
Brightness On
|
Indicates how easy it is to read the
screen
under High Ambient Lighting. Depends on
both the Screen Reflectance and
Brightness.
See High
Ambient Light Screen Shots
|
|
Colors and Intensities
The Color Gamut, Intensity Scale, and White Point
determine the quality and accuracy of all displayed images and all
the image colors. Bigger is definitely Not Better
because the display needs to match all the standards that were used
when the content was produced.
The Galaxy S10 Natural mode has ICC
Color Management that automatically switches to the appropriate Color Gamut
for the current on-screen content.
|
Categories
|
Vivid
mode
Wide Color
Gamut
|
Natural
mode
DCI-P3
Content
|
Natural
mode
sRGB
Content
|
Comments
|
|
Color of White
Color Temperature in degrees
Measured in the dark at 0 lux
See Figure 1
|
7,102 K
1.5 JNCD
from D65 White
User
Adjustable
from 6,400
K to 7,900 K
White is
Somewhat Bluish
Intentionally
Bluish Mode
For Some
Applications
the White
Point Will Vary
with the
Ambient Lighting
|
6,578 K
0.2 JNCD
from D65 White
Very Close
to Standard
Accurate
DCI-P3 Content
See Figure 1
|
6,520 K
0.2 JNCD
from D65 White
Very Close
to Standard
Accurate
sRGB Content
See Figure 1
|
D65 with 6,500 K is the standard color
of White
for most Consumer Content and needed for
accurate color reproduction of all
images.
JNCD is a Just Noticeable Color Difference.
White Point accuracy is more critical than
other colors.
See Figure 1
for the plotted White Points.
See Figure 2 for the
definition of JNCD.
|
|
Color Gamut
Measured in the dark at 0 lux
See Figure 1
|
113
percent
DCI-P3
Cinema Gamut
Intentionally
Vivid Colors
Wide Color
Gamut Mode
142
percent
sRGB /
Rec.709 Gamut
Intentionally
Vivid Colors
Wide Color
Gamut Mode
See Figure 1
|
100
percent
DCI-P3
Cinema Gamut
Very Close
to Standard
Accurate
DCI-P3 Content
See Figure 1
|
102
percent
sRGB /
Rec.709 Gamut
Very Close
to Standard
Accurate
sRGB Content
See Figure 1
|
Most current consumer content uses sRGB /
Rec.709.
The new 4K UHD TVs and Digital Cinema use
DCI-P3.
A Wide Color Gamut is useful in High
Ambient Light
and for some applications. It can be used
with Color
Management to dynamically change the
Gamut.
See Figure 1
|
|
Absolute Color Accuracy
|
|
Absolute Color Accuracy
Average Color Error at 0 lux
For 41 Reference Colors
Just Noticeable Color Difference
See Figure 2
|
Average Color Error
From sRGB
/ Rec.709
Δ(u’v’)
= 0.0309
7.7 JNCD
Intentionally
Vivid Colors
Wide Color
Gamut Mode
See Figure 2
|
Average Color Error
From
DCI-P3
Δ(u’v’)
= 0.0015
0.4 JNCD
Excellent
Accuracy
Accurate
DCI-P3 Content
See Figure 2
|
Average Color Error
From sRGB
/ Rec.709
Δ(u’v’)
= 0.0019
0.5 JNCD
Excellent
Accuracy
Accurate
sRGB Content
See Figure 2
|
JNCD is a Just Noticeable Color Difference.
See Figure 2 for the
definition of JNCD and for the
Accuracy Plots showing
the measured Color Errors.
Color Errors below 3.5 JNCD are Very
Good.
Color Errors 3.5 to 7.0 JNCD are
Good.
Color Errors above 7.0 JNCD are
Poor.
|
|
Absolute Color Accuracy
Largest Color Error at 0 lux
For 41 Reference Colors
Just Noticeable Color Difference
See Figure 2
|
Vivid mode
Largest Color Error
From sRGB
/ Rec.709
Δ(u’v’)
= 0.0575
15.4 JNCD for Red
Intentionally
Vivid Colors
Wide Color
Gamut Mode
See Figure 2
|
Natural DCI
mode
Largest Color Error
From
DCI-P3
Δ(u’v’)
= 0.0040
1.0 JNCD for Magenta
Excellent
Accuracy
Accurate
DCI-P3 Content
See Figure 2
|
Natural
sRGB mode
Largest Color Error
From sRGB
/ Rec.709
Δ(u’v’)
= 0.0045
1.1 JNCD for Red
Excellent
Accuracy
Accurate
sRGB Content
See Figure 2
|
JNCD is a Just Noticeable Color Difference.
See Figure 2 for the
definition of JNCD and for the
Accuracy Plots showing
the measured Color Errors.
Color Errors below 3.5 JNCD are Very
Good.
Color Errors 3.5 to 7.0 JNCD are
Good.
Color Errors above 7.0 JNCD are
Poor.
|
|
Changes of Absolute Color Accuracy with Average Picture Level APL
Measured Shifts in the Absolute Color Accuracy with Image Content
from Low 1% APL to High 50% APL
|
|
Shift in the Color of White
Just Noticeable Color Difference
See Figure 4
|
Vivid mode
Intentionally
Variable
|
White Point
Color Shift
from Low
to High APL
Δ(u’v’)
= 0.0004
0.1 JNCD
Excellent
See Figure 4
|
White Point
Color Shift
from Low
to High APL
Δ(u’v’)
= 0.0002
0.1 JNCD
Excellent
See Figure 4
|
JNCD is a Just Noticeable Color Difference
See Figure 2 for the
definition of JNCD.
See Figure 4 for the
measured Color Shifts.
Color Shifts below 3.5 JNCD are Very
Good.
Color Shifts 3.5 to 7.0 JNCD are
Good.
Color Shifts above 7.0 JNCD are
Poor.
|
|
Average Color Shift
For 41 Reference Colors
Just Noticeable Color Difference
See Figure 4
|
Vivid mode
Intentionally
Variable
|
Average
Color Shift
from Low
to High APL
Δ(u’v’)
= 0.0017
0.4 JNCD
Excellent
See Figure 4
|
Average
Color Shift
from Low
to High APL
Δ(u’v’)
= 0.0015
0.4 JNCD
Excellent
See Figure 4
|
JNCD is a Just Noticeable Color Difference.
See Figure 2 for the
definition of JNCD.
See Figure 4 for the
measured Color Shifts.
Color Shifts below 3.5 JNCD are Very
Good.
Color Shifts 3.5 to 7.0 JNCD are
Good.
Color Shifts above 7.0 JNCD are
Poor.
|
|
Largest Color Shift
For 41 Reference Colors
Just Noticeable Color Difference
See Figure 4
|
Vivid mode
Intentionally
Variable
|
Largest Color Shift
from Low
to High APL
Δ(u’v’)
= 0.0040
1.0 JNCD
for 50% Red
Excellent
See Figure 4
|
Largest Color Shift
from Low
to High APL
Δ(u’v’)
= 0.0030
0.8 JNCD
for 50% Red
Excellent
See Figure 4
|
JNCD is a Just Noticeable Color Difference
See Figure 2 for the
definition of JNCD.
See Figure 4 for the
measured Color Shifts.
Color Shifts below 3.5 JNCD are Very
Good.
Color Shifts 3.5 to 7.0 JNCD are
Good.
Color Shifts above 7.0 JNCD are
Poor.
|
|
|
|
Dynamic Brightness
Change in Luminance with
Average Picture Level APL
|
21 percent
Decrease
Intentionally
Large
|
2 percent
Decrease
Excellent
|
2 percent
Decrease
Excellent
|
This is the percent Brightness decrease
with APL
Average Picture Level. Ideally should be
0 percent.
|
|
Intensity Scale and
Image Contrast
See Figure 3
|
Smooth and
Straight
Very Good
Slightly
Too Steep
See Figure 3
|
Very
Smooth and Straight
Excellent
Very
Accurate
See Figure 3
|
Very
Smooth and Straight
Excellent
Very
Accurate
See Figure 3
|
The Intensity Scale controls image
contrast needed
for accurate Image Contrast and Color
reproduction.
See Figure 3
|
|
Gamma for the Intensity Scale
Larger has more Image Contrast
See Figure 3
|
2.33
Very Good
Gamma
Slightly Too High
|
2.20
Excellent
Gamma Very
Accurate
|
2.19
Excellent
Gamma Very
Accurate
|
Gamma is the log slope of the Intensity
Scale.
Gamma of 2.20 is the standard and needed
for
accurate Image Contrast and Color
reproduction.
See Figure 3
|
|
Image Contrast Accuracy
|
Very Good
|
Excellent
|
Excellent
|
See Figure 3
|
|
Viewing Angles
The variation of
Brightness, Contrast, and Color with Viewing Angle is especially important
for Smartphones because
of their larger screen
and multiple viewers. The typical manufacturer 176+ degree specification for
LCD Viewing Angle
is nonsense because that
is where the Contrast Ratio falls to a miniscule 10. For most LCDs there are
substantial
degradations at less
than ±30 degrees, which is not an atypical Viewing Angle for Smartphones and
Tablets.
The
Viewing Angle variations are essentially identical for all of the Galaxy S10
Screen Modes.
The
Viewing Angle performance is also very important for a single viewer because
the Viewing Angle can vary
significantly
based on how the Smartphone is held. The Viewing Angle can be very large if
resting on a table or desk.
The Galaxy S10 display has a
Brightness (Luminance) fall off with Viewing Angle that is much smaller than
the best LCD displays.
The Galaxy S10 has the
smallest Color Shift of White with Viewing Angle of any OLED display, 0.7
JNCD at 30 degrees.
The White Point Color Shift is
the most viewer noticeable Color Shift with Viewing Angle because it is often
the screen background.
|
Categories
|
Vivid
mode
Wide Color
Gamut
|
Natural
mode
DCI-P3
Content
|
Natural
mode
sRGB
Content
|
Comments
|
|
Brightness Decrease
at a 30 degree Viewing Angle
|
23 percent
Decrease
Small
Decrease
Very Good
|
Most screens become less bright when
tilted.
LCD decrease is generally greater than 50
percent.
|
|
Contrast Ratio at 0 lux
at a 30 degree Viewing Angle
|
Infinite
Contrast Ratio
Outstanding
|
A measure of screen readability when the
screen
is tilted under low ambient lighting.
|
|
White Point Color Shift
at a 30 degree Viewing Angle
|
Small Color
Shift
Δ(u’v’)
= 0.0028
0.7 JNCD
Excellent
|
JNCD is a Just Noticeable Color Difference.
See Figure 2 for the
definition of JNCD.
Color Shifts below 3.5 JNCD are Very
Good.
|
|
Primary Color Shifts
Largest Color Shift for R,G,B
at a 30 degree Viewing Angle
|
Largest Color Shift
Δ(u’v’)
= 0.0163 for Pure Red
4.1 JNCD
Very Good
|
JNCD is a Just Noticeable Color Difference.
See Figure 2 for the
definition of JNCD.
Largest Color Shifts below 5.0 JNCD are Very
Good.
|
|
Color Shifts for Color Mixtures
at a 30 degree Viewing Angle
Reference Brown (255, 128, 0)
|
Small
Color Shift
Δ(u’v’)
= 0.0062
1.6 JNCD
Excellent
|
JNCD is a Just Noticeable Color Difference.
Color Shifts for non-IPS LCDs are about 10
JNCD.
Reference Brown is a good indicator of
color shifts
with angle because of unequal drive
levels and
roughly equal luminance contributions
from Red
and Green. See Figure 2 for the
definition of JNCD.
|
|
Display Spectra
The Display Spectra for the Screen Modes and for the Night Mode Blue Light
Filter
are measured in Figure 5 below.
The Blue Light Filter is designed to change the color
balance of the display in order to reduce the amount of Blue Light
produced by the display,
which some recent research indicates can affect how well users sleep
afterwards.
Display Power Consumption
The display power was measured using a Linear
Regression between Luminance and AC Power with a fully charged battery.
All of our measurements were performed in the Galaxy
S10 High Performance Mode.
Since the displays have different screen sizes and
maximum brightness, the display power values below are also scaled
to the same screen Brightness (Luminance) and same
screen area in order to compare their Relative Power
Efficiencies.
Comparison with LCDs
While LCDs remain more power efficient for images with
mostly full screen white content (like all text screens on a
white background, for example), OLEDs are more power
efficient for typical mixed image content because they are
emissive displays so their power varies with the
Average Picture Level (average Brightness) of the image content over
the entire screen. For OLEDs, Black pixels and
sub-pixels don’t use any power so screens with Black backgrounds are
very power efficient for OLEDs. For LCDs the display
power is fixed and independent of image content.
For OLEDs the Display Power
depends on the Picture Content.
An entirely Black OLED Screen
uses 0 watts of Display Power.
Currently, OLED displays are
more power efficient than LCDs for Average Pictures Levels of 70 percent or
less, and
LCDs are more power efficient
for Average Picture Levels above 70 percent.
Since both technologies are continuing to improve their
power efficiencies, the crossover will continue to change with time.
Comparison with the Galaxy S9
Below we compare the Relative Display
Power Efficiencies of the Galaxy S10 with the Galaxy S9.
The results are scaled
for the same Luminance and Screen Area.
Since 2013 the Display Power
Efficiency of the Galaxy series of Smartphones has improved by a very
impressive 65%.
The Galaxy S10 has 10% higher
Relative Display Power Efficiency than the display on the Galaxy S9.
For the same Screen Area and
same Luminance as the Galaxy S9 the Galaxy S10 display would use 9% less
power.
|
|
Categories
|
Galaxy
S9
|
Galaxy
S10
|
Comments
|
|
Average Display Power
Maximum Brightness at
50% Average Picture Level
|
50% Average
Picture Level
0.95 watts
with 446
cd/m2
13.1 inch2
Screen Area
|
50% Average
Picture Level
1.00 watts
with 460
cd/m2
14.4 inch2
Screen Area
|
This measures the Average Display Power
for
a wide range of image content.
|
|
Relative Power Efficiency
50% Average Picture Level
Compared to Galaxy S9
For the same S9 446 cd/m2
For the same Screen Area
|
Relative Average Power 100%
0.95 watts
with the same 446 cd/m2
with the same 13.1 inch2
Screen Area
|
Relative Average Power 93%
0.88 watts
with the same 446 cd/m2
with the same 13.1 inch2
Screen Area
|
This
compares the Relative Power Efficiency
by
scaling the measured Display Power to the
same
Screen Brightness and same Screen Area
as
the Galaxy S9.
|
|
|
|
Maximum Display Power
Full White Screen
at Maximum Brightness
|
Maximum
Power
Full Screen
White
1.70 watts
with 395
cd/m2
13.1 inch2
Screen Area
|
Maximum
Power
Full Screen
White
1.80 watts
with 420
cd/m2
14.4 inch2
Screen Area
|
This measures the Maximum Display power
for
a screen that is entirely Peak White.
|
|
Relative Power Efficiency
Maximum Display Power
Compared to Galaxy S9
For the same S9 395 cd/m2
For the same Screen Area
|
Relative Maximum Power 100%
1.70 watts
with the same 395 cd/m2
with the same 13.1 inch2
Screen Area
|
Relative Maximum Power 91%
1.54 watts
with the same 395 cd/m2
with the same 13.1 inch2
Screen Area
|
This
compares the Relative Power Efficiency
by
scaling the measured Display Power to the
same
Screen Brightness and same Screen Area
as
the Galaxy S9.
|
|
|
|
|
|
|
About the Author
Dr. Raymond Soneira is
President of DisplayMate Technologies Corporation of Amherst, New Hampshire,
which produces display calibration, evaluation, and diagnostic products for
consumers, technicians, and manufacturers. See www.displaymate.com. He is a research
scientist with a career that spans physics, computer science, and television
system design. Dr. Soneira obtained his Ph.D. in Theoretical Physics from
Princeton University, spent 5 years as a Long-Term Member of the world famous
Institute for Advanced Study in Princeton, another 5 years as a Principal
Investigator in the Computer Systems Research Laboratory at AT&T Bell
Laboratories, and has also designed, tested, and installed color television
broadcast equipment for the CBS Television Network Engineering and Development
Department. He has authored over 35 research articles in scientific journals in
physics and computer science, including Scientific American. If you have any
comments or questions about the article, you can contact him at dtso.info@displaymate.com.
DisplayMate Display Optimization Technology
All
Smartphone, Tablet, Monitor and TV displays can be significantly improved using
DisplayMate’s proprietary very advanced scientific analysis and mathematical
display modeling and optimization of the display hardware, factory calibration,
and driver parameters. We help manufacturers with expert display procurement,
prototype development, display performance improvement and optimization,
testing displays to meet contract specifications, and production quality
control so that they don’t make mistakes similar to those that are exposed in
our public Display Technology Shoot-Out series for consumers. This article is a
lite version of our advanced scientific analysis – before the benefits of our DisplayMate Display Optimization
Technology, which can correct or improve all of these issues. If you are a
display or product manufacturer and want to significantly improve display
performance for a competitive advantage then Contact DisplayMate Technologies.
About DisplayMate Technologies
DisplayMate Technologies specializes in proprietary advanced
scientific display calibration and mathematical display optimization to deliver
unsurpassed objective performance, picture quality and accuracy for all types
of displays including video and computer monitors, projectors, TVs, mobile
displays such as Smartphones and Tablets, and all display technologies
including LCD, OLED, 3D, LED, LCoS, Plasma, DLP and CRT. This article is a lite version of
our intensive scientific analysis of Smartphone and Smartphone mobile displays
– before the benefits of our advanced mathematical DisplayMate Display Optimization
Technology, which can correct or improve many of the display deficiencies. We offer DisplayMate display
calibration software for consumers and advanced DisplayMate display diagnostic
and calibration software for technicians and test labs.
For
manufacturers we offer Consulting Services that include advanced Lab testing
and evaluations, confidential Shoot-Outs with competing products, calibration
and optimization for displays, cameras and their User Interface, plus on-site
and factory visits. We help manufacturers with expert display procurement,
prototype development, and production quality control so they don’t make
mistakes similar to those that are exposed in our Display Technology Shoot-Out
series. See our world renown Display
Technology Shoot-Out public article series for an introduction and preview.
DisplayMate’s
advanced scientific optimizations can make lower cost panels look as good or
better than more expensive higher performance displays. If you are a display or
product manufacturer and want to turn your display into a spectacular one to
surpass your competition then Contact
DisplayMate Technologies to learn more.
Article Links: Galaxy S9
OLED Display Technology Shoot-Out
Article Links: Galaxy
Note9 OLED Display Technology Shoot-Out
Article Links: Display
Color Gamuts Shoot-Out NTSC to Rec.2020
Article Links: Absolute
Color Accuracy Display Technology Shoot-Out
Article Links: Watching
Displays at Night
Article Links: Display Technology Shoot-Out
Article Series Overview and Home Page
Copyright © 1990-2019 by DisplayMate
Technologies Corporation. All Rights Reserved.
This article, or any part
thereof, may not be copied, reproduced, mirrored, distributed or incorporated
into any other work without
the prior written permission of DisplayMate Technologies Corporation