|
|
|
|
|
|
The JVC Consumer unit had the highest black-level, but it was actually very easy to visually see the differences in black-levels between all of the units. The black-levels can be easily reduced by simply using a less bright projection lamp. The Screen Gain listed in Table 1 can also be lowered. Manufacturers seldom take these approaches because it also reduces the peak brightness of the display, which is often perceived by consumers as more important than the black-level (see below). A better way to reduce the black-level is to use an adjustable iris aperture (manual or automatic) that varies both the black-level and peak brightness at the same time. Generally, with low ambient lighting the black-level is very important while the peak brightness is not very important. With high ambient lighting the reverse is true. A manual iris adjustment allows a viewer to find the best compromise for their particular situation and preferences. None of these units had such a control, although they all would benefit tremendously from one. Note that HDTVs with an iris have variable black-levels, so their black-level specifications may be misleading. Use caution when comparing their published black-levels (and resulting Contrast Ratios) to the values measured here.
Peak Brightness When it comes to brightness many people feel that brighter is better (more on that below). In fact, all of these HDTVs have more than enough brightness for most viewing environments, with the possible exception of a very sunny room. But in order to get good picture quality the ambient room light needs to be controlled, and for a home theater it should be very carefully controlled in order to obtain the excellent contrast and color and gray-scale accuracy that these sets provide. So for a well designed home theater these sets are all way too bright. Unfortunately, when you turn down the brightness (with the Contrast Control) the image quality also decreases because the digital range used for the producing the image also decreases and that increases noise, false contouring and other digital artifacts. To make matters worse, the black-level remains constant. So if we were grading on brightness, the brightest set would get the lowest score (see below).
None-the-less, for both manufacturer’s specifications and showroom sales peak brightness is unfortunately the most important figure after price. One way to increase it is to raise the Screen Gain, which increases brightness by concentrating the light in the direction of the audience, but this also reduces the viewing angles and often introduces speckle, hot spots, and other artifacts into the picture. The easiest way to increase screen brightness is simply to use as much of the projection lamp’s light as possible. This generally gives the white light from the unit a greenish or bluish tint and many HDTVs come preset that way in order to make them look as bright as possible. But for accurate color reproduction the color of white needs to match the standard specified for TVs and HDTVs, which is known as D6500 or D65 and corresponds to the color of natural daylight at noon. (The D is for daylight and it has a blue sky component added to the spectral light distribution of a laboratory black-body raised to an absolute temperature of 6500 degrees Kelvin.) Temperatures greater than 6500 K are too blue and most TVs and HDTVs come from the factory set from 8,000 K to 12,000 K with a bluish tint (like cool-white fluorescent bulbs). Lowering the Color Temperature to match the D6500 standard almost always results in a significant decrease in brightness (luminance) because some portion of the lamp’s luminance must be thrown away to make the adjustment.
Color Temperature alone cannot uniquely specify the color of white because it’s a single one-dimensional parameter, while color is two-dimensional, so it requires two parameters (see below). Colors that lie close to, but not exactly on the black-body curve can still be assigned a Color Temperature value that produces the closest color match to a black-body. This is referred to as a Correlated Color Temperature. Table 1 shows the Correlated Color Temperature and Peak White Luminance measured for each of the units using the Konica Minolta Spectroradiometers. The JVC Consumer and eLCOS units were significantly hotter than the D6500 standard and they were also the two brightest units. In fact, they are among the very brightest monitors I have ever measured. (These calibrated luminance measurements should not be directly compared to most manufacturer’s published specifications because they almost always set every control to maximum in order to print the largest possible brightness value, but that yields unacceptable image quality. Factors of two increases in the published brightness specification are possible this way. See Parts I and IV.) When Brillian sent an engineer to do a factory level recalibration of their 1080 unit we were able to examine the effect of shifting the Color Temperature on peak brightness. (To do this optimally requires that the device profiles be remeasured from scratch using the low-level panel driver electronics rather than using the user or service controls, which operate using the front-end electronics.) Changing the Color Temperature from 6545 K to 7281 K increased the peak white luminance from 457 to 509 cd/m2. Going up to 8000 K or beyond would result in much larger increases in brightness.
Some TVs have two or more Color Temperature settings, often marked as High and Low or Warm and Cool. The High or Cool setting generally produces 9300 K or above, while the Low or Warm setting should get you much closer to D6500. I was intrigued when I saw that the JVC Consumer unit has a dedicated remote control button that activates their “TheaterPro D6500K” settings. The manual explains it this way: “TheaterPro D6500K Color Temperature technology function makes sure that the video you watch is set to the standard Color Temperature.” The product brochure further explains why “D6500K” is so important in much greater detail. Unfortunately, both of the Konica Minolta Spectroradiometers measured 7881 K, which is very far from the promised D6500. The manual and brochure departments should talk to the factory more often…
The Retail Brightness Factor Why are these TVs so bright? Why are the manufacturers putting in bigger lamps and special higher gain screens to make these already way too bright TVs even brighter? I know they’ve all read the earlier articles, so why are they doing this? Sadly, the reason is that in a retail setting brightness is frequently a deciding sales factor. So, like it or not, the manufacturers have to build their sets to be as bright as possible in order to be commercially successful.
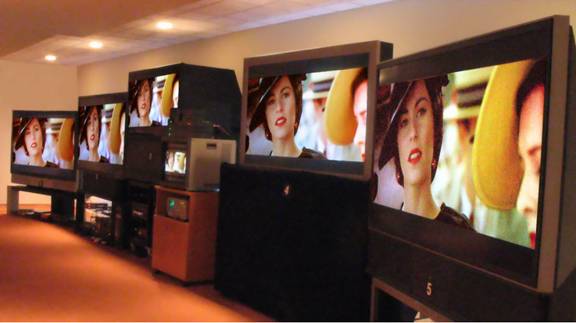
I spoke at length about this with Steven Lopez, manager of the Nashua New Hampshire store of Cambridge SoundWorks (a specialty AV chain based in New England). Steven expanded upon what the manufacturers had already told me, “The unfortunate truth to selling TVs on the sales floor is that bright sets attract the mass consumer. The most accurate sets may not be the most appealing. The brightest units simply make the other nearby sets look anemic and old, kind of like the tired CRT they are replacing. Often that’s enough to tip the scales in a sale, regardless of the price range involved.” He also explained that in order to give all of the sets a fair chance they need to be carefully arranged on the sales floor so as to minimize the impact of this brightness factor. (As an interesting historical aside, Cambridge SoundWorks is one of the companies founded by legendary speaker designer Henry Kloss, who also founded Acoustic Research, KLH and Advent. In 1972 he produced the world's first home projection television, the 3-CRT Advent VideoBeam 1000 with a 7-foot curved front projection screen. He actually left KLH and started Advent in order to develop the projector, but when he ran out of money he started manufacturing Advent speakers in order to finance the projector’s development. He later received an Emmy Award for that revolutionary product.)
TVs that are optimized for the showroom floor at the factory will not look their best in a home theater. It’s another example of the tail wagging the dog. Since these LCoS HDTVs are internally processor and data table driven, a perfect solution would be to have three completely independent factory digital calibrations stored in the already available memory within a set - each with a different transfer function, gamma, screen uniformity calibration table, level of gray-scale compression, and Color Temperature. Note that merely adjusting the normal user and service controls cannot accomplish the same thing (because they operate using the front-end electronics). One set of values would be optimized for the showroom floor, one for bright ambient light home theaters (day use), and a third for low ambient light home theaters (night use). Another great option would be to offer more than one screen: a higher gain version for locations that need high brightness, such as retail stores and sunny living rooms, and a lower gain screen that will produce a dimmer but higher quality image with fewer artifacts.
Contrast Ratio Since the black-level and peak brightness are interdependent for any given display, a really important figure of merit is the ratio of these two values. This is called the Contrast Ratio of the display and it tells us the maximum range of brightness that the display can produce – and the higher the better. (It’s also frequently called the full-field, full on/off, or sequential contrast but a better term would be Dynamic Range because, in my opinion, the term contrast should be reserved for measurements on a single image, not on different screens). A high Contrast Ratio is especially important in imaging and home theater applications, where, for example, bright/day scenes and dark/night scenes both need to be rendered accurately. The higher the Contrast Ratio the better the display will be able to reproduce wide differences in scene brightness. More importantly, for a given peak brightness a higher Contrast Ratio will produce a darker black-level.
The last row of Table 1 lists the Contrast Ratio for each unit. The values range from 936 [to 1] for the JVC Consumer unit, which is very good for its price class, up to a very impressive 4425 for the eLCOS unit. These are the highest values I’ve ever measured for a non-CRT display. With an iris aperture (below) it’s quite likely that the measured values would have been even higher. The JVC Professional unit was a prototype. When it was returned to JVC, they confirmed the Contrast Ratio measurement in Table 1. When they refurbished the unit and put in a brand new projection lamp the Contrast Ratio increased to 2606. The final production version should have a Contrast Ratio of 3000.
Although you’ll see higher values published in the spec sheets for many HDTVs, they are generally for overdriven displays pushed to the extreme and not for the calibrated and accurate gray-scales, gamma functions and specific Color Temperatures measured here. As an example, the “wide-open” Contrast Ratio values for the Brillian and eLCOS units both exceed 5500 (without an iris aperture). These Contrast Ratio values actually indicate that the manufacturers are being incredibly conservative with the Contrast Ratio specifications they provided for the LCoS Panels by themselves in Table 2 of Part A. The values listed there should be roughly 50 to 100 percent larger than the full-field Contrast Ratios that we measured at the screen (because the projection optics reduces the panel’s contrast).
Another element that can (artificially) jack up the Contrast Ratio is a dynamic iris that is wide open for the Peak White measurement and fully closed for the Black-Level measurement. That’s how some HDTVs are able to advertise Contrast Ratios of 10,000 or more, but those figures can be very misleading and should not be compared to the values measured here.
Iris Control If the brightness of an HDTV is too high, it should be lowered, otherwise viewers will likely suffer eyestrain and possibly even headaches. If sunlight is a factor then you may need different settings for daytime and nighttime. The traditional way to lower the brightness of a TV is with the Contrast Control, which varies the level of the video signal. This works quite well for CRTs, which are pure analog devices with extremely dark black-levels, but it works rather poorly for all of the other display technologies because their black-levels are much higher and they all use digital signal processing internally (whether or not the input signal is analog or digital). There are two good methods for lowering brightness: one is to supply less power to the projection lamp, a second and even better one is to use an iris aperture somewhere in the optical path to cut down the light throughput. (Yet another method, which is equivalent to lowering the lamp power, and that will be available with the JVC Professional unit, is the use of variable crossed polarizing filters to lower the effective lamp brightness. This has all of the advantages of an iris aperture except that the Contrast Ratio will remain constant, rather than increase, as discussed below.)
The Peak Brightness listed in Table 1 was set to digital intensity level 255 for all of the Shoot-Out tests. While the nominal peak video level is digital level 235 (Reference White), source material is allowed to stray into the headroom area of 236 to 254 for very bright highlights (technically, level 255 is reserved and not allowed for digital video, so it’s processed as level 254). Most HDTVs will be set up at the factory to reach Peak White at level 235 in order to maximize picture brightness, but for accurate image reproduction the gray-scale needs to be extended so that Peak White is reached at level 255. This will reduce picture brightness (luminance) by 17% (assuming a Gamma of 2.2, see below). Here we’re considering the reverse situation: the luminance at Reference White, level 235, in Table 2 is 17% lower than Peak White, level 255, in Table 1. For a moderately lit room, there are a number of industry recommendations for a Reference White Luminance – they range from 80 to 170 cd/m2, which is still a lot dimmer than these HDTVs. To be extra conservative in the discussion that follows I have picked the largest of these values. Table 2 compares the results between adjusting the luminance to 170 cd/m2 using an Iris and a Contrast Control.
Table 2 : Adjusting the Luminance using an Iris or Contrast Control
The advantage of an Iris is that it lowers the black-level along with Peak or Reference White, while the black-level remains constant when using the Contrast Control (2nd and 3rd rows). As a result, the hard won Contrast Ratio values all fall substantially from the Table 1 values when using a Contrast Control (5th row). When using an Iris the black-level actually falls faster than the Peak or Reference White luminance due to improvements in the optical path, so the Contrast Ratio actually goes up when using an Iris (4th row). In many cases it will go up by 50 or even 100 percent or more, so the effect can be quite substantial. This tradeoff of brightness for Contrast Ratio is used in many high-end projectors.
Another major problem with using the Contrast Control to decrease brightness is that the number of available digital intensity levels decreases as well. With fewer levels, false contouring and other digital artifacts increase. This effect is shown in the last row of Table 2, which shows the percentage of available digital levels that are available when using the Contrast Control to lower the brightness. If the brightness is lowered further these effects become even larger.
Some HDTVs have a dynamic iris that automatically adjusts the iris aperture after analyzing the picture content. The iris closes down for dark scenes, which improves the black-level where it matters the most, and opens back up again for bright scenes. However, a dynamic iris will introduce gray-scale artifacts (which are image errors) because virtually all dark scenes have some bright content that will be attenuated by the iris, so a manual iris is definitely preferred when an accurate gray-scale that is free of iris artifacts is desired. Also, some dynamic irises operate relatively slowly, taking half a second or more to make their adjustment, while others operate within a frame time. In most cases it’s possible to disable a dynamic iris and use a manual iris control only. In either case, the Black-Level and Contrast Ratio (either measured or listed in spec sheets) will be inflated by the iris aperture and should not be compared to the true Contrast Ratio for the display.
Display Contrast Display Contrast determines how well the optics and screen preserve the differences in brightness that occur within an image. Internal reflections can cause light from the bright areas of the image to bleed and contaminate the dark areas so they don’t get as dark as they should be. This reduces the contrast within any given image, but its actual impact depends on the structure of the particular image being shown. A standard way to measure Display Contrast is to use a black and white checkerboard test pattern and measure the luminance at the center of the white blocks and then the black blocks and finally compute their ratio. These values are always less than the Contrast Ratio values because its white and black levels are measured on separate screens, so there isn’t any bleed between them. Generally, the smaller the blocks the greater the bleed. We’ve done this for a 4×4 checkerboard, which is a standard pattern, and then for a much finer 9×9 checkerboard to see how much more the contrast falls when the blocks are reduced by an additional factor of 5 in area. Note that this measurement is tricky because a similar contamination effect (called Veiling Glare) also affects the instrument used in the measurements. We used heavy black felt masks to eliminate this common source of error in checkerboard contrast measurements. The results are listed in Table 3.
Table 3 : Checkerboard Contrast and Gamma
The values are all substantially less than the Contrast Ratio measurements listed in Table 1 due to internal reflections within the light engine optical components, the cabinet interior and the screen.
The interpretation of these results is not straightforward. In principle, there is no question that the higher the Checkerboard Contrast the better, but the JVC Professional unit got the lowest values by far yet it consistently received the highest picture quality scores in the Jury Panel evaluations (Part C). The same was true in Part I, where the CRT also had by far the lowest Checkerboard Contrast but the highest picture quality.
Clearly the laboratory Checkerboard Contrast data do not have a direct correspondence with the eye’s perceived picture quality. There are two reasons for this: (1) the optical system of the eye also suffers from similar optical aberrations because of the tissue based lens and the aqueous humor and vitreous humor that fill the interior of the eye, which further degrades the image on the retina, and (2) the eye is part of a visual processing system that is designed to extract as much useful visual information from an image as possible, and not an instrument for comparing quantitative luminance values in an image. So the eye and brain work to compensate for any image degradation on the retina in order to extract as much visual information as possible from an image. What you actually see in your mind is the brain processed image, not the raw data.
Both of these effects work to establish a threshold level interpretation for Checkerboard Contrast. Values less than the threshold are detected as a degraded image by the eye, and values above the threshold all effectively appear to be equivalent. So, there is no question that if the Checkerboard Contrast falls too low the eye will at some point take full notice of the effect – we just didn’t encounter it in any of the testing for this 7-part Shoot-Out series. These issues are further discussed under Display Contrast in Part I.
The only time that I could readily see that the JVC Professional unit had the lowest Checkerboard Contrast was during movie credits that had just a couple of lines of white text on an otherwise completely black screen. The area between the lines of text wasn’t as dark as in the other units, but you really needed to be looking for this effect to notice it. In a typical visually complex cinema image this effect would be even less noticeable. It’s important to note that this unit was a prototype. When the unit was returned to JVC, they confirmed the 4×4 Checkerboard measurement in Table 3. When they refurbished the unit and put in a brand new projection lamp the 4×4 Checkerboard Contrast increased to 113. It should climb even more in the final production units (the current estimate is about 140) because the cabinet interior will have a much blacker lining and it will have an improved screen.
Note that Contrast Ratio and Checkerboard Contrast are two entirely distinct display specifications. Each tells us something important and different about the display, and both are very useful. However, based on the above discussion Contrast Ratio is much more important than Checkerboard Contrast for homer theater applications. On the other hand, for computer images with fine graphics and text, the reverse is true (see Part I).
Gray-Scale Accuracy and Gamma We have been discussing the extremes of display brightness: the black-level and peak intensity. Here we’re going to carefully examine all of the intensities in between, which is referred to as the display’s Gray-Scale or its Gamma Curve (technically the Transfer Function). This is the signature of a display; it’s what gives the display its own unique look and performance characteristics. The functional form of the gray-scale has a major effect on the display’s color and gray-scale accuracy. A non-standard Transfer Function will introduce errors in brightness, contrast, hue and color saturation in an image (see Part II for a quantitative discussion). While every display technology has its own native gray-scale, signal processing electronics within the display is needed to produce a gray-scale that matches that of reference CRT monitor, which is an industry standard used in television and movie post-production. An HDTV that accurately follows this standard will produce an image that is identical to that seen in a studio by the creators of professionally produced content – generally the director and cinematographer or videographer.
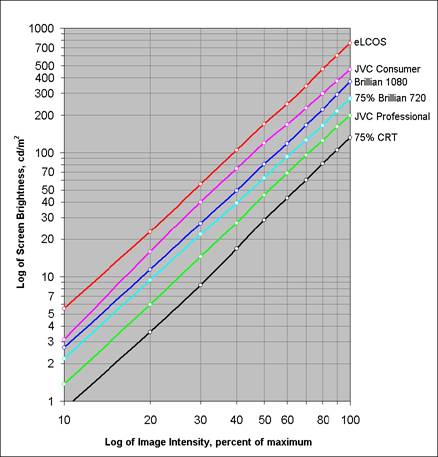
It turns out that the gray-scale is not linear as most people presume, but is instead logarithmic (mathematically it’s actually called a power-law, which behaves linearly on logarithmic scales) because that’s how standard CRTs behave, and also because that corresponds well with the eye’s own logarithmic response (which is also a power-law). If a display has the correct behavior then the gray-scale will appear as a straight line on a graph where both scales are logarithmic, which is referred to as a “log-log” plot. All of the display controls had to be adjusted very carefully for these measurements, especially the black-level. Figure 1 shows the Screen Brightness (luminance) in cd/m2 for each of the displays as a function of the signal intensity level expressed as a percentage of maximum. The value for 100 percent represents Reference White, digital signal intensity level 235. The measurements were made with the Konica Minolta CS-200 Spectroradiometer (because it’s very fast at low light levels) and a DisplayMate Window Test Pattern. The open symbols plotted on the graph are the measured data points. Note that the values for the Brillian 720 and the CRT were shifted downward by 25 percent for clarity.
FIGURE 1
Caption: Figure 1. The Gamma Curve or Transfer Function for each of the HDTVs. Note that the values for the Brillian 720 and the CRT were shifted downward by 25 percent for clarity.
From Figure 1 you can see that all of the LCoS HDTVs (as well as the reference CRT monitor) have a Gamma Curve (Transfer Function) very close to the ideal – a straight line on a log-log plot. This is a dramatic improvement over what we’ve seen in the recent past (compare with Figure 1 in Part II) and is another reason why these LCoS HDTVs are delivering excellent picture quality. (See Part II for an in-depth discussion of Gamma.) The slope of the Transfer Function in the log-log plot is known as the Gamma of the display. If the line is not perfectly straight then the Gamma varies with intensity, which is undesirable. The industry standard, which is based on CRT technology, is a value of 2.20. Table 3 lists the Gamma values measured for each of the units from a fit to the data in the most important region of 100 to 30 percent signal intensity. They are all very close to the 2.20 standard, except the JVC Consumer unit, which is a bit too low, although its curve steepens somewhat at the dark end.
Color Accuracy The color coordinates of the red, green and blue primary colors in each display defines the gamut of colors that it can reproduce. All of the colors that the display produces are combinations of the primary colors that it uses. In principle, the wider the color gamut the better, and many manufacturers are now prominently advertising their extended color gamuts. However, variations in the primaries change all of the displayed colors in an image. So, in practice, it’s much more important to use standard primaries in order to maintain the color accuracy of the reproduced images. Wider color gamuts decrease color accuracy and should be avoided except in specialized imaging applications – for example in medical or military applications. If you do get an HDTV with an extended color gamut it will be necessary to reduce the color gamut back to the standard values by using the color Saturation Control or other color management functions within the unit, so it’s a pretty useless feature in HDTVs. In fact, it’s undesirable, and is just being used as a marketing gimmick. Look for an HDTV that advertises the Rec.709 and Rec. 601 standard primary colors and avoid, or be very suspicious of any HDTV that brags about its extended color gamut, particularly a comparison to the original large NTSC color space, which is now non-standard, obsolete, and will likely lead to on-screen color errors.
You will occasionally hear that extended color gamuts are useful for high ambient lighting conditions, which wash out the on-screen colors (in addition to the gray-scale). That won’t help because it would require a special correction that depends on brightness (darker colors require a much greater correction than brighter colors). On the other hand, some source material may have insufficient color saturation, so it might occasionally be desirable to turn up the color saturation. If that’s the case then it’s very important that the primary color triangle for the extended color gamut be an exact proportional enlargement of the standard gamut color triangle (see below).
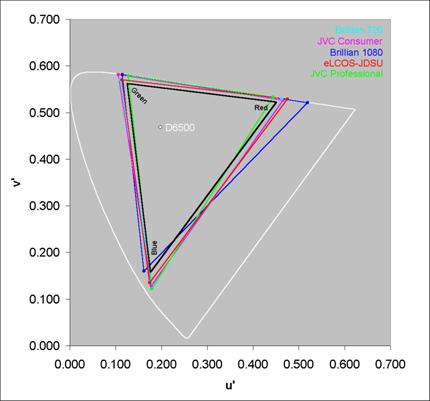
For High Definition content the standard colors are specified in the ITU-R BT.709 standard (Rec.709). We measured the primary colors with the Konica Minolta Spectroradiometers and have plotted them on a 1976 CIE Uniform Chromaticity Scale diagram with u’,v’ coordinates in Figure 2, together with the Rec.709 primary colors, which are marked by the black triangle. (See Part II for an in-depth discussion of this topic.)
FIGURE 2
Caption: Figure 2. The 1976 CIE Uniform Chromaticity Diagram for the High Definition Primaries for the HDTVs together with the Rec.709 standard (in black). Note that the color management for the Brillian 1080 unit (blue lines) had not yet been completed.
From Figure 2 you can see that almost all of the primaries are just a bit more saturated than the Rec.709 standard, which is fine because a small adjustment of the color Saturation Control will bring them into good agreement with the standard. This is also a dramatic improvement over what we’ve seen in the recent past (compare with Figures 4 and 5 in Part II) and is yet another reason why these LCoS HDTVs are delivering excellent picture quality. The red primary for the Brillian 1080 unit was much too red. This was quite evident during the visual testing (Part C) and we partially compensated for it by turning down the color Saturation Control. It’s important to note that this was a prototype and Brillian had not yet completed its optical color management design for the unit. This is straightforward and the production 1080 units should perform just as well as the Brillian 720. The red primary for the JVC Professional unit was a trifle too weak, which was due to the unit's older projection lamp. A new lamp or an optional filter will move the red primary a bit further out beyond Rec.709.
The primaries in Figure 2 are only for High Definition signals and sources. When an HDTV is displaying a DVD or other Standard Definition content, a different set of primaries are needed. They are based on a different standard, and were not measured for the Shoot-Out. When displaying Standard Definition content, the HDTV needs to automatically switch its primary colors through a color management process that electronically remixes the red, green and blue primary color signals (see Part II).
What’s Coming Next In Part C we'll continue with a revealing Test Pattern analysis, followed by a description of the extensive Jury Panel testing and then provide individual Assessments for each of the units, including Jury evaluations and comments. Part D will have an overall Assessment of LCoS technology, followed by detailed technical performance comparisons between all of the major display technologies: CRT, LCD, Plasma, DLP, and LCoS, and we’ll finish with a discussion of the most exciting new developments in display technology that will be the subject of future articles in this series.
Article Links Part A: Introduction to LCoS Technology Part B: LCoS Color and Gray-Scale Accuracy Part C: Test Pattern and Jury Panel Evaluations Part D: Comparison with CRT, LCD, Plasma and DLP
Sidebar: LCoS HDTV Manufacturers Sidebar: Shoot-Out Hardware and Software
Acknowledgements Over 75 people were involved with the Shoot-Out: about half were participating manufacturers and the other half were Panelists (see Part C) that came to evaluate the HDTVs.
Special Thanks: A number of people made important contributions that warrant a special mention: special thanks to Dr. Edward F. Kelley of the NIST (National Institute of Standards and Technology) for many interesting discussions and for generously sharing his expertise. Special thanks to Dave Migliori for his excellent photography of the Shoot-Out with its difficult lighting layout and viewing angles. Special thanks to Stacey Spears for selecting and assembling the Windows Media Video program material. Special thanks to Julia Soneira and Lauren Soneira for helping to produce the Shoot-Out, which turned out to be a much larger operation than I had anticipated. And finally, very special thanks to Hope Frank (Brillian), David McDonald (eLCOS), Terry Shea (JVC Consumer) and Rod Sterling (JVC Professional) for the tremendous amount of work that they put in coordinating their company’s efforts, which was crucial for making the Shoot-Out a success.
HDTV Manufacturers: Brillian Corporation: Hope Frank (Vice-President), Chad Goudie, Douglas Gorny, Gil Hazenschprung, Dr. Robert Melcher (Chief Technology Officer), Dr. Matthias Pfeiffer, Jack Waterman. eLCOS Microdisplay Technology: Dr. David J. Cowl, Roland Lue, David McDonald. JDS Uniphase: Michael Newell, Dr. Andrew Taylor. JVC (Consumer Division): Dan McCarron, Terry Shea, Fumi Usuki. JVC Professional Products: Dr. William Bleha, Ken Bylsma, Jack Faiman (Vice-President), Gary Klasmeier, Rod Sterling. SpatiaLight Technologies: Ted Banzhaf (President), Dr. David Hakala (Chief Operating Officer).
Equipment Manufacturers: Anchor Bay Technologies: Gary Chappell, Adam Damico. Gefen: Hagai Gefen (President), Linda Morgan, Khasha Roholahi. CinemaQuest: Alan Brown (President). Konica Minolta Instrument Systems Division: Tom Kwon and Maria Repici. Microsoft Windows Digital Media Division: Amir Majidimehr (Vice President), Stacey Spears, Kevin Unangst. Silicon Optix: Gary Chin, Ney Christensen, Dennis Crespo, Darren Gnanapragasam, Justin Lam, Gopal Ramachandran, Derek Yuen.
About the AuthorDr. Raymond Soneira is President of DisplayMate Technologies Corporation of Amherst, New Hampshire, which produces video calibration, evaluation, and diagnostic products for consumers, technicians, and manufacturers. See www.displaymate.com. He is a research scientist with a career that spans physics, computer science, and television system design. Dr. Soneira obtained his Ph.D. in Theoretical Physics from Princeton University, spent 5 years as a Long-Term Member of the world famous Institute for Advanced Study in Princeton, another 5 years as a Principal Investigator in the Computer Systems Research Laboratory at AT&T Bell Laboratories, and has also designed, tested, and installed color television broadcast equipment for the CBS Television Network Engineering and Development Department. He has authored over 35 research articles in scientific journals in physics and computer science, including Scientific American. If you have any comments or questions about the article, you can contact him at dtso@displaymate.com.
Copyright © 1990-2006 by DisplayMate
Technologies Corporation. All Rights Reserved.
| ||||||||||||||||||||||||||||||||||||||||||||||||||||||||||||||||||||||||||||||||||||||||||||||||||||||||||||||||||||||||||||||||||||