Display
Technology Shoot-Out
Comparing CRT, LCD, Plasma and DLP
Displays
Dr. Raymond M. Soneira
President, DisplayMate Technologies
Corp.
Copyright © 1990-2005 by DisplayMate
Technologies Corporation. All Rights Reserved.
This article, or any
part thereof, may not be copied, reproduced, mirrored, distributed or
incorporated
into any other work without the prior written permission of DisplayMate
Technologies Corporation
Part III – Display Artifacts and
Image Quality
Article Links: Overview Part I Part II Part III Part IV
Printing: If your browser is
improperly printing some pages with text cutoff
on the right edge then either print
in Landscape mode or reduce the font
size (View Menu - Text Size) and
margins (File Menu - Page Setup).
Introduction
This is Part III of a four part article series describing
an in-depth comparison between CRT, LCD, Plasma and DLP display technologies in
order to analyze the relative strengths and weaknesses of each. In Part I we measured,
analyzed and compared primary specs like Black-Level, Color Temperature, Peak
Brightness, Dynamic Range, and Display Contrast for each display technology. Click this link to read
Part I. In Part II
we continued with Gray-Scale, Gamma, Primary Chromaticities and Color Gamut to
see how they all affect color and gray-scale accuracy. Click this link to read
Part II. Here in Part III we continue with the complex world of display
artifacts and how they affect image quality.
Artifacts
In Parts I and II we measured the photometry and
colorimetry for each of the displays. If all of the pixels in a display
performed in exactly this manner, there wouldn’t be anything more to discuss
because images are just made up of pixels. The whole would just be the exact
sum of its parts. Unfortunately, things aren’t quite that simple because a
considerable amount of processing is required between the image or signal
source and the actual display device. All of this processing affects and
modifies what each pixel winds up displaying, often adversely affecting image
quality and accuracy and frequently introducing artifacts into the image. An
artifact is simply any distinct feature that is visible in an image that
doesn’t belong there. How the different display technologies respond to these
issues will be the subject of Part III. While artifacts frequently arise when
an image or signal is encoded or compressed for storage or transmission we will
be focusing primarily on artifacts that result from the displays themselves.
Compression artifacts are a vast subject in their own right that we will be
touching upon only lightly.
First we’ll consider the question of Analog versus Digital
for intensities, pixels and signals. Then we’ll examine Signal Quality and
Accuracy, followed by discussions on Native Resolution and Image Rescaling,
Image Noise, Motion Artifacts and Signal Processing. The discussion in Part III
will deal primarily with broad issues that affect all of the display
technologies together. The discussion for many specialized artifacts that apply
to only one particular display technology will be considered under the detailed
individual technology assessments in Part IV.
Analog versus Digital
Three
fundamental issues for any display are the way in which it generates pixels,
produces intensities and processes input signals. Each one of these can exist
in either the analog or digital domains. The terms analog and digital encompass
a wide variety of contexts. Generally analog refers to anything that can take
on any continuously variable value, while digital refers to anything that can
only take on a discrete set of enumerated values. Analog is smooth but
imprecise and digital has jumps but is perfectly precise. Within each section
we will further explain and define these meanings. While most people assume
that digital is somehow automatically better, that really isn’t the case. Each
method has its own particular advantages and disadvantages, either one can
produce excellent image and picture quality, and either one can be superior to
the other. It’s the details of the implementation that determines the quality
of the end result and the artifacts that are produced. We’ll explore these
issues next.
Analog
versus Digital Intensity
The
intensity (brightness or luminance) of a display pixel can be controlled by
either an analog or digital process. Each display technology must do it in a
particular way. While any display can accept both analog and digital signals,
they must be converted into the proper native mode by the time they get to the
actual display device.
Both CRTs and LCDs produce their intensity scale through
analog voltage control of the device. The range of brightness that is produced
is both perfectly smooth and infinitesimally graduated. Some signal processing may
be necessary in order obtain the desired Gamma or gray-scale, as discussed in
Part II. If it’s all done via analog circuitry then the display retains its
pure analog nature, which means that it’s free of intensity artifacts (see
below) but is susceptible to degradation in signal and image quality.
On the other hand, both Plasma and DLP displays have only
digital on and off pixel states so they must produce their intensity-scale
digitally by rapidly switching between the two states and varying the percentage
of time that is spent in each state. If the switching frequency is high enough
then the eye responds to the time-averaged brightness of the pixel. For
example, for 25% brightness, a quarter of the time is spent on and the other
three-quarters is spent off. In principle, it’s possible to produce an
infinitesimally graduated intensity scale just like the analog devices above.
In practice the switching frequency is fixed and the states are digitally
controlled so only a discrete set of intensity levels can be produced. As a
result the intensity scale is no longer smooth but rather increases as a series
of steps. The resulting jumps in intensity produce what is known as a quantization
error because all intensities are forced up or down to the nearest available
digital value. If the steps are very fine then the eye will not notice the lack
of intermediate values and smoothness. If they’re not then artificial intensity
and color contours (which are artifacts) may be visible in the image,
particularly at lower intensities (see below). Since most signals are now
digitally generated (including almost all analog signals) there is already a
quantization error built-in to most images. We’ll discuss this further below.
At low intensities the on-time is so brief that it may be visually perceived as
image noise. (See Image Noise and Temporal Dithering, below). In most consumer
devices the goal is to produce 256 intensity levels (8-bits per primary color
or 24-bits total). Signal processing generally reduces the total number of
levels that are actually available, so in reality less than 256 levels are
provided. This introduces additional gray-scale artifacts that we’ll discuss
further under Signal Processing, below.
Analog
versus Digital Pixels
The pixel structure of the display can also be either
analog or digital. This is determined by either the inherent nature of the
display technology or the implementation chosen by the manufacturer.
DLP
and Plasma displays have an intrinsic discrete pixel matrix format that is fixed
at the time of manufacture and cannot be changed. Each DLP pixel is made up of
a micro-mirror and each Plasma pixel is made up of 3 gas cells that contain
red, green and blue phosphors. This discrete image structure is referred to as digital
pixels (or discrete or fixed pixels). Each digital pixel has a unique digital address on the
display. There are many competing advantages and
disadvantages to this approach. Digital pixels are generally organized in a
regular matrix of horizontal rows and vertical columns. As a result the screen
is tiled in a repeating structure of squares or rectangles that have a uniform
internal brightness. This structure can become quite noticeable in some images.
This effect is called Pixelation. Gaps between the pixels make pixelation
more apparent. This is called the Screen Door Effect because of the
similarity to looking through the mesh screen on a storm door. The gaps are
noticeable in Plasma and LCD technologies but almost invisible for DLP (and
LCoS). The higher the display resolution the less apparent pixelation becomes.
At 1920x1080 it’s generally invisible at typical viewing distances, but it can
be a factor at lower resolutions, such as 1280x720.
If you have a digital image that has a resolution
identical to the display’s then it can be reproduced exactly and appear
perfectly sharp. If the image has a different resolution then it must be
digitally rescaled to match the pixel structure of the display, which
introduces errors and artifacts into the image (see Image Rescaling, below). If
the image is analog and not digital then it must be digitized for digital
displays, which introduces a different set of errors and artifacts. (See
Digitizing Analog Signals, below.)
CRTs
as pure analog devices don’t have any preordained pixel structure built in so
they are free to support a very wide range of image formats. The phosphor dots
or stripes in direct-view color CRT monitors do introduce a grain into the
image and can produce wispy moiré interference patterns (similar in appearance
to what you see when looking through two layers of semi-transparent thin
fabric, which is discussed further in Part IV) but they don’t impart any
particular pixel structure. CRT projectors use CRTs with smooth phosphor
coatings so they don’t produce any moiré artifacts. Technically CRTs are
pixel-free, but this lack of structure is still referred to as analog pixels
(or continuous pixels) because they can be thought of as formed and stretched
in whatever way is necessary. For example, if you have a CRT monitor connected
to your computer then you can select from a wide variety of resolutions that
will be accurately reproduced without any pixel or rescaling artifacts.
The
above is not the entire story because virtually all CRTs are operated in a mode
where images are made up of a specified number of continuous horizontal lines,
which is called a raster. The raster is actually a property of the image
structure rather than of the CRT itself, which in principle will accept
whatever line structure is delivered to it. So images on a CRT are actually
analog horizontally but digital vertically because of the image line structure.
When the CRT’s beam size is properly adjusted the raster is virtually
invisible, but that doesn’t always happen, especially with CRTs that support
multiple resolutions.
LCDs
are also analog devices and don’t have any intrinsic digital pixel structure
(because they are filled with a uniform liquid crystal layer), but they are
generally manufactured with a pixel matrix structure just like the DLP and
Plasma technologies. So all of the flat panel technologies behave identically
in this regard. However, LCDs are a hybrid technology because they have digital
pixels but require an analog signal internally for the panel. The digital
structure takes precedence and signal processing for LCDs is generally digital.
Analog
versus Digital Signals
The
signal is the manner in which an image is delivered to a display and also the
object of all of the processing that takes place. Most displays now accept both
analog and digital signals. In principle, displays with digital pixels prefer
digital signals and displays with analog pixels prefer analog signals. Note
that the signals are doubly digital or analog: a digital signal has digital
pixels with digital intensities and an analog signal has analog pixels with
analog intensities. Converting between the two signal types always involves
some image degradation and artifacts. An analog signal is transmitted as a
voltage, typically ranging between 0 and 0.7 volts while a digital signal is
transmitted as a number, generally ranging between 0 and 255.
Analog
Signals
An
analog signal has the advantage of not possessing any built-in structure, which
makes it artifact free. It can contain a lot more subtle image information than
a digital signal, which is constrained to a discrete pixel structure and a
discrete set of allowed intensity levels. On the other hand, analog signals by
their very nature are easily susceptible to degradation and interference. Just
as with audio systems, there are significant differences in performance between
components and even subtle differences can have visual consequences. High
quality analog signal processing is now more difficult and expensive to
implement than digital signal processing (even though the analog electronics
are much simpler, i.e., less complex, than the digital electronics),
which is why we’ll continue to see more and more of the latter.
Analog
signals typically come in the form of RGB (separate red, green and blue primary
color channels) for computers (via DB15 VGA or BNC connectors) and component YPBPR (separate luminance and
encoded blue and red channels) for video (via BNC or RCA connectors). Since
analog signals are easily degraded it’s important to use high quality signal
sources (graphics boards for computers, and cameras, DVDs, VCRs, and Set Top
Boxes for video). Often the biggest differentiator in performance is the
quality of the analog electronics within the display itself because of the
considerable amount of processing electronics that is required there. We’ll
discuss this under Signal Quality, below. High quality cables are also
important, particularly for runs longer than a few meters. Long runs of more
than 25 meters typically require repeaters with equalization and signal
processing in order to compensate for the transmission losses, but distances of
100 meters or more are possible with little overall signal degradation.
Digital
Signals
A
digital signal has the advantage of absolute precision when it is generated,
transmitted or processed. Still there are limitations and artifacts that result
from its discrete nature. We have already discussed some of these and will
examine other aspects in the sections below. None-the-less there are many
advantages to using digital signals. If both the signal source and display work
with digital signals then most of the time it’s better to use a digital rather
than an analog connection. There are two reasons for instead picking analog
over digital: (1) digital often produces stronger and more visible artifacts,
and (2) analog often provides a larger set of controls for adjusting the image.
Both of these issues are discussed in detail in the sections below.
Digital
signals come in the form of DVI (Digital Visual Interface) for computers and
DVI with HDCP (High Definition Copy Protection) for video. (There are a number
of other digital signal formats in use, such as Firewire, which is also known
as IEEE 1394, and SDI and HD-SDI, which are production serial and high
definition serial digital interfaces, but they aren't yet found on many
displays or projectors.) DVI has red, green and blue channels with 8-bits of
intensity information per channel. Note that there is a crucial difference in
the signal levels between the different types: computer signals cover the
complete 8-bit 0 to 255 range, with 0 for black and 255 for peak intensity,
while 8-bit video signals operate over a somewhat smaller range, with 16 for
black and 235 for peak white, with the remaining levels reserved to accommodate
signals that overshoot this nominal range, and also for synchronization. For
accurate image reproduction it’s important that the display provide (automatic
or manual) adjustments to accommodate these range differences. (We strongly
recommend a manual Black-Level Control, see Parts I and II.) Another issue with
DVI signals is that the transmission distance is typically limited to
relatively short distances of a few meters (up to 5 meters in some cases), but
the distance depends on the resolution and the quality of the signal
transmitters, receivers and cable. Beyond that some form of repeater is
required. After the maximum recommended distance the image will start to
degrade, first in the form of intermittent digital noise artifacts appearing in
the image and then by a total loss of signal. Much greater distances are
possible: Silicon Image, one of the principal developers of DVI, has
demonstrated DVI transmissions of 20 meters at high UXGA 1600x1200 resolutions
using chipsets that are specially designed for long cable runs. Even longer
runs of 100 meters or more are possible using fiber-optic DVI cables.
HDMI
(High Definition Multimedia Interface) is the next generation of digital
interconnect that is beginning to appear in the marketplace. It is backwards
compatible with DVI. From our perspective here it has two major advantages:
support for up to 12-bits of intensity (4096 levels) and typical transmission
distances of up to 15 meters. (These can be extended with the same methods used
with DVI.) This will help to significantly reduce many of the digital artifacts
that we discuss here. Other advantages for HDMI include a smaller connector and
the inclusion of audio and control signals together with the video signal, so
only a single cable is necessary.
One issue that occasionally affects DVI (but not HDMI) is
the use of components that are not fully compliant with the official DVI
specification. This problem arises because official compliance testing is not
required for DVI components (but it is for HDMI). When there is a compliance
problem some DVI signal sources (like computer graphics boards or DVD players)
may not work properly with some DVI receivers like displays. This generally
leads to image artifacts like on-screen noise. The problem is more likely to
appear at higher resolutions and longer transmission distances. Historically
only a small number of combinations have resulted in a problem and it’s less
common now.
Signal Quality and Accuracy
Both analog
and digital signals are subject to various types of errors and so they are both
unable to deliver perfect image quality and accuracy for different reasons.
Video and photographic images always begin in the analog world and almost
always need to be converted into digital signals for transmission or storage.
Computer generated images that are displayed on DLP or Plasma displays with
digital connections are the only images that can remain purely digital
end-to-end. Most computer and video hardware are still connected via analog
signals so a reverse digital to analog conversion is generally necessary. Most
displays are still CRT or LCD based and therefore actually require an analog
signal internally at the display device. Also, these displays often include
some form of internal digital signal processing, so almost all images spend
time in both the analog and digital domains and need to be converted between
them at least once, and often more than once. We’ll examine these issues here
and in the Signal Processing section below.
Digital
Granularity
While
digital signals and intensities are absolutely precise they always introduce
some brightness artifacts for each pixel in an image. This is due to the
quantization error that results from restricting the intensity and brightness
values to a set of digital levels, instead of allowing any value in-between the
minimum and maximum, as in the case of analog signals. The intensity steps apply
individually to each of the red, green and blue primary color channels, so they
also introduce quantization errors into hue and saturation for all resulting
color mixtures. The greater the number of digital
levels the smaller the error. If the steps are very fine then the eye
will not notice the jumps and lack of smoothness. If they’re not then the Granularity
of the digital steps will introduce false visual intensity and color contours
into an image. They’re most noticeable when there are fine graduations in
either intensity or color within an image.
The
real question is how fine do the steps need to be in order for these granularity
effects not to be visible? As we discussed in Part II, the eye responds to
brightness ratios. (Technically the correct term to use here is luminance
ratios, but we will be
informally referring to luminance as brightness and will use the two terms interchangeably
throughout the article.) When comparing two values it
is their brightness ratio that determines what your eye sees. So how small a
variation in the brightness ratio can the eye detect? It turns out to be
roughly 1 percent over a wide range of brightness. So if the change in
brightness between two digital intensity steps is more than about 1 percent,
then the brightness granularity can be detected by the eye. The number of
intensity steps that are available is determined by the number of bits used to
specify the intensity levels. For example, 8-bits allows 256 levels, which is
what is used in most computer and video signals. A greater number of bits will
provide a finer intensity scale, which is sometimes used for internal signal
processing within a display (see Signal Processing, below). HDMI will
eventually allow up to 12-bit signals, which has 4096 levels, but for now most
computer and video content is restricted to 8-bits and 256 levels.
The
next question is how to distribute the brightness levels among the allowed
digital values. The best (and most efficient) way would be to separate them all
by a specified ratio, like the one percent increment mentioned above. Each step
would then be 1.01 times the brightness of the previous step. Each step would
also be a bit wider than the previous step, so the spacing between the steps
would vary and be non-linear. (The brightness for step n would be proportional
to 1.01n. Black, which has zero brightness, is handled as a
special level.) This is the most efficient method for specifying the
intensities accurately, but it’s not the method that’s used because a linear
spacing is more convenient and makes signal processing a lot easier. So, in
reality, the intensity steps are all separated by equal differences rather than
equal ratios. That means that the brightness ratio between adjacent steps will
then increase as the brightness decreases, so the granularity artifacts will
show up first at the dim-end of the intensity scale. We’ll analyze this
quantitatively next.
In
Figure 1 we’ve plotted the percentage change in brightness per digital step
from an 8-bit intensity scale (with 256 steps) up through a 14-bit scale (with
16,384 steps). They’re all plotted as a percentage of maximum brightness on the
horizontal scale. We’ll discuss the meaning of the 7-bit graph below. (The
plotted values depend on the value of Gamma, so we’ve used the standard value
of 2.20, see Part II.) We’ve again used a logarithmic graph because it’s better
for presenting the results. You don’t need any advanced math to understand logarithmic graphs, just
pay attention to the scale values. The horizontal axis goes from 0.1 percent to
100 percent of the maximum screen brightness -- that’s a dynamic range of
1000:1 in brightness. The vertical scale goes from 0.01 percent to 100 percent.
Note that a 1 percent increase, which is the detection threshold, is exactly in
the middle of the vertical scale. Values below this value cannot be detected by
the eye and values greater than this value can be detected, and therefore may
produce false intensity and color contours in an image.
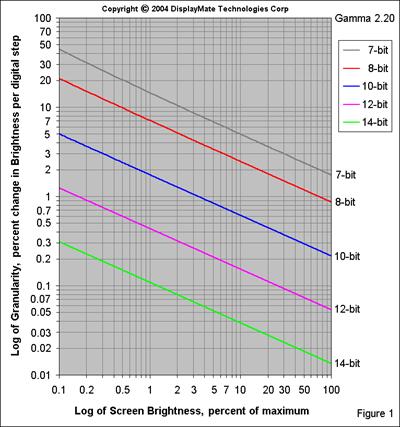
8-bit
Granularity
From
the graph you can see that almost the entire 8-bit intensity scale is above the
one percent detection threshold. Also, the granularity dramatically increases
by more than a factor of 20 over the brightness range shown in the graph. At 10
percent of maximum brightness the change in brightness between adjacent steps
is 2.5 percent and at 1 percent of maximum brightness the change is 7 percent
between adjacent steps. There is plenty of image content that extends down to 1
percent of maximum brightness (level 32), so the granularity and contouring
will definitely be visible in an 8-bit intensity scale.
The
graph extends down to 0.1 percent of maximum brightness, which represents a
dynamic range of 1000:1. CRTs have a dynamic range that’s more than a factor of
10 greater than that and the best flat panels are now approaching 3000:1 and
are steadily improving. At 0.01 percent of maximum brightness (not shown in the
graph but corresponding to a dynamic range of 10,000:1) only the 14-bit scale
is below the one percent threshold. However, at very low light levels the
detection threshold for the eye will increase. So, in order to take full
advantage of the larger dynamic ranges for the current generation of displays
it will be necessary to extend the intensity scale by at least two more bits
over the current 8-bits. Hardware that’s capable of handling 10 and 12-bit
signals is starting to make an appearance and will significantly reduce
granularity effects in the long-term, however, for now almost all image content
is based on 8-bits.
Granularity
Tests
A
detection threshold is probably much too stringent a condition, so we should
instead be looking for something more along the lines of a noticeable
threshold, which is around a few percent, but will depend on the particulars of
the image content and the ambient lighting conditions. For example, contouring
will be much more noticeable in a dark image when viewed in a very dark room.
With any version of DisplayMate for
Windows (www.displaymate.com) you can determine the threshold values for
yourself using the “Color Explore and Match” test pattern screen, which has 3
side-by-side panels that can be set to any 8-bit intensity or color value.
First set the slider for the middle panel to the intensity or color value that
you want to study. Then adjust the sliders for the other two panels to values
just above and below the central panel where you start to detect an intensity
or color difference. That will be your eye’s threshold for that intensity or
color. The DisplayMate Multimedia Edition has additional test patterns to help
determine gray-scale sensitivity. To perform these tests you’ll need to use an
analog CRT display because all of the other technologies generate their
intensities digitally, which will interfere with the experiment. (The CRT uses
an analog signal generated from the 8-bit digital signal. The conversion is
generally very accurate and should not interfere with the evaluation.) Turn
down the room brightness as low as possible, or at least down to the same value
as your home cinema and make sure that your computer is set to 24-bit color
(sometimes it’s identified as 32-bit color), which uses 8-bit intensities.
Granularity
Due to Signal Processing
The
granularity effect is actually larger than the above discussion because with an
8-bit digital input signal it’s unlikely that a digital display will be able to
produce a true 8-bit intensity scale. The reason is that any digital processing
will cause some reordering of the perfectly ordered set of 256 intensity
levels. A shift of just 1 intensity level will degrade the signal to 7-bit
granularity (see Figure 1), a shift of 3 levels will degrade the signal to
6-bits, and a shift of 2 levels falls in-between 6 and 7-bits. One way to
reduce this effect is for the display to process the 8-bit signal internally
with more than 256 levels; 10-bits with 1024 levels is used in many displays.
It’s a form of digital interpolation. The processing irregularities (artifacts)
are then smaller. If the display device can actually produce 1024 intensity
levels then it will deliver overall performance relatively close to 8-bits. If
the display device is limited to 8-bits (which is often the case), then the
overall performance will be closer to 7-bits. If straight 8-bit signal
processing is used throughout then the overall performance will typically be
closer to 6-bits. We’ll discuss this further under Signal Processing, below.
16-bit
PC Video Modes
Many
personal computers are operated in a 16-bit color mode where the red and blue
channels each have 5-bits or 32 levels of intensity and the green channel has
6-bits or 64 levels of intensity. (Note that they add up to 16 bits.) The
granularity is so large that it doesn’t noticeably degrade in displays that are
designed for 8-bit intensity levels, so you get true 5 and 6 bit performance,
which is not too far away from the effective 6 to 7-bit performance discussed
above. The green channel is given an extra bit (or twice as many intensity
levels) because it contributes roughly two-thirds of the eye’s photopic
response (Part II). Unfortunately, that introduces a significant green caste
(an artifact) into all 16-bit images because the finer intensity scale allows
green to increase half a step sooner than either red or blue. DisplayMate for
Windows has a 6-bit 64-level test pattern to demonstrate this effect. So if
color and gray-scale accuracy is important make sure that your system is
operating in a 24-bit color mode (eight bits per primary color). (Note that
many computer systems now list a 32-bit color mode, which is actually just a
24-bit mode with a dummy 8-bit pad that significantly increases speed
performance because each pixel then takes exactly four-bytes of memory. It’s a
speed for memory tradeoff. If you have a choice, always pick 32-bits over
24-bits unless you don’t have enough video memory to support it.)
Analog
Signal Quality
A
video analog signal behaves exactly like an audio analog signal. Its primary
strength, which is its ability to carry very minute and subtle details, is also
its primary weakness because it is susceptible to very minute and subtle
variations and degradations in performance that can easily affect visual
on-screen image quality. While there are an almost endless set of possibilities
as to how an analog signal can degrade the most common problem is a loss of
sharpness and fine image detail due to shortcomings in high-frequency response,
which is called Video Bandwidth. It can originate with the signal source
like a DVD player or a
computer graphics board or in the display’s own signal processing electronics. The higher the screen resolution the greater the video bandwidth
that’s needed. If there is insufficient bandwidth then fine image detail will
appear dim and blurry. It takes very high quality engineering and
components in order to be able to deliver excellent analog high-frequency
response and there are substantial variations in performance between different
units.
DisplayMate for Windows
Multimedia Edition includes a proprietary DisplayMate test pattern that
accurately and numerically measures video bandwidth on-screen using only your
eyes (no instrumentation is needed). It works by adjusting an on-screen slider
so that a checkerboard pattern of high and low-frequency components appear
equal in brightness. The measurement is on a scale of 0 to 100, with 100 as
perfect. Scores greater than 100 are also possible, but this is a tell-tale
sign of over-peaking, where the high-frequency response is set too high in
order to artificially enhance sharpness in poor quality hardware.
Another issue with analog electronics is that the red,
green and blue primary color channels need to all have identical performance in
every respect. In particular, if the video bandwidth for the RGB channels are
not identical then high-frequency fine image detail will be produced with an
unbalanced set of RGB primaries, which will introduce color errors, including a
different white-point chromaticity (Part II) for fine detail. DisplayMate for
Windows Multimedia Edition includes a very sensitive test for this effect.
Transient Response is another performance criterion that's related
to video bandwidth. It describes how quickly and accurately the analog signal
changes when going from one pixel to the following pixel, and therefore has a
major impact on image sharpness. In principle the signal amplitude needs to
change quickly (the rise-time or fall-time) and also change smoothly and
accurately between the signal levels for adjacent pixels. It's quite a
challenge to make this happen, especially at high resolutions, and a fair
amount of circuit tweaking is often necessary. Peaking circuits are used to
improve the rise-time and frequency-response while filtering circuits are used
to reduce undesirable signal irregularities. Each one also produces undesirable
side effects: peaking produces signal overshoots that add over-bright or
over-dark Edge Artifacts to fine image detail and also Ringing
Artifacts that add one or more oscillations in brightness that follow fine
image detail. Filtering does the opposite and dampens and slows down signal
transitions. Both elements are needed and they work together in an opposing
compromise.
Another
important issue is that the amplifier gains and the Gammas for each primary
color channel must be identical. If not, then the gray-scale will exhibit
variations in color with intensity. This and many other signal quality aspects
can be examined with the extensive suite of test patterns provided within all
DisplayMate products.
Digitizing
Analog Signals
When
an analog signal is fed to a display with digital pixels, it needs to be
digitized. Since almost all analog signals are actually generated from digital
sources (computer or MPEG) it’s necessary for the display to accurately
identify the underlying digital pixels within the analog signal and then
accurately measure the signal level at the center of each one. Otherwise the
transition region that exists between pixels will be digitized, which is highly
variable and will appear as on-screen noise. First of all, it’s very difficult
to accurately locate the beginning and end of each pixel because they generally
don’t have well-defined edges. If it’s not done with 100% accuracy there will
be visible on-screen interference in the form of moiré interference patterns
and digital noise, which arise because the image pixels are not all being
properly identified and mapped to the appropriate display pixels. As a result
the digital image actually becomes a bit fuzzy (much like an analog CRT). It’s
rather difficult to perform an accurate conversion because the start and end of
each signal pixel is difficult to identify and there are often problems with
signal quality, such as rise-time, overshoot and ringing, which makes it
difficult to accurately measure the true intensity of each pixel. Digital clock
jitter and drift over time make this problem even harder. Other factors include
the accuracy of the signal level measurement hardware and the number of digital
levels that are generated, which is called the bit-depth, and is
normally between 8 and 10 bits, but it can effectively be 7-bits or less if the
measurement errors are large.
Most
computer displays have an automatic “Auto” function (button or menu selection)
that attempts to do this pixel identification automatically. For most displays
“Auto” generally does a pretty good job but seldom gets it exactly right, so
most flat panel monitors and projectors with analog connections actually
operate with a bit of fuzziness and noise, a fact that will probably shock most
flat panel users. (Rescaling further magnifies these artifacts.) A manual
adjustment of a pixel “Tracking” or “Phase” Control is necessary in order to
get it exactly right and produce a perfectly sharp image. (Some displays are
simply unable to get a perfect pixel lock.) All DisplayMate for Windows products include
special proprietary “Pixel Tracking and Phase” test patterns that are used to
accurately adjust and test the setting. There is an Auto pattern that will help
the Auto function get as accurate a setting as possible and a more sensitive
Manual pattern to help you adjust it as perfectly as possible. Video displays
generally don’t provide any manual adjustments for pixel tracking or phase and
rely exclusively on internal circuitry. That often leads to the artifacts discussed
above but they’re not as objectionable or easy to see because video images are
photographic in nature and are therefore relatively smooth to begin with.
Converting
Digital Signals to Analog
There are very few remaining sources that produce true
native analog video signals so most analog video signals are actually generated
from digital sources. One analog example is vidicon cameras, which produce a
native analog signal but are now used only in specialized applications. (Most
cameras are now digital CCD or CMOS based.) VCRs and older camcorders record
analog signals but they generally use digital signal processing internally, so
they are actually just another example of digital hybrids. It’s much easier to
convert digital signals into analog than the opposite case discussed above.
Very high quality analog signals can be produced by standard chipsets, but cost
considerations may result in the use of lower performance components with
reduced signal quality and the same video bandwidth, overshoot and ringing effects
that were noted above.
Encoded
and Compressed Signals
Both
analog and digital signals are often encoded or compressed in order to reduce
the requirements for transmitting or storing the images. Computer RGB analog
signals are one of the few that don’t use any encoding or compression. DVI and
HDMI are encoded for transmission but the digital signals are reconstituted
exactly by the receiver. None of these signals generate any artifacts
themselves, although they will transmit artifacts contained within the source
material. NTSC and PAL video are examples of analog encoding and compression
while MPEG and the new Windows Media Video are examples of digital compression.
The compression is lossy so some image content is lost, which results in
compression artifacts. The various compression algorithms produce varying
artifacts at different compression levels. (They compete primarily on this
issue.) In general, the greater the compression the greater the loss and the
more apparent are the image artifacts, but the results vary with the algorithm.
Compression produces various types of noise and intensity-scale contouring
artifacts that are very similar in visual appearance to the various display
technology artifacts that we’ve considered here. They will interact together,
often magnifying the overall appearance of artifacts. In many cases the
compression artifacts are visually indistinguishable from similar display
artifacts.
Native Resolution and Image Rescaling
Almost
all signal sources are now digitally generated, so they have an underlying
pixel format and resolution, even when delivered as an analog signal. The
format is always expressed in the form of total horizontal pixels by total
vertical pixels, HxV. For example, computer based signal sources typically
range from 640x480 up through 2048x1536 and MPEG video sources, including DVDs
and digital television, are 720x480 for NTSC based systems and 720x576 for PAL
based systems. High Definition Television signals have resolutions of 1280x720
and 1920x1080 (although these resolutions are not technically required by the
ATSC standard, all current High Definition displays support them).
Native
Resolution
All
non-CRT based displays have a fixed digital pixel format, which is referred to
as the native resolution of the display. For non-CRT computer displays,
which are now primarily LCDs, the most common resolution formats are 1024x768,
1400x1050 and 1600x1200 for 4:3 Aspect Ratio screens, 1280x1024 for 5:4 Aspect
Ratio and 1280x768 for 5:3 Aspect Ratio. For Enhanced or High Definition
Television displays the most common resolution formats are 852x480, 1024x1024
(Plasmas with non-square pixels), 1280x720, 1365x768, 1386x788 (Sony projection
LCDs), and 1920x1080, all with wide 16:9 Aspect Ratio screens.
When
the pixel format of the image or signal matches that of the display, there is a
one to one correspondence so, in principle, it’s possible for the display to
produce an image that is a perfect match to the source image. For computer
images, which typically have fine text and graphics, this correspondence is
essential in order to maintain critical image detail. Fortunately, computer
graphics boards can be configured to support almost any resolution format that
is required by a display, although manufacturers generally support only the
most popular ones. Specialized utilities, like PowerStrip
(www.entechtaiwan.net), allow most graphics boards to be programmed for almost
any resolution that the hardware is capable of supporting. For video, on the
other hand, the agreement between signal source and display native resolution
is unfortunately not good. If you compare the resolutions listed above, there
are only two out of six matches: 1280x720 and 1920x1080.
Image
Rescaling
When
the pixel format of a signal or image doesn’t exactly match the display’s own
native pixel format then the image needs to be rescaled up or down to match
that format. Otherwise the image will overfill or underfill the screen. To
accomplish the rescaling for a display with digital pixels the image pixels
must be digitally interpolated and then resampled to the display’s native pixel
format. For example, consider rescaling a 720x480 DVD image into 1280x720, one
line at a time, the simplest case. (Sophisticated algorithms will use several
lines.) No matter how you try to do it, there will be periodic irregularities
(that show up as visual artifacts) in mapping 720 pixels into 1280 pixels, and
they will be quite noticeable whenever there is fine image detail. Note that
there is always a loss of sharpness with rescaling because image pixels are
combined by varying amounts. Rescaling also produces increased pixelation
artifacts.
Because
rescaling produces severe artifacts, the image must then be filtered in order
to help reduce the irregularities. Filters try to smooth over the
irregularities while maintaining as much sharpness as possible. They work by
adjusting the intensity values of neighboring pixels. Many displays provide a
choice of several different filters so you can pick the best compromise based
on the image content and structure and your visual preferences. Advanced
filtering techniques are a very important component to high quality rescaling.
There are many different rescaling and filtering algorithms in use, so there
will be huge differences in the quality of the rescaled images between
displays. While rescaling has improved dramatically over the last 10 years
there are fundamental mathematical limitations that restrict the accuracy and
quality of a rescaled digital image, so a rescaled image will always be lower
in quality than the original. This is true whether the signal is up-converted
to a higher resolution, or down-converted to a lower resolution.
Since
most video images are photographic in nature, they are already relatively fuzzy
and smooth, so the rescaling artifacts are not as apparent as in computer
graphics images. Given the resolution format mismatches above, rescaling is the
rule rather than the exception in video. In many cases both the signal source
and the display are capable of rescaling the image. The most important point is
to avoid double rescaling. This will happen if the signal source cannot rescale
directly to the native mode of the display. The display will then be forced to
perform a second rescaling, which should be avoided because of the additional
artifacts and image degradation. As an example, if you have a DVD player that
can rescale the image up to 1280x720, turn this feature off unless you have a
1280x720 display, such as in many current DLP displays and projectors. If you
have two or more components that can rescale the image make sure that you try
each one separately to determine which one does the best job.
On
the other hand, CRTs, as analog devices, don’t have a native resolution so
image rescaling occurs automatically once the display’s analog size and
position controls are adjusted. The image is just appropriately stretched or
compressed as needed. It’s an entirely analog process so there aren’t any
artifacts (except when the raster is visible). As a result CRT images generally
look better than digitally rescaled images on digital displays. In situations
where the raster is visible (because the CRT beam size is too small) it's
possible to increase the number of lines by digitally rescaling the image, but
that will introduce some of the rescaling artifacts that we discussed above.
(Horizontal rescaling artifacts are not as severe because a CRT lacks a
discrete digital pixel structure.)
DisplayMate includes a large selection of test patterns that can be used to
examine the accuracy of the image rescaling and the resulting artifacts. The
Multimedia Edition’s “Moiré Montage” test pattern is the ultimate test of
rescaling artifacts. It includes 12 different dither patterns that visually
demonstrate how the pixels are redistributed and merged together after
rescaling. Other test patterns, like resolution, focus and fine text can be
used to visually evaluate the effects of rescaling.
Image Noise
Noise
is any seemingly random variation in image content that doesn’t belong (static
or time varying) and there are many possible sources. One that is always
present is from the image or signal source. In video it can arise from the
camera sensor, grain in the film, a poor quality transfer, or encoding and
compression artifacts. Composite video signals also produce various cross-color
interference patterns, which are a form of image noise. Computer generated
images, on the other hand, generally have exceptionally low noise in analog
signal modes and zero noise in digital signal modes. If noise is visible from
an analog computer signal source, it’s generally the result of analog
electrical interference from other analog or digital signals inside the
computer.
In analog displays like the CRT, noise tends to
automatically cancel out through temporal and spatial averaging because of its
random nature. This makes the noise much less visually apparent. On the other
hand, most digital displays will magnify the appearance of analog signal noise
because they sample the signal, so the noise component becomes pixelated. Also,
the noise component in an analog signal generally averages out to zero at each
point in the image within a few frame times, but digital sampling will
generally not produce a series of digital values that average out to zero,
which increases the visibility of the noise. These effects were visually
apparent in all of the flat panel displays. Digital rescaling further magnifies
the noise. These noise artifacts are a major reason why poor signal quality
images (such as standard definition broadcast NTSC video) typically look better
on analog CRTs rather than on digital pixel displays. (Enhanced digital signal
processing and filtering methods are closing the gap.) Once an analog to
digital conversion takes place no additional noise propagation can occur,
although the digital signal can become distorted through signal processing (see
below).
Temporal
Dithering
A
source of image noise for displays that use digital intensity control, like the
Plasma and DLP technologies, is Pulse Width Modulation (PWM), which generates
the gray-scale by rapidly switching the pixels between on and off states and varying the percentage of time
that is spent in each state. The eye responds to the time-averaged brightness
of the pixel. This process is a form of temporal
dithering. The switching frequency is fairly high, typically up to 60,000
clock cycles per second (60 kHz). That’s generally too fast for the eye to
notice, but at low intensities a pixel will spend most of its time in the off
state, so the occasional switch to the on state becomes noticeable as a form of
switching noise. With this method it’s possible to produce between 8 and 10-bit
digital intensity scales, with 256 to 1024 levels, at standard video frame
rates. In some implementations the PWM cycle time extends down to 24 frames per
second (fps), which is lower than the 60 fps rate of the video signal. This
increases the number of intensity levels that can be generated but increases the
visibility of the PWM noise patterns and may also introduce some visible
flicker into the image.
Spatial
Dithering
In some cases a digital display may not be able to
generate all of the required (or desired) intensity levels. For example, in an
8-bit digital intensity scale, there may be duplicates or gaps in some of the
256 levels produced by the display device. (This is sometimes an issue over
only a portion of the gray-scale as the result of an irregular Transfer
Characteristic for the display device, which is typical for LCD and LCoS
technologies). To overcome this limitation the display electronics is
configured to automatically adjust the intensities of neighboring pixels so
their combined intensities average out to the desired values. This procedure is
called spatial dithering and it increases the gray-scale resolution.
Image sharpness is reduced somewhat in return for a smoother gray-scale and
reduced intensity contouring. It’s used in most Plasma and DLP displays and in
some LCDs, but never in CRTs because they already produce a perfectly smooth
intensity scale. Spatial dithering typically provides an additional 2-bits of
intensity resolution.
The averaging process may involve only adjacent pixels or
it can encompass larger groupings of nearby pixels in order to produce a finer
intensity scale. The dithering process introduces a form of spatial noise into
the image. The dithering algorithm may involve a fixed pixel pattern, which is
often more noticeable because it tends to produce repeating pixel patterns on
the screen, or error diffusion, which generates a seemingly random
pattern and a finer intensity scale, but also introduces more random noise into
the image. In some cases displays will provide a menu option to choose among
several dithering algorithms.
Noise Dithering
In some cases a perfect end-to-end digital signal train
may produce an image that is so “clean” that all of the artifacts that we
discuss here will become quite noticeable. In that case using a high quality
analog signal connection may instead produce a better looking picture because
the analog noise will soften and obscure many of the artifacts. In general,
it’s a good idea to compare both methods to see which one works the best. Since
that will vary with the source material, it’s best to permanently maintain
connections for both types of signals.
Sharpness and Noise Controls
Although they are often misused, Sharpness and Noise
Controls serve a very important function in improving image and picture quality
on all displays. For analog signals, the Sharpness Control can help to restore
high frequencies (which produce fine image detail) that have been lost
somewhere along the signal path. This can arise from mediocre performance in
the signal source or the display electronics. Also, long cable runs and/or poor
quality cables attenuate the high frequencies more than the low frequencies.
The Sharpness Control increases or decreases the amplitude of the high
frequencies (similar to the peaking circuits discussed under Signal Quality). The
trick is not to overdo it, which introduces spurious edge artifacts and
magnifies signal noise. DisplayMate for Windows Multimedia Edition includes a
Video Bandwidth Index test pattern that allows the Sharpness Control to be set
very accurately.
In many cases the analog signal is intentionally optimized
to look best on medium or low performance displays (that make up most of the
market), which generally do not have very good sharpness. This is done by
applying excessive high-frequency peaking and edge enhancement. It may be
implemented in the signal source hardware (computer graphics board or DVD
player) or through processing of the image content by the content creator (or
both). Unfortunately, high quality displays with excellent sharpness will then
show peaking and edge artifacts. The solution is to turn down the Sharpness
Control from its default setting, which will improve, but not eliminate the
artifacts.
CRTs benefit from a specialized sharpness control, called
an Aperture Control. Even if the CRT display has perfect electronics,
image sharpness is reduced because the CRT’s beam has a significant diameter
(aperture) that smears the image detail as it’s being drawn on the screen. The
Aperture Control helps correct for this effect.
Digital signals should not, in principle, need a Sharpness
Control, since that function should have been taken care of by the creator of
the image content. The problem is that the same digital output is used to
generate the analog output signal, and that signal is often designed to be
over-peaked so that the image looks sharper on lower performance displays. If
that’s the case the digital signals will also be over-peaked and also show
artifacts. If you find that to be the case, then lower the Sharpness Control in
order to reduce the artifacts. Turning up a digital signal Sharpness Control is
something that shouldn’t be done because much of the original signal
information has been lost in digitizing and processing the signal, so even if
it’s necessary the results won’t be very good.
Turning down the Sharpness Control serves to reduce image
noise. Many displays include a separate Noise Control that’s generally
implemented through digital signal processing. Its primary function is to
reduce specialized forms of noise, such as compression artifacts that show up
as image noise.
Motion
Artifacts
A motion artifact is any image irregularity that’s due to
an image changing over time. This includes camera panning in addition to the
motion of objects within the image. Some motion artifacts originate with the
signal format; others arise from the manner in which the internal electronics
updates the pixels in the display. Still others are due to inherent properties
of the display technology itself.
Interlacing
The most famous motion artifact is due to interlacing,
where the odd and even lines in an image are transmitted a 60th of a second apart in NTSC systems and
a 50th of a second in PAL
systems. This results in some flicker and also a structured blur (called
combing) when there is motion because the image is made up of components that
were taken at different times. The solution is to use signal processing
electronics to combine the odd and even sub-images into a single image that’s
shown all at once and has double the scan rate. This is called deinterlacing
(formerly line doubling). Special algorithms try to compensate for motion
shifts within the image between the even and odd fields. While many displays
include their own deinterlace processing, these motion artifacts have actually
nothing to do with the display technology itself and are due entirely to the
nature of the signal and the signal processing.
Note that image quality on some displays may
(surprisingly) decrease when they’re fed a non-interlaced (progressive scan)
signal because the video bandwidth requirements are double those of an
interlaced signal. Properly digitizing a progressive analog signal (including
pixel tracking) is also twice as hard. So try it both ways. If the display’s
deinterlacer is comparable in quality to that in your DVD player or other
signal source then there is a reasonable chance that you’ll get better results
with an interlaced signal input to the display.
3:2 Pulldown and Judder
This motion artifact arises from the fact that movies are
shot at 24 frames-per-second (fps) but video displays in NTSC based systems
operate at 60 fps (or 60 fields-per-second for interlaced displays). The
current solution is to show half the movie frames 3 times each and the other
half 2 times each, which is called 3:2 Pulldown. This exactly translates 24 fps
into 60 fps. The problem with this solution is that it produces irregular
on-screen motion because alternate movie frames are shown for significantly
different periods of time so the motion appears irregular. This artifact is
called Judder. (PAL based displays run at 50 fps and use 2:2 Pulldown,
but this speeds everything up by 4 percent, which is also an undesirable
artifact.) The proper solution is to run the displays at 72 fps and show each
frame 3 times (3:3 Pulldown). Surprisingly, very few video displays, projectors
or DVD players can currently operate in this mode. (However, some video
processors can generate 3:3 Pulldown signals.)
Most CRT computer displays and projectors can run at any
frame (refresh) rate from 50 to 150 Hz or more, including the industry standard
rates of 60, 72, 75 and 85 Hz. On the other hand almost all flat panel displays
(computer or video) are designed to run internally at a fixed refresh rate of
60 Hz, regardless of the external frame or refresh rate of the signal that is
provided. Many computer users mistakenly drive their flat panel monitors and
projectors at 75 or 85 Hz because they’ve heard that it cuts down on flicker,
but this works only for CRT displays. This just generates motion judder due to
the same frame rate conversion artifacts discussed above. Worse it can
needlessly decrease analog signal quality due to the video bandwidth and pixel
tracking effects noted in the Signal Quality section.
In order to go from 60 fps to 72 fps all of the display’s
internal clock rates need to increase by exactly 20 percent for NTSC based
systems (and 44 percent for PAL systems). The video bandwidth of the signal
processing electronics also needs to go up by the same amount. This is a
significant performance increase but it’s easily within the capabilities of
current display technology. Hopefully we’ll see more video displays, projectors
and DVD players in the near future that will be able to do 72 Hz and 3:3
Pulldown processing.
Digital Motion Artifacts
Many display technologies with digital pixels will produce
some form of artifact when there is motion in the image. This results from
differences in how the pixels are updated from one frame to the next by the
device electronics. In some digital displays the pixels are not all updated at
the same time, but rather in cycles and/or zones. For example, the top and
bottom halves of the screen may be updated separately or the odd and even lines
may be updated separately, the latter a variation on interlacing, except that
the input signal to the display is progressive rather than interlaced. You are
more likely to see these artifacts in older or lower performance Plasma and LCD
displays. These motion artifacts are most visible when the image contains fine
detail. DisplayMate Multimedia Edition’s “Moiré Montage” with 12 different
dither patterns is the ultimate test for these motion artifacts.
Motion artifacts also arise when there is any form of
temporal dithering that extends longer than the video frame time, such as in
some implementations of Pulse Width Modulation, because the motion interrupts
long switching cycles and thereby introduces some gray-scale contouring errors
around portions of the image that are moving or changing.
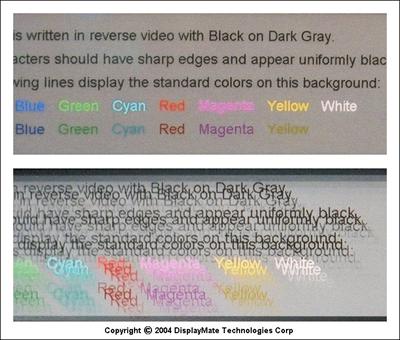
LCD Motion Artifacts
LCDs have their own special issues of motion smear due to
a slower response time of the liquid crystal. On the other hand, CRTs are
virtually immune from motion artifacts because they are analog devices and the
phosphors have fast response times. Compare the photographs of a moving
DisplayMate test pattern in Figure 2 for a CRT (top) and an LCD (bottom). These
photographs were made using DisplayMate Multimedia with Motion Edition, which
moves DisplayMate test patterns in varying directions and speeds in order to
look for all sorts of motion artifacts. In the photographs the image was moving
diagonally, from the lower right to the upper left. The photographs were made
with a traditional film camera because digital cameras can introduce their own
artifacts while capturing moving images on a display. Both displays were fed
identical signals. Since the LCD is brighter than the CRT, the grays show up
differently in the photographs. (This doesn’t affect the comparison.) Note that
these photographs are not of the Sony CRT and NEC LCD that we measured
in Parts I and II.
The CRT photo looks virtually identical to a stationary
image because of the fast phosphor response times and lack of motion artifacts.
However, on the LCD photo 5 images of the black text are visible - the most
recent plus 4 old decaying ghost images because of the slow liquid crystal
response time. (It's possible that printed versions of the photographs may not
show all of this detail. If that's the case then examine the online version of
the article with electronic versions of the photographs.) Each image is offset
from the previous one by 16.7 ms (milliseconds), which is 60 Hz. The oldest
visible ghost image is between 67 and 83 ms old. (The uncertainty arises
because we don’t know exactly at what point within the frame cycle the shutter
was activated.)
The manufacturer’s published response time specifications
are for black to peak intensity transitions (rise-time), peak intensity to
black transitions (fall-time) or the sum of the two (generally the total
response time). However, most transitions are between different gray-levels
rather than between the peak intensity and black extremes. The gray-to-gray (or
black-to-gray or white-to-gray) transitions generally take longer because the
electrical forces changing the liquid crystal alignment are much weaker (so
their response times are likely to be much larger). That’s one reason why the
ghosts in Figure 2 last as long as they do. Note that switching to either black
or peak intensity is much faster than to gray because those transitions show
much less ghosting or lag in the photograph. Special signal processing can
speed up the gray transitions (by briefly overdriving them) but that tends to
produce flicker artifacts. The panel's specified response time is 25 ms. The
NEC LCD4000 that we measured in Parts I and II has a manufacturer’s specified
response time of 23 ms, however, its motion artifacts were much less noticeable
than the panel that was photographed, although the quoted response times are
similar. This emphasizes that the response time specifications can be ambiguous
or misleading. (Unfortunately, we didn’t take any photographs of the motion
artifacts for the displays analyzed in this article series.)
Signal Processing
A
fair amount of signal processing must occur between the display’s signal input
connectors (whether they’re analog or digital) and the display device. Any
adjustment, correction or change in the image requires some sort of signal
processing. For example, each of the user, service, factory and calibration
controls modifies the signal in some way and therefore requires signal
processing. Getting the display to produce the desired Gamma and gray-scale
(see Part II) generally requires a considerable amount of processing.
Analog
Processing
For
analog signals it’s relatively simple (in principle) to implement the necessary
signal processing because most of the controls merely involve a change in
amplitude (gain) or bias (DC or black-level offset), but it takes very high
quality engineering and components to do it well. The most complex analog
circuitry is involved in producing the desired Gray-Scale and Gamma because it
has to correct the non-linear variations in the display’s Transfer
Characteristic. (Most CRTs generally don’t try to change their native Gamma and
digital displays that accept analog signals will implement the Gamma correction
digitally after the analog-to-digital conversion.) The biggest problem is that
analog circuits are imprecise, and that leads to the artifacts discussed under
Analog Signal Quality.
Digital
Processing
The
electronics for implementing digital signal processing are considerably more
complex than analog signal processing. This is the main reason why most
displays currently offer fewer controls with digital inputs than with analog
inputs. For example, for the standard 8-bit 0-255 intensity scale that has 256
levels, merely increasing the black-level by 10 levels requires that the number
10 be digitally added to the intensity value for each pixel that is received by
the display. The first problem is that this needs to be implemented in special
image processing hardware. The second problem is that we automatically lose 10
intensity levels so there are now only 246 active levels on the 0-255 scale. A
third problem arises if we wish to recover the now illegal values of 256 to 265
from the addition and restore them back to the 0-255 scale. To do this, it’s
necessary to effectively multiply all of the signal intensity values by a
factor of 255/265=0.962. (It can be done with fixed point arithmetic or a
look-up table.) This is actually a rescaling of the intensity values and is
equivalent to lowering the analog video gain using a Contrast Control. A fourth
problem arises because the intensity scale has now acquired some irregularities
(artifacts) because the former 256 steps are now remapped and squeezed into 246
steps, resulting in some visible 7-bit intensity-scale banding and false
contouring.
This
same type of processing is required for each control pair that is implemented
digitally: Brightness and Contrast, Red, Green and Blue Drive and Bias. More complex
processing is required to implement Color Tint and Saturation Controls.
Finally, additional processing is required to implement the desired Gray-Scale
and Gamma (generally in the form of a look-up table). All of this can be done
with custom image processing chips. However, each processing step in the chain
results in a further loss of intensity levels and mathematical precision, so
the cumulative errors can be quite large and produce severe artifacts that will
be seen on screen. To prevent this from happening the internal signal
processing should be done with more than the external 8-bit signal intensity
scale. The greater the degree of processing required the finer the internal
intensity scale that is needed internally. 10-bits is the minimum needed in
order to restrain the 8-bit artifacts from growing too much as discussed in the
Digital Granularity section above.
Gray-Scale
and Color Artifacts
We have discussed many different artifacts that affect the
accuracy and granularity of a display’s intensity scale with digital signals.
They all compound together and progressively accumulate to produce the final
intensity scale that we see on the screen. Many of the irregularities are
quasi-periodic and so they may interfere and beat against each other, which
introduces additional moiré interference patterns on the intensity scale.
Because of varying control settings and tolerances, the irregularities will be
different for each of the Red, Green and Blue primary color channels, so the
gray-scale may acquire a complex tinted structure due to the different
rippling. All of these effects add false textures and contours into an image.
The quality of the signal processing determines how noticeable these effects
will be. CRTs as analog devices are immune to all of these artifacts.
DisplayMate
Multimedia Edition includes a large number of test patterns that can be used to
check on the smoothness of the gray-scale and whether there are any
irregularities in the form of contouring or banding. Varying the range and step
size within a gray-scale allows all sorts of subtle patterns to be easily
detected. Noise bands from Pulse Width Modulation are easy to detect in this
way. The “Gray-Scale Tunnel” test pattern visually translates irregularities
into virtual 3D spatial effects and is an excellent way of determining whether
any of the artifacts will be noticeable on screen.
Closing
In Part III we have discussed a wide range of artifacts
than can affect the different display technologies. The underlying theme
throughout has been analog versus digital. The real issue is not which one is
better because they are both necessary, but rather how to make them perform as
perfectly as possible together. Over the last few years analog video
performance has slipped due to a move towards large-scale integration chips and
away from the use of specialized high-performance components. The digital
portion of the pie will continue to increase but it’s going to take a while to
make all of the digital artifacts shrink to the point where they will become
almost invisible. That will eventually call for 12-bit signals and 16-bit
processing. As the bit-depth and number of levels increase digital processing will
begin to behave more like a perfect scale-free and artifact-free analog system.
The audio world has done a much better job in carefully integrating the analog
and digital domains together and producing outstanding end-to-end system
performance. Many of the technical issues are identical although the
frequencies involved are more than a factor of a thousand apart.
What’s Coming Next
In Part IV we’ll continue with a discussion of specialized artifacts
that apply to only one particular display technology and then analyze and
assess each display technology in detail and tie together all of the results
from Parts I to IV.
Acknowledgements
Special thanks to Craig Verbeck of Pixelworks for discussions
on signal processing, and to Joe Lee and Paul Wolf of Silicon Image for
information on DVI and HDMI.
About the
Author
Dr. Raymond Soneira
is President of DisplayMate Technologies Corporation of Amherst, New Hampshire. He is a research scientist
with a career that spans physics, computer science, and television system
design. Dr. Soneira obtained his Ph.D. in Theoretical Physics from Princeton University,
spent 5 years as a Long-Term Member of the world famous Institute for Advanced
Study in Princeton, another 5 years as a Principal Investigator in the Computer
Systems Research Laboratory at AT&T Bell Laboratories, and has also
designed, tested, and installed color television broadcast equipment for the
CBS Television Network Engineering and Development Department. He has authored
over 35 research articles in scientific journals in physics and computer
science, including Scientific American.
If you have any comments or questions about the
article, you can contact him at dtso@displaymate.com.
Article Links
Series
Overview
Part
I: The Primary Specs
Part
II: Gray-Scale and Color Accuracy
Part
III: Display Artifacts and Image Quality
Part
IV: Display Technology Assessments
Copyright © 1990-2005 by DisplayMate
Technologies Corporation. All Rights Reserved.
This article, or any part
thereof, may not be copied, reproduced, mirrored, distributed or incorporated
into any other work without the prior written permission of DisplayMate
Technologies Corporation
