OnePlus 8T Display Technology Shoot-Out
Dr. Raymond M. Soneira
President, DisplayMate Technologies
Corporation
Copyright © 1990-2020 by DisplayMate
Technologies Corporation. All Rights Reserved.
This article, or any part
thereof, may not be copied, reproduced, mirrored, distributed or incorporated
into any other work without
the prior written permission of DisplayMate Technologies Corporation
|
OnePlus 8T
|
Introduction and Overview
The key element for a great
Smartphone has always been a truly innovative and top performing display, and
the best leading edge Smartphones have always flaunted their super high tech
displays. It is the display performance that determines how good and how
beautiful everything on the Smartphone looks, including the camera photos,
videos, movies, web content, plus all of your Apps, and also how readable and
how usable the screen is in High Ambient Lighting. The Display is the Crown
Jewel of the Smartphone!
In this Display Technology Shoot-Out article series we Only Test and
Only Cover the Very Best State-of-the-Art
Top Performing Top Tier Smartphone Displays.
The articles are designed to promote Superior
Display Performance so that consumers,
reviewers, and journalists all Recognize and
Appreciate Display Excellence, and also to
reward and encourage manufacturers to produce top performing displays for their
products.
All of the DisplayMate Display Performance Grades, Ratings and Awards are
based Entirely on the extensive objective Lab Tests and Measurements that we
also publish, so that everyone can judge and compare the display performance
data for themselves as well. As Display Performance continues to improve each
year we have and will continue to raise the Performance Levels necessary to
receive a DisplayMate Best Smartphone Display Award and A+ Display Rating. As a
result, only the Very Best Displays will continue to receive A+ Ratings each
year.
This is an independent scientific objective Lab test and analysis
of OLED displays written for consumers, reviewers, and journalists. It is the
latest edition in our ten year article series that has Lab tested, tracked and
analyzed the development of mobile OLED displays and display technology, from
its early beginnings in 2010, when OLED displays started out in last place,
into a rapidly improving and evolving display technology that now has a
commanding first place lead and continues pushing ahead aggressively..
The Move to OLED Displays
LCDs are a great cutting edge high performance display technology for
Tablets to TVs, but for small handheld Smartphones, OLED displays provide a
number of major advantages over LCDs including: being much thinner, much
lighter, without needing a bezel, with a rimless edge-to-edge full screen
design. They can be made flexible and into curved screens, plus they have very
fast response times, better viewing angles, and can provide always-on display
modes.
The very fast Response Times of OLED displays makes the new Higher 120 Hz Screen Refresh Rate possible, which improves image Scrolling and Videos, plus
Motion and Gaming Performance in Apps.
Many of the OLED performance advantages result from the fact that every
single sub-pixel in an OLED display is independently directly electrically
powered to emit light, so only the active image sub-pixels draw power based on
their individual brightness levels. OLEDs can also provide better color
accuracy, image contrast accuracy, and screen uniformity because the
irregularities and variations in LCD Backlights introduce color and brightness
irregularities and variations over the screen.
As the result of their very versatile power management capabilities,
OLEDs are not only more power efficient than LCDs for most image content, but
they now deliver much higher Peak Brightness than LCDs because the maximum
power can be delivered to just the sub-pixels that are needed for producing the
current image. However, for mostly all white screen content, LCDs are likely to
remain brighter and more power efficient for a while.
Some of the OnePlus 8T Display
Performance Highlights
These are only a few of the OnePlus 8T Display
Performance Highlights that we will be covering in detail throughout the
article:
· Very High Absolute Color Accuracy (0.5 JNCD) that is Visually Indistinguishable From Perfect.
· Very High Image Contrast Accuracy and Intensity Scale
Accuracy that is Visually Indistinguishable From
Perfect.
· High Brightness Mode (up to 1,090 nits) in High
Ambient Light.
· Peak Brightness, Color Accuracy, Contrast Accuracy and
Intensity Scales that are Independent of the on-screen Average Picture Level
APL.
· Small Shifts in Brightness and Color with Viewing Angle,
including White, which is the most common
background color.
· OnePlus 8T sets or
matches 11 Smartphone Display Performance Records, earning DisplayMate’s
highest ever A+ grade.
Comparison of the OnePlus 8T with the
OnePlus 8 and OnePlus 8 Pro
The OnePlus 8T is an enhanced version of the OnePlus 8
that includes some display functions and features found on the OnePlus 8
Pro.
· Improved 120 Hz Display Refresh Rate
compared to the 90 Hz Refresh Rate on the OnePlus 8.
· Improved Display Calibration Color
Accuracy and Image Contrast Accuracy.
· Improved High Brightness Mode
Luminance Accuracy.
You can compare their display
performance in detail by using a Tabbed web browser with our DisplayMate
Display Technology Shoot-Out articles for each model.
OnePlus 8T Conclusion Summary
Below is the OnePlus 8T Display Performance Summary from the Conclusion section:
All of the DisplayMate Display Performance Grades,
Ratings and Awards are based Entirely on the extensive objective Lab Tests and
Measurements that we also publish, so that everyone can judge and compare the
display performance data for themselves as well.
Based on our extensive Lab Tests and Measurements the OnePlus 8T has a Very Impressive Excellent Top Tier World
Class Smartphone Display with close to Text Book Perfect Calibration Accuracy and Performance
that is Visually Indistinguishable From Perfect. Based
on our objective Lab Tests and Measurements the OnePlus
8T receives a DisplayMate Best Smartphone
Display Award earning DisplayMate’s highest ever Display Performance Grade of A+ and setting or matching 11 Smartphone Display Performance Records. As a result
OnePlus 8T joins the very select Top Tier of the Best
Smartphone Displays.
Article Overview
This OnePlus 8T article has the following major sections:
· Highlights: The Display Highlights and Performance Results
section below has detailed information, explanations, and analysis.
· Features: The Display Performance Functions
and Features section lists the main functions and features.
· Conclusions: The OnePlus 8T Conclusions section summarizes all of the
Results, Features, Functions and Records.
· Records: The Display Performance Records section lists the Lab
measurement performance records.
· DisplayMate A+ Rating: The
Display Rating section summarizes the Display
Ratings and Criteria.
· DisplayMate Award: The
Best Smartphone Display Award
section summarizes the DisplayMate Display Performance Award Criteria.
· Measurements: The Display Shoot-Out Lab Measurements Comparison Table has the
complete set of measurements and tests.
· Assessments: The Display Performance Assessments section summarizes the
display evaluation details.
· Future of OLED: The Future of OLED Smartphones
examines the evolution of OLED displays.
· The Next Generation: Improving the Next Generation of
Mobile Displays
· Performance in Ambient Light: Improving Display
Performance for Real World Ambient Light
We’ll cover all of the these display performance topics and
much more, with in-depth expert comprehensive display tests, measurements and
analysis that you will find nowhere else.
The Display Shoot-Out
To examine the
performance of the OnePlus 8T OLED Display we
ran our in-depth series of Mobile
Display Technology Shoot-Out Lab Tests and Measurements in order to
determine how the latest OLED displays have improved. We take display quality
very seriously and provide in-depth objective analysis based on detailed
laboratory tests and measurements and extensive viewing tests with both test
patterns, test images and test photos. To see how far OLED and LCD mobile
displays have progressed see our 2010 Smartphone
Display Shoot-Out, and for a real history lesson see our original 2006 Smartphone Display
Shoot-Out.
OnePlus provided DisplayMate Technologies with a pre-announcement
production unit of the OnePlus 8T so that we could perform our well known
objective and comprehensive DisplayMate Lab tests, measurements, and analysis,
explaining in-depth the display performance results for consumers, reviewers,
and journalists as early as possible.
OnePlus 8T Display Highlights and
Performance Results
In this section we review and explain the principal
results from the extensive DisplayMate Lab Tests and Measurements
in the following categories: Display
Specifications, Overall Assessments, Screen Reflections, Brightness
and Contrast,
Colors and Intensities,
Absolute Color Accuracy, Viewing Angles, OLED Spectra,
Display Power.
Display Lab Tests and
Measurement Data Table
See the Display Shoot-Out Lab
Measurements Comparison Table below for the complete set of DisplayMate Lab
Tests and Measurements.
Main Topics
Covered
This Display Highlights and
Performance Results section has detailed information, explanations, and
analysis on the OnePlus 8T Display for the Main
Topics listed below.
You can skip this section and go directly to the OnePlus 8T Conclusions for a Summary of the Display Test
and Performance Results.
· State-of-the-Art OLED Display
· Large Full Screen Display
· Front Camera Punch-hole
· 3K High Resolution Display
· Diamond Pixels
· Higher 120 Hz Screen Refresh Rate
· Selectable Color Gamuts and Screen Calibration Modes
· Industry Standard Color Gamuts
· Automatic Color Management
· Very High Contrast Accuracy and Intensity Scale
Accuracy
· Peak Brightness that is Independent of the on-screen
Image Content
· Color Accuracy and Intensity Scales that are Independent
of the Image Content
· Natural Mode with Very High Absolute Color Accuracy
· Vivid Mode with Vibrant Colors
and Contrast
· Advanced AMOLED Wide
Gamut Mode
· Advanced Modes with User Adjustable White Points
· Advanced AMOLED Wide Gamut Mode in Ambient Light
· High Screen Brightness and Performance in High
Ambient Light
· High Brightness Mode
· High
Dynamic Range Mobile HDR10+ Display
· Viewing Angle Performance
· Vision Comfort Night Mode with Reduced Blue Light
· Super Dim Setting
· Dark Mode
· Viewing Tests Performance
· Display Power Efficiency
· State-of-the-Art OLED
Display
The OnePlus 8T has a State-of-the-Art Full
Screen Flexible OLED display panel from Samsung Display, which
produces most of the Top Tier Smartphone displays for leading manufacturers.
While the OLED display itself is flexible, the screen remains rigid under an
outer hard cover glass. The very fast Response Times of the OLED display makes
the new Higher 120 Hz Screen Refresh Rate possible, which improves image Scrolling and Videos, plus
Motion and Gaming Performance in Apps.
· Large 6.55 inch Full
Screen Display with a Wide Aspect Ratio of 20 : 9
The OnePlus 8T has a large 6.55 inch State-of-the-Art OLED display that
almost fills the entire front face of the phone from edge-to-edge.
The display also has a new form factor with a taller height to width Aspect Ratio of 20 : 9 = 2.22, which
is 25% larger than the 16 : 9 = 1.78 on most Smartphones (and widescreen
TVs) because the display now has the same overall shape as the entire phone. It
is taller in Portrait mode and wider in Landscape mode. This provides extra
space for Notifications and for displaying multiple Apps and content
simultaneously on-screen side-by-side.
· Front Camera Punch-hole
Minimizing the thickness of any bezels and borders that appear around
the display is now a major priority for both consumers and manufacturers.
The major challenge has been minimizing the space required for the
various sensors, camera and speaker on the front of the phone. In the past the
approach was to reserve a black border area along the entire top edge of the
phone. This resulted in an increased overall size of the phone, so a new
approach was to let the display fill the front face of the phone, but then cut
out a middle slot at its very top for the camera, sensors and speaker. However,
this then significantly cuts into the standard rectangular shape of the
display, and eliminates some the image content that is supposed to appear
there, including photos, videos, and Apps.
Instead, the OnePlus 8T display has a very small circular Punch-hole at
the very top of the screen for the front facing selfie camera and sensors. The
Front Camera Punch-hole is just 3.9mm in diameter, and it takes up only a tiny 0.1% of the total
display area, a key factor in the high 92%
Screen-to-Body Ratio for the OnePlus 8T.
The Punch-hole is implemented as a clear window opening within the OLED
display, something that cannot be done with LCD technology because of its
embedded Liquid Crystal. The Punch-hole appears as a very sharp very well
defined circle because of the fine Diamond Sub-Pixel structure of the OLED
display.
· 2K+ High Resolution FHD+ 2400x1080 Display with 402 pixels
per inch
The OnePlus 8T has a 2K+ High
Resolution Full HD+ display with 2400x1080
pixels and 402 pixels per inch, with 2.6
Mega Pixels, 25 percent more than on your HDTV.
The pixels per inch
specification is often used as the primary marketing feature for Smartphone
displays. While many Flagship models have 450 to 500+ pixels per inch, that is
more than most users and most applications need for good visual sharpness and
picture quality. For example, many of Apple’s Retina Displays have 326 pixels
per inch. The 402 pixels per inch on the OnePlus 8T is in the middle of this
range. Two key factors in producing high visual image
sharpness are Diamond Pixels and Sub-Pixel Rendering, which we discuss
next...
The OnePlus 8T display has both Diamond
Pixels (see below) and Sub-Pixel Rendering,
providing significantly higher image sharpness than can be resolved with normal
20/20 Vision at the typical viewing distances of 12 inches or more for
Smartphones, so the display appears perfectly sharp.
The OnePlus 8T uses Sub-Pixel
Rendering, which further improves image sharpness because the individual
Red, Green and Blue Sub-Pixels are treated as independent addressable image
elements and are not bound together as complete Pixels (like in most displays),
so the nearest Sub-Pixel is used when rendering the image. In some cases,
Sub-Pixel Rendering can make the screen appear to have up to 3 times the
resolution of traditional Pixel Rendering.
· Diamond Pixels
A Diamond Pixel layout is used on most Smartphone OLED
displays rather than an RGB Stripe pattern that is used for most LCDs. The Red,
Green, and Blue sub-pixels have very different sizes -- Blue is by far the
largest because it has the lowest light emission efficiency, and Green is by
far the smallest because it has the highest efficiency. The alternating Red and
Blue sub-pixel arrangement leads to a 45 degree diagonal symmetry in the
sub-pixel layout. This allows vertical, horizontal, and particularly diagonal
line segments and vectors to be drawn with reduced aliasing and artifacts. In
order to maximize the sub-pixel packing and achieve the highest possible pixels
per inch (ppi), that leads to a Diamond rather than Square or Striped arrangement
of the Sub-Pixels.
· Higher 120 Hz Screen Refresh Rate
Most Smartphones refresh their screens 60 times per
second (Hz) or less. The OnePlus 8T has both the Normal 60 Hz Display Refresh Rate plus a New Higher 120 Hz Refresh Rate. The very fast Response Times of
OLED displays makes the Higher 120 Hz Refresh Rate possible.
Doubling the Refresh Rate provides several important
advantages, including much smoother Scrolling and Videos, plus improved Motion
and Gaming Performance in Apps. In addition, some people can sense screen
flicker on some Smartphone displays, which can result in visual fatigue, eye
strain, and headaches. The 100% higher Refresh Rate and higher Pulse Width
Modulation Rate of 480 Hz for the OnePlus 8T
may reduce or eliminate this effect for some users that are affected by display
flicker.
· Selectable Color Gamuts and Screen Calibration Modes
The OnePlus 8T provides 5 user selectable Screen Calibration modes that provide control of the
Color Gamut, Vividness and Contrast of the displayed images. They are the Natural mode, which provides the most Accurate Colors
and Contrast, the Vivid mode, which provides
more Vibrant Colors and Contrast, and 3 Advanced modes that include: an adjustable sRGB Gamut mode, an adjustable P3 Gamut mode, and an adjustable AMOLED Wide Gamut mode that provides the Full Native
Color Gamut of the OLED display.
Use Display Settings to switch
between the Screen Calibration modes.
See this Figure for the Color Gamuts and Color Modes
and the Colors and Intensities section for
the measurements and details. Note that the Vivid mode
is the standard and factory default Screen Calibration mode. Use Display
Settings to switch between the Screen Calibration modes. We discuss each of the
tested Screen Calibration modes below…
· Industry Standard Color Gamuts
The OnePlus 8T supports the two most important Industry Standard Color Gamuts: the sRGB / Rec.709 Color
Gamut that is used for most current consumer
content, and the new Wide DCI-P3 Color Gamut that is used in 4K Ultra HD TVs. The DCI-P3 Gamut is
26 percent larger than the sRGB / Rec.709 Gamut. However, Automatic Color Management provides support for a
large number of other Standard and Non-Standard Color Gamuts...
· Automatic Color Management
Most Smartphones and Tablets generally provide only one
to several fixed Color Gamuts. The OnePlus 8T Natural
mode has Automatic Color Management that
automatically switches to the proper Color Gamut for any displayed image content
that has an ICC Profile within the OLED Wide Color Space, so images
automatically appear with the correct colors, neither over-saturated or
under-saturated. Automatic Color Management with
multiple and varying Color Gamuts is a very useful and important
state-of-the-art capability that all manufacturers will need to provide in the
future.
· Very High Contrast
Accuracy and Intensity Scale Accuracy
The
Intensity Scale (sometimes called the Gray Scale) not only controls the Image
and Picture Contrast within all displayed images but it also controls how the
Red, Green and Blue primary colors mix to produce all of the on-screen colors.
So if the Intensity Scale doesn't accurately follow the Standard that is used
to produce virtually all consumer content then the Image Colors, Image
Contrast, and their Brightness Intensities will be wrong everywhere in all
images. Unfortunately, many manufacturers are quite sloppy with the Intensity
Scale on their displays (because it is logarithmic rather than linear).
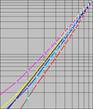
Fortunately,
the Intensity
Scale for the Natural mode on OnePlus 8T is a close to perfect match of the Intensity
Scale Standard, and is Visually Indistinguishable from Perfect. See Figure 3 for a plot of the
measured Intensity Scale and the Contrast and Intensity Scale section for the measurements and details.
· Peak Brightness that
is Independent of the on-screen Image Content
The Average Picture Level (APL) for on-screen image
content is the Average Brightness (Luminance) over the entire screen, which
varies from 0% for an all Black screen, up to 100% for an all White screen at
Peak Brightness.
On most existing OLED displays the Peak Brightness
(Luminance) changes with the APL of the on-screen image, with the Peak
Brightness increasing by as much as 50 percent or more between High APL and Low
APL. This increasing High Brightness with Low APL effect can be very useful in
improving screen readability in High Ambient Light, and also to highlight
certain on-screen image content. But the resulting variations in display
Brightness can distort the brightness relationships when viewing photos, in
videos, and other images, so for display modes that provide High Accuracy the
Luminance variation with APL should be as small as possible.
On the OnePlus 8T the Luminance variation with picture
content APL is a Very Low 2 percent for the Natural
mode. But as we discuss next, the main reason for doing this is actually
to improve the Absolute Color Accuracy and Absolute Contrast Accuracy of the
display. See the Screen Brightness section for the
measurements and details.
· Color Accuracy and
Intensity Scales that are Independent of the on-screen Image Content
The Absolute Color Accuracy and
Intensity Scale of the display should not change as the on-screen image content
changes.
As we discussed above, the first step is to make sure
that the Peak Brightness (Luminance) of the display does not change with the
Average Picture Level APL of the on-screen images because High Color Accuracy
is impossible when that occurs.
With the continuing improvements in display performance
we have added a new set of advanced tests that measure the variations in the
Absolute Color Accuracy and the Intensity Scales with changing
Average Picture Level APL, comparing the Shifts between Low APL and 50% High APL.
Previous generation displays with large Peak Luminance changes with APL
typically show Large Shifts in the Intensity
Scale and Large Shifts in Absolute Color
Accuracy with APL. Since the OnePlus 8T has a small 2
percent change in Luminance with APL, we expect Small
Shifts in Accuracy with APL, which we analyze next...
The Variation
in the Intensity Scales between Low APL and 50% APL for the Natural modes
is shown Figure 3. Any
change in the Intensity Scale will affect the Absolute Color Accuracy. There is
only a very small Shift in the Intensity Scales
with APL, with the Gamma essentially unchanged with 2.17
for Low APL and 2.17 for 50% APL. As a
result, we expect the Absolute Color Accuracy to have very small variations
with APL.
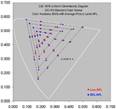
The Variation
in the Absolute Color Accuracy between Low APL and 50% APL for the Natural
sRGB and DCI-P3 Modes is shown in Figure 4. The Color
Shifts with APL are very small, with an Average Color
Shift of just 0.3 - 0.4 JNCD and the Largest
Color Shift of only 0.6 JNCD for the Natural Modes. In addition, the White Point Shifts with APL are also very small at 0.5 JNCD.
All the Color Shifts and Contrast Shifts with APL are
very small and Visually Indistinguishable from
Perfect. See this Figure for an explanation
and visual definition of JNCD and the Color APL Shifts section for the measurements and
details.
· Natural Mode with Very High Absolute Color Accuracy
Delivering great color with high Absolute Color Accuracy
is incredibly difficult because everything on the display has to be done just
right. In order to deliver accurate image colors, a display needs to closely
match the standard Color Gamut that was used for producing the content being
viewed – not more and not less. In addition the display also needs an accurate
(pure logarithmic power-law) Intensity
Scale, and particularly important is a very accurate White
Point.
The Natural mode has ICC
Color Management that automatically switches to the appropriate Color Gamut
Standard for the current on-screen content.
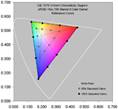
The Absolute Color Accuracy of
the Natural mode is Truly Impressive as shown in these Figures. It has an
Absolute Color Accuracy of 0.6 JNCD (Just
Noticeable Color Difference) for the sRGB / Red.709
Color Gamut that is used for most current consumer content, and 0.5 JNCD for the Wider DCI-P3
Color Gamut that is used for 4K UHD TVs and Digital Cinema, which are both Visually Indistinguishable From Perfect, and very
likely considerably better than any mobile display, monitor, TV or UHD TV that
you have.
Note that in order to obtain this High Absolute Color
Accuracy the Screen Calibration mode must be set to
Natural in Display Settings, and the Vision Comfort Night Mode
must also be Off because it changes the White
Point of the display from the 6,500 K Standard, which then changes the Absolute
Color Accuracy throughout the Color Gamut. See this Figure for an explanation
and visual definition of Just Noticeable Color Difference JNCD and the Color Accuracy Plots with
41 Reference Colors showing the measured
display Color Errors. See the Color Accuracy
section and the Color
Accuracy Plots for the measurements and details. Select
the Natural mode using Display Settings – it is Not the default Screen
Calibration mode for the OnePlus 8T.
· Vivid Mode with Vibrant Colors and Contrast
The Vivid mode provides
more Vibrant Colors and Higher Image Contrast than the Natural mode by using
the wider DCI-P3 Color Gamut together with a steeper Intensity Scale that
increases the Color Saturation for all image and picture content. Some people
like the more Saturated and Vibrant Colors, plus it is useful for special
applications, and especially when using the OnePlus 8T in medium to high levels
of Ambient Light, because it offsets some of the reflected light glare that
washes out the on-screen image colors. We examine the change in the Color Gamut
with Ambient Light below. Select the Vivid mode using
Display Settings – it is the factory default Screen Calibration mode for the
OnePlus 8T.
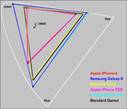
· Advanced AMOLED Wide
Gamut Mode
The Advanced AMOLED Wide Gamut
mode has the Wide Native OLED Color Gamut. It provides significantly
higher Color Saturation, with a large 142 percent of
the Standard sRGB / Rec.709 Color Gamut and 113
percent of the Standard DCI-P3 Color Gamut, very close to the highest
that we have ever measured for Smartphones and Tablets.
Some people like the more saturated and Vibrant Colors,
plus it is useful for special applications, and especially when using the
OnePlus 8T in medium to high levels of Ambient Light, because it offsets some
of the reflected light glare that washes out the on-screen image colors. We
examine the change in the Color Gamut with Ambient Light below. Select the Advanced AMOLED Wide Gamut mode using Display Settings
– it is Not the factory default Screen Calibration mode for the OnePlus 8T.
· Advanced Screen
Calibration Modes with User Adjustable White Points
For the Advanced Screen Modes, the OnePlus 8T has an
adjustable White Point Slider that allows users to
change color of White. The Slider control allows the White Point Color
Temperature for the Advanced sRGB and P3 modes to range from 5,350 K, which has a somewhat Warmer Tint than the
Standard D65 White, up to 8,100 K, which has a
Bluish (Cold) Tint that some people like. For the Advanced AMOLED Wide mode the
White Point ranges from 5,650 K up to 8,950 K.
So with the OnePlus 8T you can set the Color of White that you prefer.
· Advanced AMOLED Wide
Gamut Mode Offsets the Loss of Color Saturation and Color Gamut in Ambient
Light
The Advanced AMOLED Wide Gamut
mode is particularly useful in moderate to high levels of Ambient Light
because its larger Native Color Gamut offsets
some of the loss of Color Saturation and Color Gamut that occurs when using the
other Accurately Calibrated Standard Screen Calibration modes. This Figure shows the
measured decrease in the Natural modes with increasing Ambient Light, from 0
lux, which is perfectly dark, up through 2,000 lux, which corresponds to
typical outdoor daylight in shade.
At 500 lux, which
corresponds to typical office lighting, the measured on-screen Color Gamut for
the Natural modes decreases to 90%. At 1,000 lux, which corresponds to very bright indoor
lighting or outdoor daylight with an overcast sky, the measured on-screen Color
Gamut decreases down to 81%, and at 2,000 lux the measured on-screen Color Gamut falls to
67%. This loss of Color Saturation and wash out
in Ambient Light is well known to all display users.
The way to improve the Display Color Accuracy and
performance in Ambient Light is to start with a larger Color Gamut, like the AMOLED Wide Gamut mode, which is shown in this Figure compared
to the Natural modes for 0 lux up through 2,000 lux. At 3,000 lux the AMOLED
Wide Gamut mode provides a much better match to the sRGB / Rec.709 Color Gamut
than the sRGB Natural mode. The AMOLED Wide Gamut mode also provides a good
match to the DCI-P3 Color Gamut at 500 lux. So the
AMOLED Wide Gamut mode provides more accurate on-screen colors in moderate to
high Ambient Lighting than the Calibrated Natural Modes, which are designed and
calibrated for Low Ambient Light. Applying Dynamic Color Management
based on the current Ambient Light lux level in the future will able to further
improve color accuracy over a wide range of Ambient Light levels, which we
discuss further in the Improving Display Performance
for Real World Ambient Light section in the Conclusion.
· High Screen
Brightness and Performance in High Ambient Light
Mobile displays are often used under relatively bright
Ambient Light, which washes out the image color saturation and contrast,
reducing picture quality and making it harder to view or read the screen. To be
usable in High Ambient Light a display needs a dual combination of high Screen Brightness and low Screen
Reflectance – the OnePlus 8T has both. This is extremely important for screen
readability, picture quality, and color accuracy in Ambient Light.
With Adaptive Automatic Brightness turned Off and the
Brightness slider set Manually to Maximum, the OnePlus 8T produces between 479 to 492 cd/m2 (nits) for the Natural
mode and 493 to 620 nits for the Vivid mode,
based on the Average Picture Level APL of the
image content, among the very brightest that we have
ever measured for a Smartphone with Automatic Brightness turned Off. See the Screen Brightness section
for the measurements and details.
The measured OnePlus 8T Screen
Reflectance is 4.3 percent, the lowest that we have ever measured for a
Smartphone. Our Contrast Rating for High Ambient Light
quantitatively measures screen visibility and image contrast under bright
Ambient Lighting – the higher the better. As a result of its high Brightness
and low Reflectance, the OnePlus 8T has a Contrast
Rating for High Ambient Light that ranges from 111
to 114 for the Natural mode and 115 to 144 for
the Vivid mode, among the very highest that we have ever measured for a
Smartphone. See the Screen Reflectance section
for the measurements and details.
· High Brightness Mode with Adaptive Automatic Brightness On
On the OnePlus 8T the
Maximum Screen Brightness can go much higher when Adaptive
Automatic Brightness is turned On, so that users can’t permanently park
the Manual Brightness slider to very high values, which would run down the
battery quickly. High Screen Brightness is only needed
for High Ambient Light, so turning Adaptive Automatic Brightness On will
provide better high Ambient Light screen visibility and also longer battery
running time.
When Adaptive Automatic
Brightness is turned On, the OnePlus 8T
has a High Brightness Mode that produces up to 1,090 cd/m2 (nits) in Vivid mode in High
Ambient Light, which is where high Brightness is really needed, and is
considerably Brighter than with Manual Brightness when Adaptive Automatic
Brightness is turned Off.
The OnePlus 8T produces up to 790
nits in Vivid mode for an All White Full Screen
100% Average Picture Level APL image, which is the most challenging image for
an OLED display because all the pixels are at full power
See the Brightness and
Contrast, the High Ambient Light and the Screen Reflections sections for the measurements and
details.
· High Dynamic Range Mobile HDR10+ Display
The OnePlus 8T can play 4K High Dynamic Range content
made for 4K UHD TVs. High Dynamic Range
(HDR) is the newest performance enhancement feature developed for the latest 4K
Ultra HD TVs. The OnePlus 8T is Certified for
the new enhanced Mobile HDR10+ that supports Dynamic Metadata and Dynamic
Tone Mapping.
HDR provides expanded Color, Contrast, and Brightness of
video content. In order to provide HDR, the OnePlus 8T has the required Digital
Cinema DCI-P3 Wide Color Gamut, plus perfect Blacks and an Infinite Contrast
Ratio from its OLED display, and a Peak Brightness that is much greater than
the 540 nits that is required for High Dynamic Range. The OnePlus 8T can play
the latest streamed mobile HDR videos.
· Viewing Angle
Performance
While Smartphones are
primarily single viewer devices, the variation in display performance with
viewing angle is still very important because single viewers frequently hold
the display at a variety of viewing angles. The angle is often up to 30
degrees, more if the phone is resting on a table or desk.
While LCDs typically
experience a 55 percent or greater decrease in Brightness at a 30 degree
Viewing Angle, the OLED OnePlus 8T display shows a much smaller 22 percent
decrease in Brightness at 30 degrees. This also applies to multiple
side-by-side viewers as well, and is a significant advantage of OLED displays.
All
displays have Color Shifts with Viewing Angle:
The Color Shift of White, which is the most common
background color is particularly noticeable on many OLED and LCD displays.
The OnePlus 8T has a small
White Shift of just 1.8 JNCD at 30 degrees,
which is unlikely to be noticeable.
The
Color Shifts throughout the entire Color Gamut vary as combinations of the
Primary Color Shifts:
The Color Shifts for the
Red and Green Primaries are both relatively small, with 2.4 JNCD for Red and 1.6 JNCD for Green
at 30 degrees.
The Color Shift for the Blue Primary is larger at 3.9
JNCD at 30 degrees, which is just slightly larger than the 3.5 JNCD
needed for a Very Good
Green rating, and may be noticeable for some color content but not
objectionable.
But as explained in our Absolute Color
Accuracy Display Technology Shoot-Out article, the color accuracy of
the Blue Region covering the entire range from Cyan to Magenta is generally less critical for
visual color accuracy.
While the eye can still
detect color differences and color errors in the Blue Region, for the most part
we are
less likely to notice or
be troubled by color differences and discrepancies with colors in the Blue
Region.
So
a larger Blue Color Shift is less noticeable than the Red and Green Color
Shifts found in many Smartphone displays.
Overall, the OnePlus 8T has close to the Best Viewing Angle Performance that we have ever
measured.
See the Viewing Angles section for the measurements and
details.
· Vision Comfort Night
Mode with Reduced Blue Light for Better Night Viewing
For the
OnePlus 8T the amount of potentially harmful very short wavelength Blue Light
has been significantly reduced while still maintaining the same Wide Color
Gamut. The OnePlus 8T has received the TUV Rheinland
Eye Comfort Certification for Low Blue Light, Reduced Flicker and Reflection.
This has been accomplished with a new Blue OLED with an improved light spectrum
that has a reduced short wavelength component. The Improved Blue Light Spectrum
also works in conjunction with the Vision Comfort
Night Mode...
The Vision Comfort Night Mode on the OnePlus 8T is
designed to change the color balance of the display in order to reduce the
amount of Blue Light produced by the display, which some recent research
indicates can affect how well users sleep afterwards. In a separate article we
explain and analyze the Blue Light issue for displays. The OnePlus 8T includes
a user adjustable Color Temperature slider to vary the amount of Blue light
produced by the display and a timer that allows the Vision Comfort Night Mode
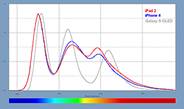
to be turned on and off automatically every day. The measured variation in the
display light spectrum with the adjustable Color Temperature slider is shown in
this Figure
and below.
As the Vision Comfort Night Mode Color Temperature slider setting is moved to the Warmest setting, the amount of Blue light emitted by
the display decreases. When that happens, White and all screen colors take on
an increasing yellowish tint and color cast. At the Middle
setting the measured White Color Temperature decreases to 4,860 K, and at the Warmest
setting it decreases to 3,790 K, the
Color Temperature of traditional incandescent lighting, which is yellowish.
With the Vision Comfort
Night Mode turned On and at its Warmest slider
setting, the Blue Light is reduced by up to 65 percent
together with the Vision Comfort Night Mode Lightness
slider. The measured display spectra for
several of the Vision Comfort Night Mode settings are included in this Figure and
below.
· Super Dim Setting
The OnePlus 8T also has a Super
Dim Setting that allows the Maximum Screen Brightness to be set all the
way down to just 2 cd/m2 (nits)
using the Brightness Slider. This is perfect for night use on a beside table,
and useful for working comfortably without eye strain or bothering others in
very dark environments, or affecting the eye’s dark adaptation, such as when
using a telescope. The display still provides full 24-bit color and the picture
quality remains excellent.
· Dark Mode
A Dark Mode display
setting provides a Dark Tone Theme that inverts the typical White Background
with Black Text to a Black Background with White Text for many Apps. This
significantly reduces the overall Brightness of the entire display for most
applications, and should reduce eye strain when viewing the display in low to
dark ambient light. An additional bonus is that switching to a Black Background
will in most cases significantly reduce the battery power used by the OLED
display.
· Viewing Tests Performance
The Natural mode on the OnePlus 8T provides very nice,
pleasing and Very Accurate Colors and Picture Quality. The very challenging set
of DisplayMate Test and Calibration Photos that we use to evaluate picture
quality looked absolutely stunning and Beautiful,
even to my experienced hyper-critical eyes.
The Absolute Color Accuracy on the
OnePlus 8T Natural mode is 0.5 - 0.6 JNCD, which is Visually Indistinguishable From Perfect, and almost certainly considerably better than your
existing Smartphone, living room HDTV, Tablet, Laptop, and computer monitor, as demonstrated in our
extensive Absolute Color
Accuracy Lab Measurements.
In order to see the OnePlus 8T High Color Accuracy, the Display Setting
needs to be set to the Natural mode, which Automatically Switches to the proper
Gamut for the current on-screen content.
For indoor and low ambient light viewing use the Natural mode for most standard consumer content
including digital camera, TV, internet, and computer content, including photos,
videos, and movies, and also for your online purchases in order to see accurate
product colors, and also for viewing the newest DCI 4K Ultra HD TV and Digital
Cinema content and videos, including HDR content.
The Vivid mode and Advanced AMOLED Wide Gamut mode provide
significantly more Vibrant and Saturated Colors, which some people prefer. They
are recommended for viewing in medium to high levels of ambient light because
it offsets some of the reflected light glare that washes out the image colors,
which is demonstrated in this Figure for
ambient light levels up through 2,000 lux.
· Display Power
Efficiency
Since 2013 the Display Power
Efficiency of OLED Smartphone Displays has improved by a very impressive 65%.
While LCDs remain more power efficient for images with
mostly full screen white content (like all text screens on a white background,
for example), OLEDs are more power efficient for typical mixed image content
because they are emissive displays so their power varies with the Average
Picture Level (average Brightness) of the image content over the entire screen.
For LCDs the display power is fixed and independent of the
image content. But for OLEDs, the display power decreases with the type of
image content. Black pixels and sub-pixels don’t use any power so screens with
Black or dark backgrounds are very power efficient for OLEDs. Photos and videos
also have relatively low Average Picture Levels and so require much less power
on OLEDs than LCDs. Currently, OLED displays are more power efficient than LCDs
for Average Pictures Levels of 70 percent or less, and LCDs are more power
efficient for Average Picture Levels above 70 percent. Since both technologies
are continuing to improve their power efficiencies, the crossover will continue
to change with time. See the Display Power section
for the measurements and details.
OnePlus 8T Conclusions: A Record Setting
Impressive Smartphone Display…
The primary goal of this Display Technology Shoot-Out
article series has always been to publicize and promote display excellence
so that consumers, journalists, reviewers, and even manufacturers are aware of
and appreciate the very best in displays and display technology. We point out
which manufacturers and display technologies are leading and advancing the
state-of-the-art for displays by performing comprehensive and objective
scientific Lab Tests and Measurements together with in-depth analysis. We point
out who is leading, who is behind, who is improving, and sometimes
(unfortunately) who is back pedaling.
All of the DisplayMate Display
Performance Grades, Ratings and Awards are based Entirely on the extensive
objective Lab Tests and Measurements that we also publish, so that everyone can
judge and compare the display performance data for themselves as well.
Comparison of the OnePlus 8T with the OnePlus
8 and OnePlus 8 Pro
The OnePlus 8T is an enhanced version of the OnePlus 8
that includes some display functions and features found on the OnePlus 8
Pro.
· Improved 120 Hz Display Refresh Rate
compared to the 90 Hz Refresh Rate on the OnePlus 8.
· Improved Display Calibration Color
Accuracy and Image Contrast Accuracy.
· Improved High Brightness Mode
Luminance Accuracy.
You can compare their display
performance in detail by using a Tabbed web browser with our DisplayMate
Display Technology Shoot-Out articles for each model.
Summary of the OnePlus 8T Display
Functions, Features, Performance Records and Awards:
The OnePlus 8T has many
state-of-the-art Display Functions, Features, Performance Records and Awards
that are summarized below:
See the Display Performance Functions and Features
section below for a list of the main functions and features.
See the Display Highlights and
Performance Results section above for detailed information, explanations,
and analysis.
See the Display Performance Records section below
that lists the Lab measurement performance records.
See the Display Performance
Assessments section below summarizes the display evaluation details.
See the Best
Smartphone Display Award section below summarizes the DisplayMate Display
Performance Award and Criteria.
See the Display Shoot-Out Lab
Measurements Comparison Table section below for the complete set of
measurements and tests.
The OnePlus 8T has the following
State-of-the-Art Display Performance Functions and Features:
· A State-of-the-Art Full
Screen Flexible OLED display panel from Samsung Display that is
manufactured on a flexible plastic substrate. While the OLED display itself is
flexible, the screen remains rigid under an outer hard cover glass.
· A Full Screen design
with a large 6.55
inch OLED display that fills almost the entire
front face of the OnePlus 8T from edge-to-edge, with a high 92% Screen-to-Body
Ratio, providing a significantly larger
display for the same overall phone size.
· The display
has a very small circular Punch-hole at the very top of the screen for the
front facing selfie camera and sensors. The Camera Punch-hole is just 3.9mm in
diameter, taking up only a tiny 0.1% of the total display
area, a key factor in its high 92% Screen-to-Body Ratio.
· A display form
factor with a taller height to width Aspect
Ratio of 20 : 9 = 2.22, which is 25% larger
than the 16 : 9 = 1.78 on most Smartphones (and widescreen TVs) because
the display now has the same overall shape as the entire phone. It is taller in
Portrait mode and wider in Landscape mode. This provides extra space for
Notifications and for displaying multiple Apps and content simultaneously
on-screen side-by-side.
· A New Higher 120 Hz Display Refresh Rate that improves
image Scrolling and Videos, plus Motion and Gaming Performance in Apps, and may
also reduce Screen Flicker that some people experience.
· A 2K+ High Resolution 2400 x 1080 Full HD+ Display with
402 pixels per inch, and Diamond Pixels with Sub-Pixel Rendering for
enhanced sharpness and higher Peak Brightness.
· The OnePlus
8T display appears Perfectly Sharp for normal 20/20
Vision at Typical Smartphone Viewing Distances of 12 to 18 inches (25 to 46
cm).
· Very Low Screen Reflectance
of 4.3 percent.
· Image Brightness that is
Independent of the on-screen Image Content with only a 2 percent Luminance Shift with Average Picture Level APL.
· A High Brightness Mode with a 100% APL Full Screen Peak Display Brightness of 790 nits, and a Peak Display Brightness of 1,090 nits, which significantly improves screen visibility
in very high Ambient Light, and also provides the high screen Brightness needed
for HDR.
· Each OnePlus 8T display is individually calibrated at the
factory for both Color Accuracy and Contrast Accuracy.
.
· Very High Absolute Color Accuracy
(0.5 - 0.6 JNCD) that is Visually
Indistinguishable From Perfect.
· Very
High Image and Picture Contrast Accuracy and Intensity Scale Accuracy (2.17
Gamma) that is Visually Indistinguishable From Perfect.
· Color Accuracy and Intensity Scales that are Independent
of the Image Content.
· Automatic Color Management that automatically switches to the proper Color Gamut for
any displayed image content that has an ICC Profile within the OLED Wide
Color Space, so images automatically appear with the correct colors, neither
over-saturated or under-saturated.
· 2 Industry Standard Calibrated Color Gamuts: the sRGB / Rec.709 Color
Gamut that is used for most current consumer
content, and the new Wide DCI-P3 Color Gamut that is used in 4K Ultra HD TVs. The DCI-P3 Gamut is
26 percent larger than the sRGB / Rec.709 Gamut.
· 3 Selectable Screen Calibration
modes that provide user control of the color from the Accurate Natural mode to the Vivid and AMOLED Wide Gamut modes.
· A full 100% DCI-P3
Color Gamut with the Natural mode that is also
used for 4K Ultra HD TVs, so the OnePlus 8T can display the latest
high-end 4K video content. The DCI-P3 Gamut is 26 percent larger than the
Rec.709 Gamut that is used in 2K Full HD TVs.
· A large Native Color Gamut with
a very impressive 113% of DCI-P3 and 142% of sRGB / Rec.709 Gamuts that also provides much
better on-screen Colors in High Ambient Light.
· The OnePlus 8T has received the TUV Rheinland Eye Comfort Certification for Low Blue Light,
Reduced Flicker and Reflection.
· A Vision
Comfort Night Mode that allows the
user to adjust and reduce the amount of Blue Light
from the display for better night viewing and improved sleep.
· A Dark Mode setting that
inverts the typical White Background with Black Text to a Black Background with
White Text, which significantly reduces the overall Brightness of the entire
display for most applications, and should reduce eye strain when viewing the
display in low to dark ambient light.
· A High Dynamic Range Mobile HDR10+
Display that allows the OnePlus 8T to play 4K High Dynamic Range content
produced for 4K UHD TVs. The OnePlus 8T has the
new enhanced Mobile HDR10+ that supports Dynamic Metadata and Tone Mapping.
· A User Adjustable White Point with a slider control that can change the color of White
for the Advanced Screen Calibration modes.
· Small Brightness Shifts and
Color Shifts with Viewing Angle,
particularly White, which is the most used
background color.
· Vision Accessibility Display Modes to help people
with vision impairments.
· The OnePlus 8T can
be used with Polarized Sunglasses in both the
Portrait and Landscape orientations unlike LCDs, which generally work in only
one of the two orientations.
The OnePlus
8T sets or matches 11 Smartphone Display Performance Records for:
Measured Numerical Display Performance Differences that
are Visually Indistinguishable are considered Matched and Tied Performance
Records.
· Smallest Shift in Color
Accuracy and Intensity Scale with the Image Content APL (0.3 JNCD) – Visually Indistinguishable From Perfect.
· Highest Absolute Color Accuracy (0.5 JNCD) – Visually Indistinguishable From Perfect.
· Highest Image
Contrast Accuracy and Intensity Scale Accuracy (2.17 Gamma) – Visually Indistinguishable From Perfect.
· Smallest Shift in Image Contrast and
Intensity Scale with the Image Content APL (0.01 Gamma) – Visually Indistinguishable From Perfect.
· Smallest Change in Peak
Luminance with the Image Content Average Picture Level APL (2 percent) –
Visually Indistinguishable From Perfect.
· Highest Full Screen
Brightness for OLED Smartphones (790 nits at 100% Average Picture Level).
· Largest Native Color Gamut (113% DCI-P3 and 142% sRGB /
Rec.709 for the AMOLED Wide Mode).
· Highest Contrast Ratio (Infinite).
· Lowest Screen Reflectance (4.3 percent).
· Highest Contrast Rating in Ambient Light (184 for 100%
Average Picture Level).
· Smallest Brightness Variation with Viewing Angle (22 percent
at 30 degrees).
The OnePlus 8T earns our Highest A+ Display
Rating
OLED has evolved into a highly refined and mature display technology that
now produces the best and highest performance displays for Smartphones.
OLED Display Performance continues to
provide major Record Setting improvements with every new generation.
With consumers now spending rapidly increasing amounts of
time watching content on their Smartphones, the shift in emphasis from
primarily improving Display Hardware Performance to enhancing the overall
display Picture Quality and Color Accuracy is an important step that
DisplayMate Technologies has been pushing for many years in our Display
Technology Shoot-Out article series, so it is great to see
manufacturers improving and then competing on these DisplayMate
Objective Lab Measurement Metrics.
OnePlus has
concentrated on significantly raising the on-screen Absolute
Picture Quality and Absolute Color Accuracy
of the OLED display by implementing Precision Factory
Display Calibration, moving the overall OnePlus
8T Display Performance up to Record Setting
Outstanding Levels with close to Text Book
Perfect Calibration Accuracy that is Visually
Indistinguishable From Perfect.
DisplayMate Display
Performance Ratings:
All of the Results in this article are based Entirely
on our Objective and Extensive DisplayMate Lab Tests and Measurements that are
all listed in a section below.
To
get a DisplayMate
A Display Performance Rating the display must get All Green [Very Good
to Excellent] Ratings for All of the Display Tests and Measurements [except for Color Shifts
at 30 degrees Viewing Angle, which are deemed less important].
And
to get a DisplayMate
A+ Display Performance Rating the Average Absolute Color Accuracy and the Average
Absolute Color Accuracy Shifts with Average Picture Level APL must All
be less than 1.0 JNCD, and the Largest Color Errors must All be less
than 3.0 JNCD.
The OnePlus 8T delivers Uniformly Consistent Top Tier Display Performance and receives All Green
[Very Good to Excellent] Ratings in All
DisplayMate Lab Test Display Performance and Accuracy Categories and
has Absolute Color Accuracy much better than 1.0
JNCD.
As a Result the OnePlus 8T display meets all of the criteria and
requirements for a DisplayMate A+ Grade, earning DisplayMate’s Highest Overall
Display Assessment Rating and Highest Display Performance Grade of A+.
DisplayMate Display Performance Rating and
Best Smartphone Display Award
Based on our extensive Lab Tests and Measurements the OnePlus 8T has a
Very Impressive Excellent Top Tier World Class Smartphone Display
with close to Text Book Perfect Calibration
Accuracy and Performance that is Visually
Indistinguishable From Perfect. Based
on our objective Lab Tests and Measurements the OnePlus
8T receives a DisplayMate Best Smartphone
Display Award earning DisplayMate’s highest ever Display Performance Grade of A+ and setting or
matching 11 Smartphone Display Performance Records
that are listed above.
OnePlus 8T
Joins the Top Tier of Smartphone Displays
The OnePlus 8T joins the very
select Top Tier of Smartphone Displays which all provide Close to Text Book Perfect Calibration Accuracy and
Performance that is Visually Indistinguishable From Perfect, so they all
received and maintain Concurrent DisplayMate Best Smartphone Display Awards. All are Excellent State-of-the-Art Displays, each is
better in some Display Performance Categories, but None are Best in All the
Display Performance Categories. Note that measured numerical display performance
differences that are Visually Indistinguishable are equivalent.
As Display Performance continues
to improve we have and will continue to raise the Performance Levels necessary
to receive a DisplayMate Best Smartphone Display Award and an A+ Display Rating,
so the Top
Tier of Smartphone Displays will continue to evolve and change with each new
display generation, but only the Very Best
Displays will continue to receive A+ Ratings each year.
OLED displays now have tremendous performance advantages
over LCDs, so high-end and flagship Smartphones need OLED displays in order to
compete at state-of-the-art performance levels, securing OLED as the definitive
premier display technology for Top Tier Smartphones in the foreseeable future
over the next 3-5 years. With the continuing improvements in OLED hardware
performance, picture quality, and precision accuracy, it will be much harder
for new display technologies to challenge OLED.
Follow DisplayMate
on Twitter to learn about our upcoming Smartphone display technology
coverage.
See the links below for all of the OnePlus 8T
Measurements, Evaluations, Analysis, and Assessments
Data Tables: See
the Display Shoot-Out Lab Measurements Comparison Table
section below has the complete set of measurements and tests.
Highlights: See
the Display Highlights and Performance Results
section above for detailed information, explanations, and analysis.
Features: See the Display Performance Functions and Features
section above for a list of the main functions and features.
Records: See
the Display Performance Records section above
that lists the Lab measurement performance records.
Assessments: See the Display
Performance Assessments section below summarizes the display evaluation
details.
The Future of OLED Smartphones
OLED has evolved into a highly refined and mature display technology that
now produces the best and highest performance displays for Smartphones.
The OnePlus 8T is the latest in a new generation of OLED Smartphones.
OLEDs have now evolved and emerged as the premium mobile Smartphone display
technology.
LCDs are a great cutting edge high performance display technology for
Tablets to TVs, but for small handheld Smartphones, OLED displays provide a
number of major advantages over LCDs including: being much thinner, much
lighter, without needing a bezel, providing a rimless edge-to-edge design. They
can be made flexible and into curved screens, plus they have a very fast
response time, better viewing angles, and always-on display modes.
Many of the OLED performance advantages result from the fact that every
single sub-pixel in an OLED display is independently directly electrically
powered to emit light, so only the active image sub-pixels draw power based on
their individual brightness levels. OLEDs can also provide better color
accuracy, image contrast accuracy, and screen uniformity because the
irregularities and variations in LCD Backlights introduce color and brightness
irregularities and variations over the screen.
As the result of their very versatile power management capabilities,
OLEDs are not only more power efficient than LCDs for most image content, but
they now deliver much higher peak Brightness than LCDs because the maximum
power can be delivered to just the sub-pixels that are needed for producing the
current displayed image. However, for mostly all white screen content, LCDs are
likely to remain brighter and more power efficient for a while.
OLED displays are also manufactured on flexible substrates that can
bend, which allows the screens to be curved and rounded and provides a number
of innovative new screen geometries.
As a result, OLED displays now have tremendous performance advantages
over LCDs, so high-end and flagship Smartphones need OLED displays in order to
compete at state-of-the-art performance levels, securing OLED as the definitive
premier display technology for Top Tier Smartphones in the foreseeable future
over the next 3-5 years. With the continuing improvements in OLED hardware
performance, picture quality, and precision accuracy, it will be much harder
for new display technologies to challenge OLED.
Follow DisplayMate on Twitter to learn
about these developments and our upcoming display technology coverage.
Improving the
Next Generation of Mobile Displays
The OnePlus 8T has a high
resolution 2K+ 2400x1080 pixel display with Diamond Pixels at 402 pixels per
inch (ppi) producing images that look perfectly sharp with normal 20/20 Vision
under all normal viewing conditions, which always includes some ambient light
that always lowers the visible image contrast and perceived image sharpness
(Modulation Transfer MTF). Note that displays are
almost never viewed in absolute darkness under perfect viewing conditions with
ideal image content. Some clueless reviewers have been pining for 4K
3840x2160 Smartphones, which would require 3 times the pixels, memory, and
processing power of the 2400x1080 display on the OnePlus 8T, but there would be
no visual benefit for humans! As a result, it is absolutely pointless to further increase
the display resolution and pixels per inch (ppi) for a marketing wild goose
chase into the stratosphere, with no visual benefit for humans!
Improving Display Performance
for Real World Ambient Light Viewing Conditions
With screen size and resolution already functionally
maxed out, manufacturers should instead dedicate their efforts and resources
into improving real world display performance in ambient light by using
advanced technology to restore and compensate for the loss of color gamut,
color saturation, and image contrast due to ambient light, something that every
consumer will benefit from, and will also immediately notice and appreciate –
providing a true sales and marketing advantage.
Currently all existing displays
are Color and Contrast Accurate only when they are viewed in Absolute Darkness
0 lux.
The most important improvements for OLED and LCD displays
will come from improving their image and picture quality and screen readability
in Real World Ambient Light, which washes out
the screen images, resulting in Reduced Image Contrast,
Reduced Color Saturation, and Reduce Color Accuracy. The key will be in lowering
the Screen Reflectance and implementing Dynamic Color Management with automatic real-time
modification of the display’s native Color Gamut and Dynamic
Intensity Scales based on the measured Ambient Light level in order to
have them compensate for the reflected light glare and image wash out that
causes a loss of color saturation and image contrast from ambient light as
discussed in our Innovative
Displays and Display Technology and SID
Display Technology Shoot-Out articles.
Currently all existing displays
deal with increasing Ambient Light by simply increasing the display’s own
Brightness - a brute force method that does very little to improve the washed
out Colors and Image Contrast, but it significantly increases Display Power,
which then reduces the Running Time on Battery. A
major bonus for using Dynamic Color Management and Dynamic Intensity Scales is
that it significantly reduces Display Power, which then increases the Running
Time on Battery,
another major sales and marketing advantage for this new high tech approach.
The displays, technologies, and
manufacturers that succeed in implementing this new real world high ambient
light performance strategy will take the lead in the next generations of mobile
displays… Follow DisplayMate
on Twitter to learn about these developments and our upcoming display
technology coverage.
DisplayMate Display Optimization Technology
All
Smartphone, Tablet, Monitor and TV displays can be significantly improved using
DisplayMate’s proprietary very advanced scientific analysis and mathematical
display modeling and optimization of the display hardware, factory calibration,
and driver parameters. We help manufacturers with expert display procurement,
prototype development, display performance improvement and optimization,
testing displays to meet contract specifications, and production quality
control so that they don’t make mistakes similar to those that are exposed in
our public Display Technology Shoot-Out series for consumers. This article is a
lite version of our advanced scientific analysis – before the benefits of our DisplayMate Display Optimization
Technology, which can correct or improve all of these issues. If you are a
display or product manufacturer and want to significantly improve display
performance for a competitive advantage then Contact DisplayMate Technologies.

|
OnePlus 8T
|
Display Shoot-Out Lab Measurements
Comparison Table
Below we
examine in-depth the OLED display performance of the OnePlus
8T based on objective Lab measurement
data
and
criteria in the following sections: Display
Specifications, Overall Assessments, Screen Reflections, Brightness
and Contrast,
Colors and Intensities, Absolute Color Accuracy, Viewing Angles, OLED
Spectra, Display Power.
For
comparisons with the other leading Smartphone displays see our Mobile Display Technology
Shoot-Out series.
|
Categories
|
OnePlus
8T
|
Comments
|
|
Display Technology
|
Flexible
OLED Display
with Diamond Pixels
6.55 inch
Diagonal / 16.6 cm Diagonal
Excluding the Rounded
Corners
|
Flexible Organic Light Emitting Diode
Diamond Pixels with Diagonal Sub-Pixel Symmetry.
|
|
Screen Aspect Ratio
|
20: 9 =
2.22
New Higher
Aspect Ratio
Most Smartphones
and Widescreen TVs have 16 : 9 = 1.78
|
Height to Width Aspect Ratio
OnePlus 8T display screen is 25% longer
than
most Smartphones and widescreen 16:9 TV
content.
|
|
Screen Size
|
2.69
x 5.97 inches
6.82 x
15.16 cm
|
Display Width and Height in inches and
cm.
|
|
Screen Area
|
16.0
square inches / 103.4 square cm
After
Subtracting the Camera Opening but not the Rounded Corners
|
A better measure of size than the
Diagonal.
|
|
Screen–to–Body
Ratio
|
92%
|
Area of the Screen compared to the
Phone.
|
|
Supported Color Gamuts
|
Vivid mode – Wide Color Gamut with Higher Contrast
Natural
DCI-P3 mode – DCI-P3 Standard Color Gamut
Natural sRGB mode – sRGB / Rec.709 Standard Color Gamut
Advanced
AMOLED Wide mode – Native OLED Color Gamut with Higher Contrast
|
The OnePlus 8T supports 2 Standard
Color Gamuts: sRGB and the new wider
DCI-P3
Color Gamut that is used in 4K Ultra HD
TV content.
|
|
Display Refresh Rates
|
Display
Refresh Frames Per Second
Normal 60
Hz Refresh
High 120 Hz
Refresh for Smoother Scrolling and Motion
|
Higher Refresh Rates improve image
Scrolling
plus Video and Motion Performance in
Apps,
and may reduce Screen Flicker that some
people experience.
|
|
Display Resolution
|
2400 x 1080
pixels
2K+ FHD+
|
Screen Pixel Resolution.
|
|
Total Number of Pixels
|
2.6 Mega
Pixels
|
Total Number of Display Pixels.
|
|
Pixels Per Inch PPI
|
402 PPI
with Diamond Pixels
Very Good
|
Sharpness depends on the viewing distance
and PPI.
See this on
the visual acuity for a true Retina Display
|
|
Sub-Pixels Per Inch SPPI
|
Red
284 SPPI
Green
402 SPPI
Blue
284 SPPI
|
Diamond Pixel displays have only half the
number of
Red and Blue Sub-Pixels as RGB Stripe displays.
At High PPI this is generally not visible
due to
the use of Sub-Pixel Rendering.
|
|
Total Number of Sub-Pixels
|
Red
1.3 Million Sub-Pixels
Green 2.6
Million Sub-Pixels
Blue
1.3 Million Sub-Pixels
|
Diamond Pixel displays have only half the
number of
Red and Blue Sub-Pixels as RGB Stripe
displays.
At High PPI this is generally not visible
due to
the use of Sub-Pixel Rendering.
|
|
20/20 Vision Distance
where Pixels or Sub-Pixels
are Not Resolved
|
8.6 inches / 21.7 cm for White and Green Sub-Pixels with 20/20 Vision
12.1
inches / 30.7 cm for Red and Blue Sub-Pixels with 20/20 Vision
|
For 20/20 Vision the minimum Viewing
Distance
where the screen appears perfectly sharp
to the eye.
At 12 inches from the screen 20/20 Vision
is 344 PPI.
|
|
Display Sharpness
at Typical Viewing Distances
|
OnePlus 8T
Display appears Perfectly Sharp
Pixels are
not Resolved with 20/20 Vision
at Typical
Viewing Distances of
12 to
18 inches
30 to 46
cm
|
The Typical Viewing Distances for this
screen size
are in the range of 12 to 18 inches or
30 to 46 cm.
Also note that eye’s resolution is much
lower for
Red and Blue color content than White
and Green.
|
|
Appears Perfectly Sharp
at Typical Viewing Distances
|
Yes
|
Typical Viewing Distances are 12 to 18
inches
or 30 to 46 cm for this screen size.
|
|
Overall Display Performance Assessments
This section summarizes
the results for all of the extensive Lab Measurements and Viewing Tests
performed on the display.
See Screen Reflections, Brightness
and Contrast, Colors and Intensities,
Absolute Color Accuracy, Viewing Angles, OLED Spectra
Here
we provide results for the Vivid mode, which has a Wide Color Gamut and Higher Image Contrast,
the
Natural DCI-P3 mode, which is calibrated for the new DCI-P3 Gamut that is used
in 4K Ultra HD TVs,
and
the Natural sRGB mode, which is calibrated for the sRGB / Rec.709 Gamut that is used for most current
consumer photo, video,
web, and computer content.
|
Categories
|
Vivid
mode
Wide Color
Gamut
|
Natural
mode
DCI-P3
Content
|
Natural
mode
sRGB
Content
|
Comments
|
|
Viewing Tests
in Subdued Ambient Lighting
|
Very Good
Images
Photos and
Videos
have Vivid
Color
and Higher
Contrast
Intentionally
Vivid Colors
|
Excellent
Images
Photos and
Videos
have
Excellent Color
and
Accurate Contrast
Accurate
DCI-P3 Content
|
Excellent
Images
Photos and
Videos
have
Excellent Color
and
Accurate Contrast
Accurate
sRGB Content
|
The Viewing Tests examine the accuracy
of
photographic images by comparing the
displays
to a calibrated studio monitor and TV.
|
|
Variation with Viewing Angle
Colors and Brightness
See Viewing Angles
|
Color
Shifts
Small to
Medium
with
Viewing Angle
Small
Brightness Shifts
with
Viewing Angle
|
Color
Shifts
Small to
Medium
with
Viewing Angle
Small
Brightness Shifts
with
Viewing Angle
|
Color
Shifts
Small to Medium
with
Viewing Angle
Small
Brightness Shifts
with
Viewing Angle
|
The OnePlus 8T display has a relatively
small
decrease in Brightness with Viewing
Angle and
relatively small Color Shifts with
Viewing Angle.
See the Viewing Angles section for details.
|
|
Overall Display Assessment
Lab Tests and Measurements
|
Excellent
OLED Display
Vivid Color
Mode
|
Excellent
OLED Display
Accurate
DCI-P3 Content
|
Excellent
OLED Display
Accurate
sRGB Content
|
The OnePlus 8T OLED Display performed
very well in the Lab Tests and
Measurements.
|
|
|
|
Absolute Color Accuracy
Measured over Entire Gamut
See Figure 2 and Colors
|
Good Color
Accuracy
Colors
More Saturated
Intentionally
Vivid Colors
|
Excellent
Color Accuracy
Color
Errors are Very Small
Accurate
DCI-P3 Content
|
Excellent
Color Accuracy
Color
Errors are Very Small
Accurate
sRGB Content
|
Absolute
Color Accuracy is measured with a
Spectroradiometer
for 41
Reference Colors
uniformly
distributed within the entire Color Gamut.
See
Figure 2 and Colors for details.
|
|
Image Contrast Accuracy
See Figure 3 and Contrast
|
Very Good
Accuracy
Image
Contrast
Intentionally
Higher
|
Excellent
Accuracy
Image
Contrast
Very
Accurate
|
Excellent
Accuracy
Image
Contrast
Very
Accurate
|
The
Image Contrast Accuracy is determined by
measuring
the Log Intensity Scale and Gamma.
See
Figure 3 and Contrast for details.
|
|
Performance in Ambient Light
Display Brightness
Screen Reflectance
Contrast Rating
See Brightness and Contrast
See Screen Reflections
|
High
Display Brightness
Very Low
Reflectance
High
Contrast Rating
for
Ambient Light
Higher Brightness
with
Auto
Brightness On
|
High
Display Brightness
Very Low
Reflectance
High
Contrast Rating
for
Ambient Light
Higher
Brightness with
Auto
Brightness On
|
High
Display Brightness
Very Low
Reflectance
High
Contrast Rating
for
Ambient Light
Higher Brightness
with
Auto
Brightness On
|
Smartphones
are seldom used in the dark.
Screen
Brightness and Reflectance determine
the
Contrast Rating for High Ambient Light.
See
the Brightness and Contrast section for details.
See
the Screen Reflections section for details.
|
|
Overall Display Calibration
Image and Picture Quality
Lab Tests and Viewing Tests
|
Wide Color
Gamut Mode
Intentionally
Vivid Colors
and Higher
Image Contrast
|
Excellent Calibration
Accurate
DCI-P3 Content
|
Excellent Calibration
Accurate
sRGB Content
|
OnePlus 8T display has Natural and
Natural Modes
that deliver accurately calibrated
colors and images
and a Vivid Color Mode that is preferred
by
some users and for some applications.
|
|
|
Overall Display Grade
Overall
Assessment
|
Overall OnePlus 8T Display
Grade is Excellent A+
DisplayMate Best
Smartphone Display Award
with 11 Smartphone
Display Performance Records
An Excellent Top Tier
World Class Smartphone Display
|
The OnePlus 8T display delivers Excellent
Image Quality, has both Natural sRGB and
Natural DCI-P3 modes and a Vivid Mode
with
a Wide Color Gamut, has High Screen
Brightness
and low Reflectance, has good Viewing
Angles, and
is an all around Top Performing
Smartphone Display.
|
|
Vivid Color
Mode
Also Best
for Viewing in
High
Ambient Light
|
Accurate
DCI-P3 Content
For Viewing
4K UHD TV
DCI-P3
Cinema Content
|
Accurate
sRGB mode
For Viewing
Most Content
Photo Video
Movie Web
|
Categories
|
Vivid
mode
Wide Color
Gamut
|
Natural
mode
DCI-P3
Content
|
Natural
mode
sRGB
Content
|
Comments
|
|
The OnePlus
8T sets or matches 11 Smartphone Display Performance Records for:
Measured Numerical Display Performance Differences that
are Visually Indistinguishable are considered Matched and Tied Performance
Records.
·
Smallest Shift
in Color Accuracy and Intensity Scale with the Image Content APL (0.3
JNCD) – Visually Indistinguishable From Perfect.
· Highest Absolute Color Accuracy (0.5 JNCD) – Visually Indistinguishable From Perfect.
· Highest Image Contrast Accuracy and
Intensity Scale Accuracy (2.17 Gamma) – Visually Indistinguishable From Perfect.
·
Smallest Shift in Image Contrast and
Intensity Scale with the Image Content APL (0.01 Gamma) – Visually Indistinguishable From Perfect.
·
Smallest Change
in Peak Luminance with the Image Content Average Picture Level APL (2
percent) – Visually Indistinguishable From Perfect.
·
Highest Full
Screen Brightness for OLED Smartphones (790 nits at 100% Average Picture
Level).
· Largest Native Color Gamut (113% DCI-P3 and 142% sRGB
/ Rec.709 for the AMOLED Wide Mode).
· Highest Contrast Ratio (Infinite).
· Lowest Screen Reflectance (4.3 percent).
· Highest Contrast Rating in Ambient Light (184 for
100% Average Picture Level).
· Smallest Brightness Variation with Viewing Angle (22
percent at 30 degrees).
|
|
Screen Reflections
All display screens are mirrors good enough to use
for personal grooming – but that is actually a very bad feature…
We measured the light reflected from all directions
and also direct mirror (specular) reflections, which are much more
distracting and cause more eye strain. Many
Smartphones still have greater than 10 percent reflections that make
the screen much harder to read even in moderate
ambient light levels, requiring ever higher brightness settings that
waste precious battery power. Manufacturers should
reduce the mirror reflections with anti-reflection coatings and
matte or haze surface finishes.
Our Lab Measurements include Average
Reflectance for Ambient Light from All Directions and for Mirror Reflections.
We use an Integrating
Hemisphere and a highly collimated pencil light beam together with a
Spectroradiometer.
Note that the Screen
Reflectance is exactly the same for all of the OnePlus 8T Screen Modes.
The OnePlus 8T has the lowest Screen
Reflectance level that we have ever measured for a Smartphone.
These results are extremely important
for screen readability, picture quality, and color accuracy in ambient light.
|
Categories
|
OnePlus
8T
|
Comments
|
|
Average Screen Reflection
Light From All Directions
|
4.3 percent
for Ambient
Light Reflections
Excellent
|
Measured using an Integrating Hemisphere
and
a Spectroradiometer.
The lowest value we have ever measured
for a Smartphone is 4.3 percent.
|
|
Mirror Reflections
Percentage of Light Reflected
|
5.3
percent
for Mirror Reflections
Very Good
|
These are the most annoying types of
Reflections.
Measured using a Spectroradiometer and a
narrow
collimated pencil beam of light
reflected off the screen.
The lowest value we have ever measured
for a Smartphone is 5.3 percent.
|
|
Brightness and Contrast
The Contrast Ratio
is the specification that gets the most attention, but it only applies for
low ambient light, which is seldom
the case for mobile displays.
Much more important is the Contrast
Rating for High Ambient Light, which indicates how easy it is to read
the screen under
high ambient lighting and depends on both
the Maximum Brightness and the Screen Reflectance. The larger the better.
The display’s actual on-screen Contrast Ratio changes with the Ambient Light lux
level and is proportional to the Contrast Rating.
|
Categories
|
Vivid
mode
Wide Color
Gamut
|
Natural
mode
DCI-P3
Content
|
Natural
mode
sRGB
Content
|
Comments
|
|
Home Screen Peak Brightness
Measured for White
|
Brightness
598 cd/m2
Excellent
|
Brightness
495 cd/m2
Very Good
|
Brightness
495 cd/m2
Very Good
|
The Peak Brightness for White on the
Home Screen.
|
|
Measured Average Brightness
50% Average Picture Level
|
Brightness
542 cd/m2
Excellent
|
Brightness
486 cd/m2
Very Good
|
Brightness
487 cd/m2
Very Good
|
This is the Brightness for typical
screen content
that has a 50% Average Picture Level.
|
|
Measured Full Brightness
100% Full Screen White
|
Brightness
493 cd/m2
Excellent
|
Brightness
491 cd/m2
Very Good
|
Brightness
492 cd/m2
Very Good
|
This is the Brightness for a screen that
is entirely
all white with 100% Average Picture
Level.
|
|
Measured Peak Brightness
1% Average Picture Level
|
Brightness
620 cd/m2
Excellent
|
Brightness
479 cd/m2
Very Good
|
Brightness
482 cd/m2
Very Good
|
This is the Peak Brightness for a screen
that
has only a tiny 1% Average Picture Level.
|
|
Dynamic Brightness
Change in Luminance with
Average Picture Level APL
|
20 percent
Decrease
Intentionally
Large
|
2 percent
Decrease
Excellent
|
2 percent
Decrease
Excellent
|
This is the percent Brightness decrease
with APL
Average Picture Level. Ideally should be
0 percent.
|
|
Low Ambient Light
|
|
Lowest Peak Brightness
Super Dimming Mode
Brightness Slider to Minimum
|
2 cd/m2
For Very
Low Light
|
2 cd/m2
For Very
Low Light
|
2 cd/m2
For Very
Low Light
|
This is the Lowest Brightness with the
Slider set to
Minimum. This is useful for working in
very dark
environments. Picture Quality remains
Excellent.
|
|
Black Brightness at 0 lux
at Maximum Brightness Setting
|
0 cd/m2
Outstanding
|
0 cd/m2
Outstanding
|
0 cd/m2
Outstanding
|
Black Brightness is important for Low
Ambient Light,
which is seldom the case for mobile
devices.
|
|
Contrast Ratio at 0 lux
Relevant for Low Ambient Light
|
Infinite
Outstanding
|
Infinite
Outstanding
|
Infinite
Outstanding
|
Only relevant for Low Ambient Light,
which is seldom the case for mobile
devices.
|
|
High Brightness Mode
Automatic Brightness in High Ambient
Light
|
|
Measured High Brightness Mode
50% Average Picture Level
|
High
Brightness Mode
894 cd/m2
Excellent
|
High
Brightness Mode
779 cd/m2
Excellent
|
High
Brightness Mode
777 cd/m2
Excellent
|
This is the Brightness for typical
screen content
that has a 50% Average Picture Level.
|
|
Measured High Brightness Mode
100% Full screen White
|
High
Brightness Mode
790 cd/m2
Excellent
|
High
Brightness Mode
784 cd/m2
Excellent
|
High
Brightness Mode
783 cd/m2
Excellent
|
This is the Brightness for a screen that
is entirely
all white with 100% Average Picture
Level.
|
|
Measured High Brightness Mode
1% Average Picture Level
|
High
Brightness Mode
1,090 cd/m2
Excellent
|
High
Brightness Mode
767 cd/m2
Excellent
|
High
Brightness Mode
767 cd/m2
Excellent
|
This is the Peak Brightness for a screen
that
has only a small 1% Average Picture
Level.
|
|
Dynamic Brightness
Change in Luminance with
Average Picture Level APL
|
28 percent
Decrease
Intentionally
Large
|
2 percent
Decrease
Excellent
|
2 percent Decrease
Excellent
|
This is the percent Brightness decrease
with APL
Average Picture Level. Ideally should be
0 percent.
|
|
High Ambient Light Contrast Rating
|
|
Contrast Rating
for High Ambient Light
The Higher the Better
for Screen Readability
in High Ambient Light
|
115 – 144
With Manual
Brightness
Very Good
184 – 253
High
Brightness Mode
Excellent
|
111 – 114
With Manual
Brightness
Very Good
178 – 182
High
Brightness Mode
Excellent
|
112 – 114
With Manual
Brightness
Very Good
178 182
High
Brightness Mode
Excellent
|
Depends on the Screen Reflectance and
Brightness.
Defined as Maximum Brightness / Average Reflectance.
The display’s actual on-screen Contrast
Ratio
changes with the Ambient Light lux level
and
is proportional to the Contrast Rating.
|
|
Screen Readability
in High Ambient Light
|
Very Good A
With Manual
Brightness
Excellent A+
With Auto
Brightness On
|
Very Good A
With Manual
Brightness
Excellent A+
With Auto
Brightness On
|
Very Good A
With Manual
Brightness
Excellent A+
With Auto
Brightness On
|
Indicates how easy it is to read the
screen
under High Ambient Lighting. Depends on
both the Screen Reflectance and
Brightness.
See High
Ambient Light Screen Shots
|
|
Colors and Intensities
The Color Gamut, Intensity Scale, and White
Point determine the quality and accuracy of all displayed images and
all
the image colors. Bigger is definitely Not Better
because the display needs to match all the Standards that were used
when the content was produced.
The OnePlus 8T also has an AMOLED
Wide Advanced Mode with the Native Color
Gamut of the OLED Display,
which is 113% of the DCI-P3 Gamut and 142% of the
sRGB Gamut.
|
Categories
|
Vivid
mode
Wide Color
Gamut
|
Natural
mode
DCI-P3
Content
|
Natural
mode
sRGB
Content
|
Comments
|
|
Color of White
Color Temperature in degrees
Measured in the dark at 0 lux
See Figure 1
|
7,060 K
2.1 JNCD
from D65 White
Intentionally
Bluish Mode
|
6,570 K
0.2 JNCD
from D65 White
Very Close
to Standard
Accurate
DCI-P3 Content
See Figure 1
|
6,570 K
0.2 JNCD
from D65 White
Very Close
to Standard
Accurate
sRGB Content
See Figure 1
|
D65 with 6,500 K is the standard color
of White
for most Consumer Content and needed for
accurate color reproduction of all
images.
JNCD is a Just Noticeable Color Difference.
White Point accuracy is more critical than
other colors.
See Figure 1
for the plotted White Points.
See Figure 2 for the
definition of JNCD.
|
|
Color Gamut
Measured in the dark at 0 lux
See Figure 1
|
100
percent
DCI-P3
Cinema Gamut
Intentionally
Vivid Colors
Wide Color
Gamut Mode
125percent
sRGB /
Rec.709 Gamut
Intentionally
Vivid Colors
Wide Color
Gamut Mode
See Figure 1
|
100
percent
DCI-P3
Cinema Gamut
Very Close
to Standard
Accurate
DCI-P3 Content
See Figure 1
|
102percent
sRGB /
Rec.709 Gamut
Very Close
to Standard
Accurate
sRGB Content
See Figure 1
|
Most current consumer content uses sRGB /
Rec.709.
The new 4K UHD TVs and Digital Cinema use
DCI-P3.
A Wide Color Gamut is useful in High
Ambient Light
and for some applications. It can be used
with Color
Management to dynamically change the
Gamut.
See Figure 1
|
|
Absolute Color Accuracy
|
|
Absolute Color Accuracy
Average Color Error at 0 lux
For 41 Reference Colors
Just Noticeable Color Difference
See Figure 2
|
Average Color Error
From sRGB
/ Rec.709
Δ(u’v’)
= 0.0189
4.7 JNCD
Intentionally
Vivid Colors
Wide Color
Gamut Mode
See Figure 2
|
Average Color Error
From
DCI-P3
Δ(u’v’)
= 0.0020
0.5 JNCD
Excellent
Accuracy
Accurate
DCI-P3 Content
See Figure 2
|
Average Color Error
From sRGB
/ Rec.709
Δ(u’v’)
= 0.0024
0.6 JNCD
Excellent
Accuracy
Accurate
sRGB Content
See Figure 2
|
JNCD is a Just Noticeable Color Difference.
See Figure 2 for the
definition of JNCD and for the
Accuracy Plots showing
the measured Color Errors.
Color Errors below 3.5 JNCD are Very
Good.
Color Errors 3.5 to 7.0 JNCD are
Good.
Color Errors above 7.0 JNCD are
Poor.
|
|
Absolute Color Accuracy
Largest Color Error at 0 lux
For 41 Reference Colors
Just Noticeable Color Difference
See Figure 2
|
Largest Color Error
From sRGB
/ Rec.709
Δ(u’v’)
= 0.0455
11.4 JNCD
for 75% Red
Intentionally
Vivid Colors
Wide Color
Gamut Mode
See Figure 2
|
Largest Color Error
From
DCI-P3
Δ(u’v’)
= 0.0038
0.9 JNCD
for 75% Red
Excellent
Accuracy
Accurate
DCI-P3 Content
See Figure 2
|
Largest Color Error
From sRGB
/ Rec.709
Δ(u’v’)
= 0.0047
1.2 JNCD
for 75% Red
Excellent
Accuracy
Accurate
sRGB Content
See Figure 2
|
JNCD is a Just Noticeable Color Difference.
See Figure 2 for the
definition of JNCD and for the
Accuracy Plots showing
the measured Color Errors.
Color Errors below 3.5 JNCD are Very
Good.
Color Errors 3.5 to 7.0 JNCD are
Good.
Color Errors above 7.0 JNCD are
Poor.
|
|
Changes in Absolute Color Accuracy with Average Picture Level APL
Measured Shifts in the Absolute Color Accuracy with Image Content
from Low 1% APL to High 50% APL
|
|
Shift in the Color of White
Just Noticeable Color Difference
See Figure 4
|
White Point
Color Shift
from Low
to High APL
Δ(u’v’)
= 0.0016
0.4 JNCD
Excellent
|
White Point
Color Shift
from Low
to High APL
Δ(u’v’)
= 0.0016
0.4 JNCD
Excellent
See Figure 4
|
White Point
Color Shift
from Low
to High APL
Δ(u’v’)
= 0.0020
0.5 JNCD
Excellent
See Figure 4
|
JNCD is a Just Noticeable Color Difference
See Figure 2 for the
definition of JNCD.
See Figure 4 for the
measured Color Shifts.
Color Shifts below 3.5 JNCD are Very
Good.
Color Shifts 3.5 to 7.0 JNCD are
Good.
Color Shifts above 7.0 JNCD are
Poor.
|
|
Average Color Shift
For 41 Reference Colors
Just Noticeable Color Difference
See Figure 4
|
Vivid mode
Intentionally
Variable
|
Average
Color Shift
from Low
to High APL
Δ(u’v’)
= 0.0013
0.3 JNCD
Excellent
See Figure 4
|
Average
Color Shift
from Low
to High APL
Δ(u’v’)
= 0.0015
0.4 JNCD
Excellent
See Figure 4
|
JNCD is a Just Noticeable Color Difference.
See Figure 2 for the
definition of JNCD.
See Figure 4 for the
measured Color Shifts.
Color Shifts below 3.5 JNCD are Very
Good.
Color Shifts 3.5 to 7.0 JNCD are
Good.
Color Shifts above 7.0 JNCD are
Poor.
|
|
Largest Color Shift
For 41 Reference Colors
Just Noticeable Color Difference
See Figure 4
|
Vivid mode
Intentionally
Variable
|
Largest Color Shift
from Low
to High APL
Δ(u’v’)
= 0.0024
0.6 JNCD
for 75%
Cyan-Blue
Excellent
See Figure 4
|
Largest Color Shift
from Low
to High APL
Δ(u’v’)
= 0.0022
0.5 JNCD
for 100%
Cyan-Blue
Excellent
See Figure 4
|
JNCD is a Just Noticeable Color Difference
See Figure 2 for the
definition of JNCD.
See Figure 4 for the
measured Color Shifts.
Color Shifts below 3.5 JNCD are Very
Good.
Color Shifts 3.5 to 7.0 JNCD are
Good.
Color Shifts above 7.0 JNCD are
Poor.
|
|
|
|
Dynamic Brightness
Change in Luminance with
Average Picture Level APL
|
20 percent
Decrease
Intentionally
Large
|
2 percent
Decrease
Excellent
|
2 percent
Decrease
Excellent
|
This is the percent Brightness decrease
with APL
Average Picture Level. Ideally should be
0 percent.
|
|
Intensity Scale and
Image Contrast
See Figure 3
|
Smooth and
Straight
Very Good
Slightly
Too Steep
See Figure 3
|
Very
Smooth and Straight
Excellent
Very
Accurate
See Figure 3
|
Very
Smooth and Straight
Excellent
Very
Accurate
See Figure 3
|
The Intensity Scale controls image
contrast needed
for accurate Image Contrast and Color
reproduction.
See Figure 3
|
|
Gamma for the Intensity Scale
Larger has more Image Contrast
See Figure 3
|
2.46
Very Good
Gamma
Intentionally High
|
2.17
Excellent
Gamma Very
Accurate
|
2.17
Excellent
Gamma Very
Accurate
|
Gamma is the log slope of the Intensity
Scale.
Gamma of 2.20 is the standard and needed
for
accurate Image Contrast and Color
reproduction.
See Figure 3
|
|
Image Contrast Accuracy
|
Very Good
|
Excellent
|
Excellent
|
See Figure 3
|
|
Viewing Angles
The variation of Brightness,
Contrast, and Color with Viewing Angle is especially important for
Smartphones because
of their larger screen
and multiple viewers. The typical manufacturer 176+ degree specification for
LCD Viewing Angle
is nonsense because that
is where the Contrast Ratio falls to a miniscule 10. For most LCDs there are
substantial
degradations at less
than ±30 degrees, which is not an atypical Viewing Angle for Smartphones and
Tablets.
The
Viewing Angle variations are essentially identical for all of the OnePlus 8T
Screen Modes.
Note
that the Viewing Angle performance is also very important for a single viewer
because the Viewing Angle can vary
significantly
based on how the Smartphone is held. The Viewing Angle can be very large if
resting on a table or desk.
The OnePlus 8T display has a
Brightness (Luminance) fall off with Viewing Angle that is much smaller than
the best LCD displays.
Color Shifts:
The White Point Color Shift is
the most viewer noticeable Color Shift with Viewing Angle because it is often
the screen background.
The OnePlus 8T has a very small White Shift of just 1.8 JNCD at 30 degrees, which is unlikely to be
noticeable.
The Color Shifts
throughout the entire Color Gamut vary as combinations of the Primary Color
Shifts. The Color Shifts for
the Red and Green
Primaries are both relatively small, with 2.4 JNCD
for Red and 1.6 JNCD for Green at 30 degrees.
The
Color Shift for the Blue Primary is larger at 3.9 JNCD at 30 degrees,
which is just slightly larger than the 3.5 JNCD
needed for a Very Good
Green rating, and may be noticeable for some color content but not
objectionable.
But as explained in our Absolute
Color Accuracy Display Technology Shoot-Out article, the color accuracy
of
the Blue Region covering the entire range from Cyan to Magenta is generally less critical for
visual color accuracy.
While the eye can still
detect color differences and color errors in the Blue Region, for the most
part we are
less likely to notice or
be troubled by color differences and discrepancies with colors in the Blue
Region.
So
a larger Blue Color Shift is less noticeable than the Red and Green Color
Shifts found in many Smartphone displays.
Overall,
the OnePlus 8T has close to the Best Viewing Angle Performance
that we have ever measured.
|
Categories
|
Vivid
mode
Wide Color
Gamut
|
Natural
mode
DCI-P3
Content
|
Natural
mode
sRGB
Content
|
Comments
|
|
Brightness Decrease
at a 30 degree Viewing Angle
|
22 percent
Decrease
Small
Decrease
Very Good
|
Most screens become less bright when
tilted.
LCD decrease is generally greater than 50
percent.
|
|
Contrast Ratio at 0 lux
at a 30 degree Viewing Angle
|
Infinite
Contrast Ratio
Outstanding
|
A measure of screen readability when the
screen
is tilted under low ambient lighting.
|
|
White Point Color Shift
at a 30 degree Viewing Angle
|
Small Color
Shift
Δ(u’v’)
= 0.0071
1.8 JNCD
Excellent
|
JNCD is a Just Noticeable Color Difference.
See Figure 2 for the
definition of JNCD.
Color Shifts below 3.5 JNCD are Very
Good.
|
|
Color Shifts for the Primaries
|
|
Red Primary Color Shift
at a 30 degree Viewing Angle
|
Small Color
Shift
Δ(u’v’)
= 0.0097
2.4 JNCD
Very Good
|
JNCD is a Just Noticeable Color Difference.
See Figure 2 for the
definition of JNCD.
Color Shifts below 3.5 JNCD are Very
Good.
|
|
Green Primary Color Shift
at a 30 degree Viewing Angle
|
Small Color
Shift
Δ(u’v’)
= 0.0064
1.6 JNCD
Excellent
|
JNCD is a Just Noticeable Color Difference.
See Figure 2 for the
definition of JNCD.
Color Shifts below 3.5 JNCD are Very
Good.
|
|
Blue Primary Color Shift
at a 30 degree Viewing Angle
|
Medium
Color Shift
Δ(u’v’)
= 0.0157
3.9 JNCD
Good
|
JNCD is a Just Noticeable Color Difference.
See Figure 2 for the
definition of JNCD.
Color Shifts 3.5 to 7.0 JNCD are
Good.
|
|
|
|
Color Shifts for Color Mixtures
at a 30 degree Viewing Angle
Reference Brown (255, 128, 0)
|
Small
Color Shift
Δ(u’v’)
= 0.0041
1.0 JNCD Excellent
|
JNCD is a Just Noticeable Color Difference.
Color Shifts for non-IPS LCDs are about 10
JNCD.
Reference Brown is a good indicator of
color shifts
with angle because of unequal drive
levels and
roughly equal luminance contributions
from Red
and Green. See Figure 2 for the
definition of JNCD.
|
|
Display Spectra
The Display Spectra for the Vivid and Natural Modes and for the Vision Comfort Night
Mode are
measured in Figure 5 below.
The Vision Comfort Night Mode is designed to change
the color balance of the display in order to reduce the amount of Blue Light
produced by the display,
which some recent research indicates can affect how well users sleep
afterwards.
Display Power Consumption
The display power was measured using a Linear
Regression between Luminance and AC Power with a fully charged battery.
All the measurements were performed in
the AMOLED Wide Mode set for FHD+ (2400x1080) Resolution and 120 Hz Refresh
rate.
Comparison with LCDs
While LCDs remain more power efficient for images with
mostly full screen white content (like all text screens on a
white background, for example), OLEDs are more power
efficient for typical mixed image content because they are
emissive displays so their power varies with the
Average Picture Level (average Brightness) of the image content over
the entire screen. For OLEDs, Black pixels and
sub-pixels don’t use any power so screens with Black backgrounds are
very power efficient for OLEDs. For LCDs the display
power is fixed and independent of image content.
For OLEDs the Display Power
depends on the Picture Content.
An entirely Black OLED Screen uses 0 watts of Display
Power.
Currently, OLED displays are
more power efficient than LCDs for Average Pictures Levels of 70 percent or
less, and
LCDs are more power efficient
for Average Picture Levels above 70 percent.
Since both technologies are continuing to improve their
power efficiencies, the crossover will continue to change with time.
|
Categories
|
OnePlus
8T
AMOLED
Wide Mode
120 Hz
Refresh Rate
|
Comments
|
|
Average Display Power
Maximum Brightness at
50% Average Picture
Level
|
50%
Average Picture Level
1.70
watts
with 554
cd/m2
16.0
inch2 Screen Area
|
This measures the Average Display
Power for
a wide range of image content.
|
|
Maximum Display Power
Full White Screen
at Maximum Brightness
|
Maximum
Power
Full
Screen White
3.00
watts
with 498
cd/m2
16.0 inch2
Screen Area
|
This measures the Maximum Display
power for
a screen that is entirely Peak White.
|
|
About the Author
Dr. Raymond Soneira is President
of DisplayMate Technologies Corporation of Amherst, New Hampshire, which
produces display calibration, evaluation, and diagnostic products for
consumers, technicians, and manufacturers. See www.displaymate.com. He is a research
scientist with a career that spans physics, computer science, and television
system design. Dr. Soneira obtained his Ph.D. in Theoretical Physics from
Princeton University, spent 5 years as a Long-Term Member of the world famous
Institute for Advanced Study in Princeton, another 5 years as a Principal
Investigator in the Computer Systems Research Laboratory at AT&T Bell
Laboratories, and has also designed, tested, and installed color television
broadcast equipment for the CBS Television Network Engineering and Development
Department. He has authored over 35 research articles in scientific journals in
physics and computer science, including Scientific American. If you have any
comments or questions about the article, you can contact him at dtso.info@displaymate.com.
DisplayMate Display Optimization Technology
All
Smartphone, Tablet, Monitor and TV displays can be significantly improved using
DisplayMate’s proprietary very advanced scientific analysis and mathematical
display modeling and optimization of the display hardware, factory calibration,
and driver parameters. We help manufacturers with expert display procurement,
prototype development, display performance improvement and optimization,
testing displays to meet contract specifications, and production quality
control so that they don’t make mistakes similar to those that are exposed in
our public Display Technology Shoot-Out series for consumers. This article is a
lite version of our advanced scientific analysis – before the benefits of our DisplayMate Display Optimization
Technology, which can correct or improve all of these issues. If you are a
display or product manufacturer and want to significantly improve display
performance for a competitive advantage then Contact DisplayMate Technologies.
About DisplayMate Technologies
DisplayMate Technologies specializes in proprietary advanced
scientific display calibration and mathematical display optimization to deliver
unsurpassed objective performance, picture quality and accuracy for all types
of displays including video and computer monitors, projectors, TVs, mobile
displays such as Smartphones and Tablets, and all display technologies
including LCD, OLED, 3D, LED, LCoS, Plasma, DLP and CRT. This article is a lite version of
our intensive scientific analysis of Smartphone and Smartphone mobile displays
– before the benefits of our advanced mathematical DisplayMate Display Optimization
Technology, which can correct or improve many of the display deficiencies. We offer DisplayMate display
calibration software for consumers and advanced DisplayMate display diagnostic
and calibration software for technicians and test labs.
For
manufacturers we offer Consulting Services that include advanced Lab testing
and evaluations, confidential Shoot-Outs with competing products, calibration
and optimization for displays, cameras and their User Interface, plus on-site
and factory visits. We help manufacturers with expert display procurement,
prototype development, and production quality control so they don’t make
mistakes similar to those that are exposed in our Display Technology Shoot-Out
series. See our world renown Display
Technology Shoot-Out public article series for an introduction and preview.
DisplayMate’s
advanced scientific optimizations can make lower cost panels look as good or
better than more expensive higher performance displays. If you are a display or
product manufacturer and want to turn your display into a spectacular one to
surpass your competition then Contact
DisplayMate Technologies to learn more.
Article Links: OnePlus
8 Display Technology Shoot-Out
Article Links: OnePlus 8 Pro
Display Technology Shoot-Out
Article Links: Display
Color Gamuts Shoot-Out NTSC to Rec.2020
Article Links: Absolute
Color Accuracy Display Technology Shoot-Out
Article Links: Watching
Displays at Night
Article Links: Display Technology Shoot-Out
Article Series Overview and Home Page
Copyright © 1990-2020 by DisplayMate
Technologies Corporation. All Rights Reserved.
This article, or any part
thereof, may not be copied, reproduced, mirrored, distributed or incorporated
into any other work without
the prior written permission of DisplayMate Technologies Corporation