Samsung Galaxy OLED Display Technology Shoot-Out
Galaxy S I – Galaxy S II – Galaxy
S III
Dr. Raymond M. Soneira
President, DisplayMate Technologies
Corporation
Copyright © 1990-2012 by DisplayMate
Technologies Corporation. All Rights Reserved.
This article, or any part
thereof, may not be copied, reproduced, mirrored, distributed or incorporated
into any other work without
the prior written permission of DisplayMate Technologies Corporation
Introduction
Organic
Light Emitting Diodes, OLEDs, are the first new display technology in over 10
years that appears destined to play an increasing and eventual commanding role
in the marketplace. And they are finally ready to go big time – OLED HDTVs are
expected to arrive by early 2013 when LG and Samsung will begin shipping their
first 55 inch flagship models – they will draw crowds but initially few will be
able to afford the first generation price tags. On much smaller and affordable
scales, Samsung has for several years been supplying most of the OLED displays
found on a rapidly increasing number of Smartphones and a few Tablets.
The first
famous OLED Smartphone was the Google Nexus One,
launched in January 2010, which included a Samsung early generation OLED
display. But by far the most successful series of OLED Smartphones has been
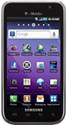
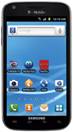
Samsung’s own Galaxy S series that launched in mid 2010 – Galaxy S I with a 4.0
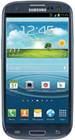
inch screen in June 2010, Galaxy S II with a 4.5 inch screen in June 2011, and
the just released Galaxy S III with a 4.8 inch screen in June 2012. All are
called “Super AMOLED” – some are Plus and others are PenTile – we’ll explain
the differences below.
Not
surprisingly, all new display technologies initially start near the back of the
pack in performance compared to the established and more refined products – IPS
LCDs in this particular case. Not surprisingly, the Google Nexus One came in last
place in our Smartphone
Display Shoot-Out. But six months later the Samsung Galaxy S I
did a lot better and we gave it a DisplayMate
Best Video Hardware Award for the Best New Display Technology.
In this Shoot-Out we will examine in-depth the display performance of the three
Galaxy S generations to see how OLEDs have been evolving and improving over
time. This article will be a combination of objective praise and critical
analysis of OLED displays.
OLED versus LCD and LED
Most
Smartphones, Tablets, Laptops, Computer Monitors, and HDTVs currently use LCD
display technology, which is a transmissive technology that requires a
Backlight to produce the light for the image. That Backlight is being made
increasingly with LEDs. Many manufacturers advertise their LCD displays and
HDTVs that have LED Backlights as LED displays and HDTVs, but that is very
misleading because the LEDs are just the Backlight for the LCD. There are
actually no consumer LED displays or HDTVs. On the other hand, OLED displays
are emissive devices that don’t require a Backlight because every pixel and
sub-pixel gives off its own colored light to produce the image. That lack of a
Backlight and its complex optics means that OLEDs are a lot thinner than LCDs
and is also the reason why OLEDs will eventually become a lot cheaper to
manufacture than LCDs.
OLED, PenTile AMOLED, Super AMOLED, Super AMOLED Plus, and HD Super
AMOLED
The
marketing terminology and puffery for displays varies among manufacturers and
is confusing… The Google Nexus One was listed as having an “AMOLED” display.
The AM stands for Active Matrix, but that prefix is unnecessary because all
current LCD and OLED Smartphones, Tablets, Laptops, and HDTVs use an Active
Matrix. All subsequent generations of Samsung OLEDs are called “Super AMOLED”
in the same way that you’ll often see “Super LCD” advertised as well. Not all
manufacturers use the “Super” terminology so it’s best just to ignore it as
advertising puffery. “HD AMOLED” means that the pixel resolution of the display
is High Definition 1280 x 720 pixels or higher. But here is where it gets
complicated and confusing – if you see “Plus” that means that the display has
the traditional 3 Red, Green and Blue sub-pixel arrangement that is found in
almost all display technologies. If you don’t see “Plus” on Samsung
devices that means that the display has only 2 sub-pixels per pixel (a Minus) –
half of the pixels have Green and Red sub-pixels and the other half have Green
and Blue sub-pixels, so Red and Blue are always shared by two adjacent pixels.
This technology is called “PenTile.” PenTile screens have only half the total
number of Red and Blue sub-pixels as the traditional 3 sub-pixel displays, so
they aren’t as sharp as traditional displays with the same pixel resolution and
their highly advertised screen PPIs are not comparable. This is especially
noticeable with colored text and graphics. PenTile uses Sub-pixel
Rendering and Anti-Aliasing that partially compensates for this shortfall.
PenTile displays have some advantages: they are easier to manufacture and
therefore cost less, and for OLEDs the Red, Green and Blue sub-pixels are sized
differently and that improves Blue aging somewhat (see below). For now, OLED
displays over 250 PPI use PenTile technology. It’s expected that the next
generation of OLEDs will be called “HD Super AMOLED Plus” and they will have
the standard 3 sub-pixels per pixel.
The Shoot-Out
To compare the performance of the Galaxy S series of OLEDs
we ran our in-depth series of Display
Technology Shoot-Out tests on the Galaxy S I, Galaxy S II, and Galaxy S III.
We take display quality very seriously and provide in-depth objective analysis
side-by-side comparisons based on detailed laboratory measurements and
extensive viewing tests with both test patterns and test images. For additional
background, context, and comparisons see our
in-depth new iPad
Display Shoot-Out and the previous generation Smartphone Display
Shoot-Out.
Results Highlights
In this Results section we provide Highlights of the
comprehensive lab measurements and extensive side-by-side visual comparisons
using test photos, test images and test patterns that are presented in later
sections. The next section below provides OLED Power Saving and Aging Advice. The Comparison Table in the following section summarizes the lab
measurements in the following categories: Screen
Reflections, Brightness and Contrast,
Colors and Intensities, Viewing Angles, Display Power Consumption, Running Time on Battery.
New Issues for a New
Technology: OLED is a very different new display technology and so
both manufacturers and consumers will have to learn about its particular
performance requirements and idiosyncrasies. The new issues for OLEDS are just
as challenging and significant as when we shifted from CRTs to LCDs. An
excellent source of information about OLEDs is www.oled-info.com. As the discussion below
shows, manufacturers still have a lot to learn…
OLED Engineering versus Galaxy Marketing: This is
actually a combined Shoot-Out – we are looking at an OLED display implemented
within Samsung Galaxy Marketing goals and requirements. One of the most
important is to make the Smartphone as thin and light as possible.
Unfortunately, the battery is a major contributor to both thickness and weight
so it bears the brunt of this limitation. OLED displays still require more
power on the average than comparable LCDs. And unfortunately, the Galaxy S
I,II,III battery runtimes (below) are shorter than most other Smartphones that
we have tested. As a result, Power Management is the single biggest issue
confronting OLED displays. The power constraints on all of the Galaxy S
Smartphones have significantly impacted many display performance issues,
particularly on the Galaxy S III. This is undoubtedly a strategic marketing
decision, but it would be nice if the Galaxy S III were also available in a
slightly thicker and heavier version with a bigger battery. In particular, that
would help its OLED display really shine if there were fewer imposed power constraints
that affect its calibration and performance…
OLED Progress Report: Based
on our Lab tests and measurements below there has been a rapid and significant
improvement in OLED performance within the Galaxy S I,II,III series,
particularly the power efficiency, which is extremely important. The OLED
displays themselves are excellent, but their overall performance has been
compromised by the calibration and implementation choices that have been made
for the Galaxy S series, which are discussed in detail throughout this article.
OLED Aging: All display technologies age
to varying degrees. The current generation of Blue OLEDs age much faster than
the Red and Green OLEDs. The current 50 percent aging Brightness for Blue is
specified by the manufacturers at 20,000 hours while Red and Green are both
over 200,000 hours. People generally don’t hold onto their Smartphones for very
long: for example, 2 years at 4 hours per day is about 3,000 hours. That would
actually be enough time for the Blue aging to become visually noticeable, but
there is also some built-in automatic aging compensation that adjusts the drive
levels to help counteract the aging effects. In the past users have documented
OLED aging with screen shots, but there have been continuing improvements, so
it’s hard to say how large the visual aging effects are for the current
generation of OLEDs. We include some advice on reducing aging effects and improving the power efficiency
of OLEDs below.
Comparison with the Best LCDs: The
premium IPS LCDs used in many top performing Smartphones and Tablets (including
the iPhone 4s and iPads) are the benchmark competition for these OLED displays.
IPS LCDs remain significantly brighter and still have a higher overall power
efficiency, but typically have a smaller Color Gamut, a higher Black Level, a
larger Brightness decrease with Viewing Angle, and some Motion Blur. OLEDs are
still more expensive than LCDs, although that will change over the next several
years. While LCDs are not very power efficient, they are still more power
efficient than OLEDs for producing bright images (although the public
perception is the reverse – that’s why OLED displays are dimmer and why you
don’t see any large OLED Tablets). There has been quite a significant
improvement within the Galaxy S I,II,III series and this will undoubtedly
continue until OLEDs eventually become more efficient than LCDs. For comparison
with LCDs see our in-depth new iPad Display
Shoot-Out.
Screen Brightness: The
Maximum and Peak Brightness for the Galaxy S III are significantly lower than
the S II and S I, and they are in turn lower than most
LCDs. Fortunately, the Screen Reflectance of the Galaxy S series is among the
lowest we have ever measured and that helps overcome much of the Brightness
shortfall. A more troubling issue with current OLEDs is the variation in
Brightness that occurs with image content, called the Average Picture Level,
APL. Bright images with high APL have their screen Brightness reduced by up to
30 percent, which introduces undesirable Brightness variations with content.
Another side effect is that the Brightness of images can change significantly
in shifting between Portrait and Landscape modes. On the Google Galaxy Nexus, a
close cousin of the Galaxy S III, the effect is so large for high APL that the
Brightness (Luminance) of Green is greater than White, which is very wrong.
Color of White for OLEDs:
Providing an accurate White is very important for getting accurate colors in
images, particularly photos and videos. The Standard White for digital
photography and essentially all consumer content is called D6500, which is the
color of Daylight and corresponds to a Color Temperature of 6,500 degrees
Kelvin. Whites with a higher Color Temperature appear too blue and lower too
yellow. White for the Galaxy S series ranges from 10,200 Kelvin for the S I
down to 7,900 Kelvin for the S III, among the bluest Whites we
have ever measured. This gives all images something of a cold bluish cast. But what
is positively shocking about increasing the Blue
content of all images is that Blue OLEDs have only about one tenth the power
efficiency of Red and Green OLEDs (see below), so the additional Blue produces
a significant waste of precious power that has very little effect on the total
screen Brightness. Perhaps even more shocking is
that the Blue OLEDs age at a much faster rate than the Red and Green OLEDs, so
the higher Color Temperature accelerates the aging process – a very bad idea.
Using the Standard D6500 White would improve color accuracy, improve battery
run time, and reduce aging…
Color Saturation and Accuracy: OLEDs
have a large native Color Gamut, much bigger than LCDs, but bigger isn’t always
better. In order to accurately reproduce the colors in photos, videos and other
images the display needs to match the Standard sRGB / Rec.709 Color Gamut that
is used to generate most consumer content. The Color Gamut of the Galaxy S
I,II,III is 138 percent of the Standard, which produces oversaturated colors
that can appear comic book like and gaudy in some instances. Photos appear with
way too much color. It’s similar to turning the Color Control way up on your
HDTV. Unfortunately, none of the Galaxy S Smartphones have a similar Color
Saturation control that would allow users to correct this or adjust it to their
satisfaction, so you’re stuck unless there is a software update that corrects
this. An accurate factory color calibration would fix it – but the exaggerated
images sometimes make these Smartphones standout in a crowd, so it undoubtedly
helps boost retail store sales. But eventually when you want to see accurate
renderings of your photos and images, you’re out of luck. Note that Apple is
emphasizing very high color accuracy in their latest displays – hopefully
Samsung will follow the lead…
Irregular Color Gamut and Power Implications: Not
only is the Galaxy S I,II,III Color Gamut set way too large, but it is also
very irregular – Green is much more saturated compared with either Red or Blue,
as shown in Figure 2.
This imbalance has a tendency to give images a Green accent and color cast. But
correcting the Gamut so that it matches the Standard has power efficiency
implications because Green is significantly more power efficient than either
Red or Blue, and they must be added as calibration color mixtures for the Color
Gamut adjustments, so the power consumption for a calibrated OLED display will
be higher. See below.
Viewing Angle Performance: In
principle, OLEDs shouldn’t have any variation in Brightness or Color with
Viewing Angle. But they do – they are still better than LCDs but show
significantly larger Brightness and Color Shifts than might be expected. The
Color Shifts are actually about double that for IPS LCDs, but are still
satisfactory. This is due primarily to the anti-reflection layer, although the
touch screen and cover glass also affect Viewing Angle performance. The root
cause is the greater optical path absorption at larger Viewing Angles. It’s still
satisfactory, but larger than expected. However, at very large Viewing Angles
(greater than 45 degrees) the screens on the Galaxy S I,II,III take on a
distinctly strong blue color shift and cast.
OLED Power Efficiency: While
LCDs are not very power efficient, they are still currently more power
efficient than OLEDs for producing bright high Average Picture Level APL
images. For dark low APL images OLEDs are very efficient and LCDs very
inefficient. So OLED Power Efficiency and Power Management strategies become
very important for bright images because they are using lots of battery power
(and generating heat). By far the most significant issue is that Green OLEDs
are 12 times more power efficient than Blue OLEDs and 1.8 times more efficient
than Red OLEDs at producing visible light (Luminance) for a given amount of
display power (Watts). In fact, Blue OLEDs consume more power than Green OLEDs
but generate only 9 percent of Green OLED Brightness (Luminance). This
tremendous imbalance means that images with lots of Green content are much more
power efficient. It also means that color mixtures all come with a power
penalty. In fact, color calibration of an OLED display so that it matches the
sRGB / Rec.709 Standard would require complex color mixtures that will have
noticeably higher power demands, which may make OLED calibration challenging in
the near future for mobile displays until the OLED efficiencies (or battery
power) increase significantly.
Galaxy S I, Galaxy S II, and Galaxy S III Power
Efficiency Comparisons: From our Luminance, Power, and
screen Area measurements we can compare the relative display power efficiencies
of the three Galaxy S generations. In going from the S I to the S II there
was a 29 percent improvement in display power efficiency, and in going from the
S II to the S III there was a 43 percent
improvement in display power efficiency. From S I to S III there
was a total of 59 percent improvement in display power efficiency – that’s in
just 2 years – very impressive!
OLED Galaxy S III and iPhone
LCD Power Efficiency Comparisons: Typical full screen text
applications (on a white background) have an Average Picture Level APL of 90
percent or more, so we expect LCDs to do better. On the other hand, typical
full screen video and photographic images have an APL of 20 percent or less, so
we expect OLEDs to do better there. From our Luminance, Power, and screen Area
measurements we can determine exactly which is better, when, and by how much.
Comparing the Galaxy S III and the iPhone 4, images with less than 28 percent
APL are more power efficient on the Galaxy S III, and greater than 28 percent
are more efficient on the iPhone 4 – so the Galaxy S III is somewhat more
efficient for videos and significantly less efficient for text applications.
But the iPhone 4 uses an LCD with Low Temperature Poly Silicon that is
significantly more efficient than typical LCDs with amorphous Silicon, such as
the iPhone 3GS – where the crossover is a lot higher at 69 percent APL, so it’s
a split decision there depending on the application mix…
Aggressive Power Management: The
smaller battery and bigger power needs of the larger OLED screens requires
aggressive display power management. The Galaxy S I has the least Power
Management and the Galaxy S III has the most. First of all, the Maximum and
Peak Brightness for the Galaxy S III are set significantly lower than the S II and S
I, and they are in turn lower than most LCDs. Fortunately, the Screen
Reflectance of the Galaxy S series is among the lowest we have ever measured
and that helps overcome much of the Brightness shortfall. Also to save power,
images with a high Average Picture Level APL are automatically dimmed by up to
30 percent. An Automatic Brightness control based on the Ambient Light level is
also important for display power management, but it is implemented poorly (see
below). These issues combined with the Power Efficiency effects discussed above
could all be better implemented with a Display Power Management Slider – set it
low and the display receives aggressive power management – set it high and the
display delivers optimum performance.
Significantly Improved Battery Running
Times:
The large improvement in OLED power efficiency and the much more aggressive
Power Management has produced a 75 percent increase in Battery Running Time for
the Galaxy S I to II to III, from a poor 3.2 hours to a very good 5.6 hours. For
comparison, note that the iPhone 4 has a running time of 7.8 hours with a
screen Brightness of 541 cd/m2 while the Galaxy S III has a running
time of 5.6 hours with a screen Brightness of 224 cd/m2. The running
times are based on a full brightness all white screen with no running
applications. As the Average Picture Level APL decreases the Battery Running
Times for OLEDs will increase.
Screen Reflectance: Ambient
light reflecting off the screen washes out the image, its contrast and colors.
Increasing the screen Brightness is one way to overcome this problem but it
uses precious battery power (and speeds up the OLED aging process). A much
better method is to lower the screen Reflectance. Because of the way the LCD
optics works they already have some built-in anti-reflection – not so for
OLEDs, so they have a much more difficult Reflectance problem. Fortunately, Samsung
has risen to the challenge because the Galaxy S OLED displays all have
Reflectance of 5 percent or less – among the lowest we have ever measured. The
Nokia Lumia 900 is the only other Smartphone to come in under 5 percent
Reflectance. This is quite impressive – it’s done by using advanced optics, a
Quarter Wave Plate under the cover glass suppresses the reflections. This is
super important for OLEDs because of the brightness, power, and aging issues
discussed above. Samsung has done an excellent job here. However, the Lab
measurements indicate that the Reflectance is getting slightly worse from I to
II to III, rather than better…
Automatic Brightness: It is
particularly important for Smartphones to accurately and automatically adjust
their screen brightness according to the current highly variable Ambient
Lighting conditions. This maintains screen visibility while minimizing the
battery power needed to do so. Because OLEDs have significant power management
issues this is especially important for them. Unfortunately, the Galaxy S
Smartphones all perform poorly here (as do almost all Android devices – Apple
does slightly better but still poorly). The Galaxy S I,II,III results are
similar to the results in our Automatic
Brightness Shoot-Out. An innovative application for the OLED’s large native
Color Gamut and high Color Saturation is to (only) fully use it when there is
High Ambient Light, which will help compensate for the washed out image colors
and will even allow lower screen Brightness to be used under those conditions –
but before that happens Automatic Brightness and Color Calibration will need to
be properly implemented.
Polarized Sunglasses: Most
LCDs and some OLED displays can have screen viewing interference
problems with polarized sunglasses – the image can become invisible Black
at some screen orientations and angles. The Galaxy S I, Galaxy S II, and Galaxy
Nexus have Quarter Wave Plate optics that result in a screen extinction at a 45
degree orientation, so their screens can be read in both Landscape and Portrait
orientations, which is good. However, the Galaxy S III screen shows
multi-colored circular rings with polarized sunglasses, which are quite
pronounced at large Viewing Angles, so the Galaxy S III is not good with
polarized sunglasses.
Google Galaxy Nexus: The Google Galaxy Nexus is also made by Samsung
and has an OLED display that is very similar to the Galaxy S III. However, its
Brightness is set much higher than the S III, but it then has a much higher
variation in Brightness with the APL of image content as discussed above – it
is more than a 2:1 variation, which is way too large. In fact, the effect on the Galaxy Nexus is so large that for high APL
the Brightness (Luminance) of Green is greater than White, which is very wrong.
Hopefully, Google will correct that with an Android software update…
OLED Power Saving and Aging Advice
There
is a lot that individual users can do to reduce the power consumption of OLEDs
and also reduce potential aging effects:
The
obvious recommendation for all display technologies is to appropriately adjust
the screen Brightness for the current level of Ambient Light – that should be
done by the Automatic Brightness control, but as indicated above it is poorly
implemented and close to useless on virtually all Smartphones including the
Galaxy S series. Hopefully that will be corrected in future versions of
Android. When adjusting screen Brightness also take into account that
applications like reading require higher visual acuity and need more Brightness
than when looking at photo and video content.
Unlike
LCDs, display power on OLEDs depends entirely on the image content – brighter
images use more power. In particular, wallpapers and screen backgrounds can
have a considerable impact on OLED power consumption.
Because
of differential aging, setting your wallpaper to all Black is most likely a bad
idea because the fixed arrangement of Home Screen icons may eventually affect
screen uniformity, so ghost images of the icons might become noticeable.
For
all text based reading applications it is a really good idea to set the
standard Black text on a White background to Reverse Video, White text
on a Black background. Not only does that use a lot less power but it improves
screen viewability in bright Ambient Lighting. Start by setting Google’s search
page to a Black background. Do the same for Email and other Apps and websites
wherever possible.
Setting
your wallpaper to a bright beach scene will use a lot more power than a subdued
indoor photo. A more subtle but more important issue is that color has a major
impact on display power consumption because the Green OLEDs provide 10 times
more Brightness per watt than Blue OLEDs. In fact, Blue OLEDs consume more
power than Green OLEDs but deliver only about one tenth of the Brightness. So
give preference to images and wallpapers with Greens and try to avoid images
with lots of Blue.
Conclusion: Great OLED Displays… But Compromised by Galaxy
Marketing Constraints…
All of the
Galaxy S OLEDs performed very well in our Lab Tests and Measurements. The results indicate that there has been a
rapid and significant 2:1 improvement in OLED performance, particularly the
power efficiency within the Galaxy S I,II,III series in just 2 years, which is
very impressive. LCDs like the iPhone 4 are still considerably more power
efficient than the latest OLEDs for bright image content with white backgrounds,
which includes most text based and web applications. On the other hand, OLEDs
are much more power efficient for full screen videos and photos, which
generally have low Average Picture Levels.
The OLED displays themselves are excellent, but their overall
performance has been compromised by the implementation choices that have been
made in marketing the Galaxy S series. In particular, the power constraints
have significantly compromised many display performance issues, particularly in
the Galaxy S III, in order to deliver a very thin and light phone with very
good battery running times. This is undoubtedly a strategic marketing decision,
but it would be nice if the Galaxy S III were also available in a slightly
thicker and heavier version with a bigger battery. That would help its OLED
display really shine, particularly if there were fewer imposed power
constraints that affect its display performance. In addition, OLED displays all
currently suffer from a lack of accurate Color Calibration, something that LCDs
have gotten very good at, particularly the new iPad, which is almost
accurate enough to be used as a professional studio reference monitor, so its photos,
videos, and image content appear beautiful and accurate. Hopefully, the same
will happen for OLED displays in the near future…
Even with these compromises and performance issues the latest
Galaxy S III has an impressive OLED display. If and when Samsung and Google
implement the suggestions that we have made it will turn into an outstanding
display. That and future models indicate a very promising and exciting future
for OLEDs…
Lots of Room for Improvement by Samsung and all of
the other OLED Smartphone and Tablet Manufacturers:
While
Samsung has zeroed in on OLED power efficiency and done an excellent job of it,
there are still plenty of other very important display issues that need to be
addressed by all of the OLED Smartphone and Tablet manufacturers along with
Google for the Android OS. Here are just a few: 1. Variable Display Power
Management: The Power Efficiency effects
discussed above could all be better implemented with a Display Power Management
Slider – set it low and the display receives aggressive power management – set
it high and the display delivers optimum performance. 2. Accurate Color
Calibration: The OLED Color Gamut is not only substantially larger than the
sRGB/ Rec.709 Standard, but it is also very
irregular – Green is much more saturated compared with either Red or Blue, as
shown in Figure 2. This
imbalance has a tendency to give images a Green accent and color cast. The
display also needs a Standard D6500 White Point – using D6500 would improve
color accuracy, improve Battery Running Time, and reduce Blue aging. Note that
Apple is emphasizing very high color accuracy in their latest displays –
hopefully Samsung and other manufacturers will follow the lead. 3. Screen Reflectance: Samsung has done an excellent job
here, but the Lab measurements indicate that the Reflectance is getting
slightly worse from Galaxy S I to II to III – it definitely needs to get
better. The typically large screen reflections can make the screen much harder
to read even in moderate ambient light levels, requiring ever higher brightness
settings that waste precious battery power. Manufacturers need to significantly
reduce the mirror reflections with anti-reflection coatings and haze surface
finishes. This article
shows how Smartphone and Tablet screens degrade as the Ambient Light increases
from 0 to 40,000 lux. 4. Ambient Light Sensor: The forward facing Ambient Light Sensor on virtually all
Smartphones and Tablets measures the brightness of your face instead of the
surrounding Ambient Light, which is what is needed to accurately set the
screen’s Automatic Brightness. 5.
Automatic Brightness: The Automatic Brightness controls on all Smartphones and
Tablets that we have measured are positively awful and close to functionally
useless. As a result they often get turned off, which reduces battery run time
and increases eye strain. This article
explains how to do it properly. 6. Display
User Interface: The User Interface for
most Smartphone and Tablet displays consists of a Brightness slider and an
Automatic Brightness checkbox. People have very different visual preferences
that should be accommodated with a display Pizzazz control that is similar to
the functionality provided by the audio Equalizers found on most Smartphones
and Tablets.
DisplayMate Display Optimization Technology
All Smartphone
and Tablet displays can be significantly improved using DisplayMate’s advanced
scientific analysis and mathematical display modeling and optimization of the
display hardware, factory calibration, and driver parameters. We can improve
the performance of any specified set of display parameters. This article is a
lite version of our intensive scientific analysis – before the benefits of our DisplayMate Display Optimization
Technology, which can correct or improve all of these issues. If you are a
display or product manufacturer and want to significantly improve display
performance for a competitive advantage then Contact DisplayMate Technologies.
Display Shoot-Out
Comparison Table
Below we
compare the displays on the Samsung Galaxy S I, Galaxy
S II, and Galaxy S III based on
objective measurement data and criteria.
All of the
units are USA T-Mobile retail products purchased new and tested as supplied
without any modifications or installed optional software.
For additional background, context, and comparisons see our in-depth new iPad Display
Shoot-Out and previous generation Smartphone Display
Shoot-Out.
|
Categories
|
Samsung
Galaxy S
I
|
Samsung
Galaxy S II
|
Samsung
Galaxy S III
|
Comments
|
|
Display Technology
|
4.0 inch
PenTile
OLED
|
4.5 inch
RGB OLED
|
4.8 inch
PenTile
OLED
|
Organic Light Emitting Diode
PenTile and RGB are the Sub-Pixel
layouts
|
|
Samsung Marketing Name
|
Super AMOLED
|
Super
AMOLED Plus
|
HD Super
AMOLED
|
Super means second generation with
advanced features.
AM means Active Matrix but is not
necessary.
Plus means RGB Sub-Pixels, without Plus
is PenTile.
|
|
Screen Shape
|
16:10 = 1.60
Aspect
Ratio
|
16:10 = 1.60
Aspect
Ratio
|
16:9 = 1.78
Aspect
Ratio
|
Ratio of the Height to Width in Portrait
mode.
|
|
Screen Area
|
7.1 sq
inches
|
8.9 sq
inches
|
9.8 sq
inches
|
Screen area in square inches.
|
|
Relative Screen Area
|
100
percent
|
27 percent
larger
than the Galaxy
S I
|
39 percent
larger
than the Galaxy
S I
|
Screen area compared to the Galaxy S I.
|
|
Display Resolution
|
800 x 480
pixels
|
800 x 480
pixels
|
1280 x 720
pixels
|
The more Pixels and Sub-Pixels the
better.
|
|
Pixels Per Inch
|
PenTile 233
PPI
Good
|
207 PPI
Very Good
|
PenTile
306 PPI
Very Good
|
PenTile displays have non-standard Pixels.
|
|
Sub-Pixels Per Inch
|
Red
165 SPPI
Green 233
SPPI
Blue
165 SPPI
|
Red
207 SPPI
Green 207
SPPI
Blue
207 SPPI
|
Red
216 SPPI
Green 306
SPPI
Blue
216 SPPI
|
PenTile displays have only half the
number of
Red and Blue Sub-Pixels as RGB displays.
Note that the Galaxy S II and Galaxy S
III have
approximately the same Red and Blue
SPPI.
|
|
Total Number of Sub-Pixels
|
Red
192 KSP
Green 384
KSP
Blue
192 KSP
|
Red
384 KSP
Green 384
KSP
Blue
384 KSP
|
Red
461 KSP
Green 922
KSP
Blue
461 KSP
|
Number of Kilo Sub-Pixels for Red, Green
and Blue.
|
|
On-Screen Displayed Color Depth
|
Full
24-bit color
256 Intensity
Levels
|
Full
24-bit color
256
Intensity Levels
|
Full
24-bit color
256
Intensity Levels
|
24-bit displays produce images with
relatively
smooth and artifact free colors and
intensities.
|
|
Gallery Viewer Color Depth
|
16-bit
color
|
Full
24-bit color
256 Intensity
Levels
|
Full
24-bit color
256
Intensity Levels
|
Most Android Tablets and Smartphones
still have
only 16-bit color
depth in the Gallery Photo Viewer.
|
|
|
Galaxy S
I
|
Galaxy S II
|
Galaxy S III
|
|
|
Overall Assessments
This section summarizes
the results of all of the extensive Lab measurements and viewing tests
performed on all of the displays.
|
|
Viewing Tests
|
Good
Images
Photos and
Videos
have too
much color
and
irregular contrast
Medium
Color Shifts
with
Viewing Angle
|
Good
Images
Photos and
Videos
have too
much color
too much
contrast
Medium
Color Shifts
with
Viewing Angle
|
Good
Images
Photos and
Videos
have too
much color
and good
contrast
Medium
Color Shifts
with
Viewing Angle
|
The Viewing Tests examined the accuracy
of
photographic images by comparing the
OLED
displays to an accurate calibrated
display.
|
|
Display Hardware Performance
Lab Tests and Measurements
|
Very Good
OLED Display
|
Excellent
OLED Display
|
Excellent
OLED Display
|
All of the Galaxy S OLEDs performed very
well in
the Lab Tests and Measurements.
|
|
Overall Display Calibration
Lab Tests and Viewing Tests
|
Good
Needs Improvement
|
Good
Needs Improvement
|
Good
Needs Improvement
|
Numerous Power Management and Color Calibration
issues need correction or improvement.
|
|
Overall Display Grade
|
Good B
|
Very Good B+
|
Very Good B+
|
All the OLED displays suffer from effects that
result from restricting display power and lack of color calibration.
|
|
|
Galaxy S
I
|
Galaxy S II
|
Galaxy S III
|
|
|
All of these screens are mirrors good enough to use
for personal grooming – but it’s actually a very bad feature…
We measured the light reflected from all directions
and also direct mirror (specular) reflections, which are much more
distracting and cause more eye strain. 10 – 15
percent reflections can make the screen much harder to read even
in moderate ambient light levels, requiring ever
higher brightness settings that waste precious battery power.
The Galaxy S displays all have Average Screen Reflectance
of 5 percent or less – among the lowest we have measured.
The Nokia Lumia 900 is the only other
Smartphone to come in under 5 percent Reflectance. This is quite impressive –
it’s done by using advanced optics, a Quarter
Wave Plate under the cover glass suppresses the reflections.
Samsung has done an excellent job here.
However, the Lab measurements indicate that the Reflectance is getting
slightly
worse from I to II to III, rather than better.
|
|
Average Screen Reflection
Light From All Directions
|
Reflects 4.4 percent
Excellent
|
Reflects
4.7 percent
Excellent
|
Reflects
5.0 percent
Excellent
|
Measured using an Integrating
Hemisphere.
The best value we have measured is 4.4
percent
and the current worst is 14.8 percent.
|
|
Mirror Reflections
Percentage of Light Reflected
|
5.7 percent
Very Good
|
6.1 percent
Very Good
|
7.1 percent
Very Good
|
These are the most annoying types of
reflections.
Measured using a narrow collimated
pencil beam
of light reflected off the screen.
|
|
|
Galaxy S
I
|
Galaxy S II
|
Galaxy S III
|
|
|
Brightness and Contrast
The Contrast Ratio is the specification that gets
the most attention, but it only applies for low ambient light, which is
seldom
the case for mobile displays. Much more important
is the Contrast Rating, which indicates how easy it is to read the screen
under High Ambient Lighting and depends on both the
Maximum Brightness and the Screen Reflectance.
The increasingly
aggressive Power Management in going from the Galaxy S I to II to III has
resulted in a progressive decrease
in screen Brightness.
The Contrast Rating for High Ambient Light has also decreased in going from
the Galaxy S I to II to III.
All of the Galaxy S OLED
displays show a significant variation in Brightness with Average Picture
Level, APL.
The Maximum Brightness
on Full Screen White, which has 100% APL, is 16 to 29 percent lower than the
Peak Brightness with
a small 1 percent APL.
This effect introduces undesirable Brightness variations with content and is
done to limit display power.
Another side effect is
the Brightness of images can change significantly in shifting between
Portrait and Landscape modes.
|
|
Measured Maximum Brightness
100% Full Screen White
|
Brightness
305 cd/m2
Good
|
Brightness
289 cd/m2
Good
|
Brightness
224 cd/m2
Poor
|
This is the Brightness with a Full White
Screen,
which has 100% Average Picture Level.
|
|
Measured Peak Brightness
1% of Full Screen White
|
Brightness
365 cd/m2
Very Good
|
Brightness
405 cd/m2
Very Good
|
Brightness
283 cd/m2
Good
|
This is the Brightness for a screen that
has
only a tiny 1% Average Picture Level
image.
|
|
Brightness Reduction
at High Average Picture Level
|
16 percent
|
29 percent
|
21 percent
|
This is the percent Brightness reduction
with Average
Picture Level. Ideally it should be 0
percent.
|
|
Black Level
at Maximum Brightness
|
Less than 0.005
cd/m2
Outstanding
|
Less than
0.005 cd/m2
Outstanding
|
Less than
0.005 cd/m2
Outstanding
|
Black Brightness is important for low
ambient light,
which is seldom the case for mobile
devices.
|
|
Contrast Ratio
Relevant for Low Ambient Light
|
Greater
than 61,000
Outstanding
|
Greater
than 58,000
Outstanding
|
Greater
than 45,000
Outstanding
|
Only relevant for low Ambient Light,
which is seldom the case for mobile
devices.
Defined as Maximum Brightness / Black
Brightness.
|
|
Contrast Rating
for High Ambient Light
|
Bright
Contrast 69 - 83
|
Bright
Contrast 61 - 86
|
Bright
Contrast 45 - 57
|
Defined as Maximum or Peak Brightness /
Average Reflectance.
|
|
Screen Viewability in Bright Light
|
Very Good
|
Very Good
|
Very Good
|
Indicates how easy it is to read the
screen
under high Ambient Lighting. Very
Important!
See High
Ambient Light Screen Shots
|
|
|
Galaxy S
I
|
Galaxy S II
|
Galaxy S III
|
|
|
The Color Gamut, Intensity Scale, and White Point
determine the quality and accuracy of all displayed images and all
the image colors. Bigger is definitely Not Better
because the display needs to match all the standards that were used
when the content was produced. The Intensity Scale affects
both image brightness and color mixture accuracy.
The most significant issue for the
OLEDs is the excessive Color Gamut and Color Saturation. The Color Gamut is
also
very irregular – Green is much more
saturated compared with either Red or Blue, as shown in Figure 2.
This imbalance has a tendency to give
images a Green accent and color cast.
|
|
White Color Temperature
For a Full White Screen
|
10,177
degrees Kelvin
White is Too
Blue
|
8,656
degrees Kelvin
White is Too
Blue
|
7,860
degrees Kelvin
White is
Too Blue
|
D6500 is the standard of White for most
content
and necessary for accurate color
reproduction.
|
|
Color Gamut
See Figure 2
|
Gamut Too
Large
138
percent of Std
See Figure 2
|
Gamut Too
Large
136 percent
of Std
See Figure 2
|
Gamut Too
Large
139
percent
See Figure 2
|
sRGB / Rec.709 is the color standard for
most
content and needed for accurate color
reproduction.
Note that Too Large a Color Gamut is
visually
worse than Too Small.
|
|
Dynamic Brightness
|
16 percent
|
29 percent
|
21 percent
|
This is the percent Brightness reduction
with Average
Picture Level. Ideally it should be 0
percent.
|
|
Dynamic Contrast
|
No
Excellent
|
No
Excellent
|
No
Excellent
|
Many manufacturers manipulate the
Intensity Scale
based on image content. That results in
inaccurate
colors and images.
|
|
Intensity Scale and Image Contrast
See Figure 3
|
Fairly Smooth
But
Contrast
is Irregular
|
Very
Smooth But
Contrast
is Too High
|
Very
Smooth
Contrast
is Good
|
The Intensity Scale controls image
contrast needed
for accurate image reproduction. See Figure 3
|
|
Gamma for the Intensity Scale
Larger means higher Image Contrast
See Figure 3
|
2..12 to 2.48
Gamma is Irregular
|
2.60
Gamma Too
High
|
2.38
Slightly
Too High
|
Gamma is the slope of the Intensity
Scale.
Gamma of 2.2 is the standard and needed
for
accurate image reproduction. See Figure 3
|
|
|
Galaxy S
I
|
Galaxy S II
|
Galaxy S III
|
|
|
Viewing Angles
The variation of
Brightness, Contrast, and Color with viewing angle is important for
Smartphones because of the
different ways they are
typically held. For LCDs, the typical manufacturer 176+ degree specification
Viewing Angle
is nonsense because that
is where the Contrast Ratio falls to a miniscule 10. For most LCDs there are
substantial
degradations at less
than ±30 degrees, which is not an atypical viewing angle for Smartphones.
The Brightness Decrease
for the OLEDs at a 30 degree Viewing Angle is 28 percent, larger than
expected, but about
half the value for LCDs.
On the other hand, the Color Shifts for OLEDs are about double that for IPS
LCDs, which is
again larger than
expected, but still satisfactory. The cause is primarily due to the
anti-reflection optics used for the
OLEDs. In addition, at very
large Viewing Angles (greater than 45 degrees) the screens on the Galaxy S
I,II,III take on
a distinctly strong blue
color shift and cast.
|
|
Brightness Decrease
at a 30 degree Viewing Angle
|
28 percent
Decrease
Surprisingly
Large
|
26 percent
Decrease
Surprisingly
Large
|
28 percent
decrease
Surprisingly
Large
|
Screens become less bright when tilted.
For OLEDs this is due to the
anti-reflection layers.
LCDs have larger Brightness variations, 58
percent.
|
|
Contrast Ratio
at a 30 degree Viewing Angle
|
Extremely
High
Not
Measured
|
Extremely
High
Not
Measured
|
Extremely
High
Not
Measured
|
A measure of screen readability when the
screen
is tilted under low Ambient Lighting.
|
|
Primary Color Shifts
at a 30 degree Viewing Angle
|
Medium
Color Shift
Δ(u’v’)
= 0.0237
5.9 times
JNCD
|
Medium
Color Shift
Δ(u’v’)
= 0.0227
5.7 times
JNCD
|
Medium
Color Shift
Δ(u’v’)
= 0.0234
5.9 times
JNCD
|
JNCD is a Just Noticeable Color Difference.
IPS LCDs have smaller Color Shifts, 2.5
times JNCD.
|
|
Color Shifts for Color Mixtures
at a 30 degree Viewing Angle
Reference Brown (255, 128, 0)
|
Medium
Color Shift
Δ(u’v’)
= 0.0191
4.8 times
JNCD
|
Medium
Color Shift
Δ(u’v’)
= 0.0173
4.3 times
JNCD
|
Medium
Color Shift
Δ(u’v’)
= 0.0168
4.2 times
JNCD
|
JNCD is a Just Noticeable Color Difference.
Reference Brown is a good indicator of
color shifts
with angle because of unequal drive
levels and
roughly equal luminance contributions
from
Red and Green.
IPS LCDs have smaller Color Shifts, 2.5
times JNCD.
|
|
|
Galaxy S
I
|
Galaxy S II
|
Galaxy S III
|
|
|
Since the displays have different screen sizes and
maximum brightness, the values were also scaled to the
same screen brightness (Luminance) and screen area
in order to compare their relative power efficiencies.
The large improvement in OLED power
efficiency has produced an almost a 2:1 improvement in the total
Display Power Efficiency from the
Galaxy S I to II to III. These results are consistent with the measured
Battery Running Times, below.
|
|
Maximum Display Power
|
2.4 watts
|
2.1 watts
|
1.3 watts
|
Lower power consumption is important for
energy
efficiency and improving running time on
battery.
|
|
Display Power Efficiency
same Peak Luminance and
same screen area as Galaxy S III
|
2.5 watts
|
1.8 watts
|
1.3 watts
|
This compares the Power Efficiency by
looking at the same screen Brightness
and screen area as the Galaxy S III.
|
|
Relative Display Power Efficiency
|
100 percent
|
39 percent Better
|
92 percent Better
|
The Relative Power Efficiency with
respect
to the Galaxy S I.
|
|
|
Galaxy S
I
|
Galaxy S II
|
Galaxy S III
|
|
|
Running Time on Battery
The running time on battery was determined with the
Brightness sliders at the Maximum setting, with a
Full White Screen, in Airplane Mode, with no
running applications, and with Auto Brightness turned off.
This is the maximum display load, which has a White
background, but there are no running applications.
As the Average Picture Level APL
decreases the Battery Running Times for OLEDs will increase.
Note that Auto Brightness can have a considerable
impact on running time but we found abysmal performance for
both the iPhone and Android Smartphones in our BrightnessGate analysis of Ambient Light Sensors
and Automatic
Brightness. They all need a more convenient Manual
Brightness Control as described in the BrightnessGate article.
The large improvement in OLED power
efficiency and the much more aggressive Power Management has produced
a 75 percent improvement in Battery
Running Time from the Galaxy S I to II to III. These results are consistent
with
the measured Display Power Consumption,
above.
For comparison, note that the iPhone 4
has a running time of 7.8 hours with a screen Brightness of 541 cd/m2
while
the Galaxy S III has a running time of
5.6 hours with a screen Brightness of 224 cd/m2.
|
|
Running Time
at Maximum Display Power
|
3.2 hours
|
4.4 hours
|
5.6 hours
|
Display always On at the Maximum setting
with
Airplane Mode and no running
applications.
|
|
Categories
|
Galaxy S
I
|
Galaxy S II
|
Galaxy S III
|
Comments
|
About the Author
Dr. Raymond Soneira is
President of DisplayMate Technologies Corporation of Amherst, New Hampshire,
which produces video calibration, evaluation, and diagnostic products for
consumers, technicians, and manufacturers. See www.displaymate.com. He is a research
scientist with a career that spans physics, computer science, and television
system design. Dr. Soneira obtained his Ph.D. in Theoretical Physics from
Princeton University, spent 5 years as a Long-Term Member of the world famous
Institute for Advanced Study in Princeton, another 5 years as a Principal
Investigator in the Computer Systems Research Laboratory at AT&T Bell
Laboratories, and has also designed, tested, and installed color television broadcast
equipment for the CBS Television Network Engineering and Development
Department. He has authored over 35 research articles in scientific journals in
physics and computer science, including Scientific American. If you have any
comments or questions about the article, you can contact him at dtso.info@displaymate.com.
About DisplayMate Technologies
DisplayMate Technologies specializes in proprietary sophisticated
scientific display calibration and mathematical display optimization to deliver
unsurpassed objective performance, picture quality and accuracy for all types
of displays including video and computer monitors, projectors, HDTVs, mobile
displays such as smartphones and tablets, and all display technologies
including LCD, OLED, 3D, LED, LCoS, Plasma, DLP and CRT. This article is a lite version of
our intensive scientific analysis of Tablet and Smartphone mobile displays –
before the benefits of our advanced mathematical DisplayMate Display Optimization
Technology, which can correct or improve many of the display deficiencies. We offer DisplayMate display
calibration software for consumers and advanced DisplayMate display diagnostic
and calibration software for technicians and test labs.
For
manufacturers we offer Consulting Services that include advanced Lab testing
and evaluations, confidential Shoot-Outs with competing products, calibration
and optimization for displays, cameras and their User Interface, plus supplier
display spec and quality control evaluations, and on-site and factory visits.
See our world renown Display
Technology Shoot-Out public article series for an introduction and preview.
DisplayMate’s
advanced scientific optimizations can make lower cost panels look as good or
better than more expensive higher performance displays. For more information on
our technology see the Summary description of our Adaptive Variable Metric Display
Optimizer AVDO. If you are a display or product
manufacturer and want to turn your display into a spectacular one to surpass
your competition then Contact
DisplayMate Technologies to learn more.
Article Links: Display Technology Shoot-Out
Article Series Overview and Home Page
Copyright © 1990-2012 by DisplayMate
Technologies Corporation. All Rights Reserved.
This article, or any part
thereof, may not be copied, reproduced, mirrored, distributed or incorporated
into any other work without
the prior written permission of DisplayMate Technologies Corporation