iPhone 14 Pro Max OLED Display Technology Shoot-Out
Dr. Raymond M. Soneira
President, DisplayMate Technologies
Corporation
Copyright © 1990-2022 by DisplayMate
Technologies Corporation. All Rights Reserved.
This article, or any part
thereof, may not be copied, reproduced, mirrored, distributed or incorporated
into any other work without
the prior written permission of DisplayMate Technologies Corporation
|
iPhone 14 Pro Max
|
Introduction and Overview
The key element for a great
Smartphone has always been a truly innovative and top performing display, and
the best leading edge Smartphones have always flaunted their super high tech
displays. It is the display performance that determines how good and how beautiful
everything on the Smartphone looks, including the camera photos, videos,
movies, web content, plus all of your Apps, and also how readable and how
usable the screen is in High Ambient Lighting. The Display is the Crown Jewel
of the Smartphone!
In this Display Technology Shoot-Out article series we Only Test and
Only Cover the Very Best State-of-the-Art
Top Performing Top Tier Smartphone Displays.
The articles are designed to promote Superior
Display Performance so that reviewers,
analysts, journalists, and consumers all Recognize and Appreciate Display Excellence, and also to reward and encourage manufacturers to produce
top performing displays for their products.
In this article we lab test, measure, analyze, and evaluate in depth the
display on the iPhone 14 Pro Max. This is
an independent scientific objective lab test and analysis of OLED displays
written for reviewers, analysts, journalists, and consumers. It is the latest
edition in our twelve year article series that has lab tested, tracked and analyzed
the development of mobile OLED displays and display technology, from its early
beginnings in 2010, when OLED displays started out in last place, into a
rapidly improving and evolving display technology that now has a commanding
first place lead and continues pushing ahead aggressively.
All of the DisplayMate Display
Performance Grades, Ratings and Awards are based entirely on the extensive
objective Lab tests and measurements that we also publish, so that everyone can
judge and compare the display performance data for themselves as well.
We cover these display performance topics with in-depth comprehensive
display tests, measurements, and analysis that you will find nowhere else.
Some of the iPhone 14 Pro Max Display
Performance Enhancements from the iPhone 13 Pro Max
Although the iPhone 14 Pro Max has close to the same
Screen Size and Resolution as the iPhone 13 Pro Max, the 14 Pro Max has many
new major Display Performance Enhancements:
· New
Always-On Display
An Always-On Display Mode keeps the display On
with essential information when the iPhone is in Standby.
· New
Dynamic Island
A Dynamic Island
centered over the Sensor Area at the top of the screen dynamically changes in
size to include timely information from the running Apps.
· New
High Brightness Mode
A Very High Peak Brightness of 2,300 nits which is more than Double for the iPhone 13 Pro Max.
· Brighter
HDR Photo and Video Display
HDR Brightness of 1,590 nits which is 33% Brighter than the
iPhone 13 Pro Max
· More
Display Performance Records
The iPhone 14 Pro Max has 15 Display
Performance Records compared to 12 Display Performance Records for the iPhone 13 Pro Max.
Article Overview
This iPhone 14 Pro Max article has the following major
sections:
· Conclusions: The iPhone 14 Pro Max Conclusions section below summarizes
all of the Results, Features, Functions and Records.
· Records: The Display Performance Records section below lists the
Lab measurement performance records.
· A+ Rating: The Display Rating section below summarizes the
DisplayMate Ratings and Criteria.
· Award: The Best Smartphone Display Award section
below summarizes the DisplayMate Display Performance Award Criteria.
· Measurements: The Display Shoot-Out Lab Measurements Comparison Table section
below has the complete set of measurements and tests.
· Assessments: The Display Performance Assessments section below
summarizes the display evaluation details.
We will cover all of the these display performance topics
and much more, with in-depth expert comprehensive display tests, measurements
and analysis that you will find nowhere else.
The Display Shoot-Out
To examine the
performance of the new iPhone 14 Pro Max OLED Display
we ran our in-depth series of Mobile
Display Technology Shoot-Out Lab tests and measurements in order to
determine how the latest OLED displays have improved. We take display quality
very seriously and provide in-depth objective analysis based on detailed
laboratory tests and measurements and extensive viewing tests with both test
patterns, test images and test photos. To see how far OLED and LCD mobile
displays have progressed in twelve years see our 2010 Smartphone
Display Shoot-Out, and for a real history lesson see our original 2006 Smartphone Display
Shoot-Out.
Apple provided DisplayMate Technologies with a retail unit of the iPhone
14 Pro Max so that we could perform our well known objective and comprehensive
DisplayMate Lab tests, measurements, and analysis, explaining in-depth the new
display performance results for consumers, reviewers, and journalists as early
as possible.
iPhone 14 Pro Max Conclusions:
The primary goal of this Display Technology Shoot-Out
article series has always been to publicize and promote display excellence
so that consumers, journalists, reviewers, and even manufacturers are aware of
and appreciate the very best in displays and display technology. We point out
which manufacturers and display technologies are leading and advancing the
state-of-the-art for displays by performing comprehensive and objective
scientific Lab Tests and Measurements together with in-depth analysis. We point
out who is leading, who is behind, who is improving, and sometimes
(unfortunately) who is back pedaling.
All of the DisplayMate Display
Performance Grades, Ratings and Awards are based entirely on the extensive
objective Lab tests and measurements that we also publish, so that everyone can
judge and compare the display performance data for themselves as well.
With consumers now spending rapidly increasing amounts of
time watching content on their Smartphones, the shift in emphasis from
primarily improving Display Hardware Performance to enhancing the overall
Display Picture Quality and Color Accuracy is an important step that
DisplayMate Technologies has been pushing for many years in our Display
Technology Shoot-Out article series, so it is great to see
manufactures improving and then competing on these DisplayMate
Lab Measurement Objective Display Performance Metrics.
The iPhone 14 Pro Max has the following
State-of-the-Art Display Performance Functions and Features:
· A
state-of-the-art OLED display that is
manufactured on a flexible plastic substrate. While
the OLED display itself is flexible, the screen remains rigid under an outer
hard Ceramic Shield cover glass.
· A Full Screen design
with a large 6.7 inch
OLED display that fills almost the entire
front face of the iPhone 14 Pro Max from edge-to-edge, providing a
significantly larger display for the same phone size.
· A display form factor with a taller height to width Aspect Ratio of 19.5 : 9 = 2.17, which is 22% larger than the 16 : 9 = 1.78 on most
Smartphones (and widescreen TVs) because the display now has the same overall
shape as the entire phone. It is taller in Portrait mode and wider in Landscape
mode.
· A 2.8K High Resolution 2796 x 1290 Full HD+ Display
with 460 pixels per inch, and Diamond
Pixels with Sub-Pixel Rendering for
enhanced sharpness and higher Peak Brightness.
· The iPhone
14 Pro Max display appears Perfectly Sharp for
normal 20/20 Vision at Typical Smartphone Viewing Distances of 12 to 18 inches
(30 to 46 cm).
· ProMotion dynamically adapts the Display Refresh Rate between 10 Hz
to 120 Hz based on the changing image content in order to optimize the screen
response time and power efficiency.
· A Dynamic Island centered over the Sensor Area at the top of the Screen
dynamically changes in size to include timely information from the running
Apps.
· An Always-On Display Mode that
keeps the display On with essential information when the iPhone is in Standby.
The Low 1 Hz Refresh Rate reduces the display power together with Auto
Brightness and an efficient display coprocessor.
· A Full Screen Brightness of 1,026
nits for 100% APL in High Ambient Light, which improves screen
visibility in high Ambient Light.
· A High Brightness Mode with a Very High Peak Brightness of
2,307 nits for Low APL in very high Ambient Light.
· Each iPhone 14 Pro Max display is individually calibrated at
the factory for both Color Accuracy and Contrast Accuracy.
· Very High Absolute Color Accuracy of 0.5
JNCD.
· Color Accuracy and
Intensity Scales that are Independent of the Image Content APL.
· Automatic Color Management that automatically switches to the proper Color Gamut for
any displayed image content within the Wide DCI-P3 Color Space that has an ICC
Profile, so images automatically appear with the correct colors, neither being
over-saturated or under-saturated.
· 2 Industry Standard Color Gamuts: the sRGB / Rec.709 Color
Gamut that is used for most current consumer
content, and the new Wide DCI-P3 Color Gamut that is used in 4K Ultra HD TVs. The DCI-P3 Gamut is
26 percent larger than the sRGB / Rec.709 Gamut.
· A Full 100%
DCI-P3 Color Gamut that is also used for
4K Ultra HD TVs, so the iPhone 14 Pro Max can display the latest
high-end 4K video content.
· A High Dynamic Range Mobile
HDR Display which allows the iPhone 14 Pro Max to play 4K High Dynamic
Range content produced for 4K UHD TVs. The HDR
Peak Brightness is 1,590 nits.
· Very Low Screen Reflectance
of 4.5 percent.
· A Night Shift Mode that
allows the user to adjust and reduce the amount of Blue Light from the display
for better night viewing and improved sleep.
· A Dark Mode setting that inverts the typical White Background
with Black Text to a Black Background with White Text, which significantly
reduces the overall Brightness of the entire display for most applications, and
should reduce eye strain when viewing the display in low to dark ambient light.
· A True Tone viewing mode that automatically changes the White
Point and color balance of the display based on real-time measurements of the Ambient
Light falling on the screen to make the display behave more like paper
reflecting Ambient Light and taking on its color.
· Small to Medium Color Shifts and Small Brightness Shifts with Viewing Angle.
· Vision Accessibility Display Modes to help people
with vision impairments.
· The iPhone 14 Pro
Max can be used with Polarized Sunglasses
in both the Portrait and Landscape orientations unlike many LCDs, which
generally work in only one of the two orientations.
The iPhone 14
Pro Max sets or matches 15 Smartphone Display Performance Records for:
Numerical Display Performance
Differences that are Visually Indistinguishable are considered Matched and Tied
Performance Records.
JNCD is a Just Noticeable
Color Difference
and APL is the Average
Picture Level
for on-screen Image Content.
· Highest Color Accuracy of White (0.2
JNCD for sRGB and 0.2 JNCD for DCI-P3) – Visually
Indistinguishable From Perfect.
· Highest Absolute Color Accuracy (0.5
JNCD for sRGB and 0.5 JNCD for DCI-P3) – Visually
Indistinguishable From Perfect.
· Smallest Shift in Color Accuracy with APL (0.3 JNCD for
sRGB and 0.3 JNCD for DCI-P3) – Visually
Indistinguishable From Perfect.
· Smallest Maximum Color Shift
with APL (0.9 JNCD for sRGB and 0.8 JNCD
for DCI-P3) – Visually Indistinguishable From
Perfect.
· Highest Image
Contrast Accuracy and Intensity Scale Accuracy (2.22 Gamma) – Visually
Indistinguishable From Perfect.
· Smallest Shift in Image Contrast and
Intensity Scale with APL (0.00 Gamma) – Visually
Indistinguishable From Perfect.
· Smallest Change in Peak Luminance with APL (1
percent) – Visually Indistinguishable From Perfect.
· Highest Full Screen Brightness
for OLED Smartphones (1,026 nits at 100% APL).
· Highest Peak Display
Brightness (2,307 nits for Low APL in High Ambient Light).
· Highest Contrast Ratio (Infinite).
· Lowest Screen Reflectance (4.5
percent).
· Highest Contrast Rating in Ambient
Light (228 for 100% APL and 513 for Peak Brightness).
· Smallest Brightness Variation with Viewing Angle (25% at 30
degrees).
· Smallest Color Variation of White with Viewing Angle (1.5
JNCD at 30 degrees).
· Highest Visible Screen Resolution 2.8K (2796x1290) – 4K Does Not appear visually sharper on a Smartphone.
The iPhone 14 Pro Max earns our Highest A+
Display Performance Assessment Rating
OLED has evolved into a highly refined and mature display technology that
now produces the best and highest performance displays for Smartphones.
OLED Display Performance continues to
provide major Record Setting improvements with every new generation.
With consumers now spending rapidly increasing amounts of
time watching content on their Smartphones, the shift in emphasis from
primarily improving Display Hardware Performance to enhancing the overall
display Picture Quality and Color Accuracy is an important step that
DisplayMate Technologies has been pushing for many years in our Display
Technology Shoot-Out article series, so it is great to see
manufacturers improving and then competing on these DisplayMate
Objective Lab Measurement Metrics.
Apple has concentrated on significantly raising the
on-screen Absolute Picture Quality and Absolute Color Accuracy of the OLED display by
implementing Precision Factory Display Calibration,
moving the overall iPhone 14 Pro Max Display
Performance up to Record Setting Outstanding
Levels with close to Text Book Perfect
Calibration Accuracy that is Visually Indistinguishable
From Perfect.
DisplayMate Display Performance Ratings:
All of the Results in this
article are based Entirely on our Objective and Extensive DisplayMate Lab Tests
and Measurements that are all listed in a section below.
· To get a DisplayMate A Display
Performance Rating the display must get All Green [Very Good to Excellent]
Ratings for All of the Display Tests and Measurements [except for Color Shifts
at 30 degrees Viewing Angle, which are deemed less important].
· Then to get a DisplayMate A+ Display
Performance Rating the Average Absolute Color Accuracy and the Average Absolute Color
Accuracy Shifts with Average Picture Level APL must All be less than 1.0
JNCD, and the Largest Color Errors must All be less than 3.0 JNCD.
The iPhone 14 Pro Max delivers
Uniformly Consistent Top Tier Display
Performance and receives All Green [Very Good to Excellent] Ratings in All DisplayMate Lab Test Display Performance and Accuracy
Categories and has Absolute Color
Accuracy much better than 1.0 JNCD.
The iPhone 14 Pro Max display meets all of the criteria and
requirements for a DisplayMate A+ Grade, earning DisplayMate’s Highest Overall
Display Assessment Rating and Highest Display Performance Grade of A+.
DisplayMate Display Performance Rating and
Best Smartphone Display Award
Based on our extensive Lab Tests and Measurements the iPhone 14 Pro Max
has a Very Impressive Excellent Top Tier World Class Smartphone Display
with close to Text Book Perfect Calibration
Accuracy and Performance that is Visually
Indistinguishable From Perfect. Based
on our objective Lab Tests and Measurements the iPhone
14 Pro Max receives a DisplayMate Best
Smartphone Display Award earning DisplayMate’s highest ever Display Performance Grade of A+ and setting or
matching 15 Smartphone Display Performance Records
including 7 that are Visually Indistinguishable From
Perfect that are listed above.
The iPhone 14 Pro Max joins
the very select Top Tier of Smartphone Displays which all provide Close to Text Book Perfect Calibration Accuracy and
Performance that is Visually Indistinguishable From Perfect, so they all
received and maintain Concurrent DisplayMate Best Smartphone Display Awards. All are Excellent State-of-the-Art Displays, each is
better in some Display Performance Categories, but None are Best in All the
Display Performance Categories. Note that measured numerical display
performance differences that are Visually Indistinguishable are equivalent.
As Display Performance continues to improve we have and will
continue to raise the Performance Levels necessary to receive a DisplayMate
Best Smartphone Display Award and an A+ Display Rating,
so The Top Tier of Smartphone Displays will continue to evolve and change
with each new display generation, but only the Very Best Displays will continue
to receive A+ Ratings each year.
Follow DisplayMate
on Twitter to learn about our upcoming Smartphone display technology
coverage.
See the links below for all of the iPhone 14 Pro Max
Measurements, Evaluations, Analysis, and Assessments
Data Tables: See
the Display Shoot-Out Lab Measurements Comparison Table
section below has the complete set of measurements and tests.
Records: See
the Display Performance Records section above
that lists the Lab measurement performance records.
Assessments: See the Display
Performance Assessments section below summarizes the display evaluation details.
DisplayMate Display Optimization Technology
All
Smartphone, Tablet, Monitor and TV displays can be significantly improved using
DisplayMate’s proprietary very advanced scientific analysis and mathematical
display modeling and optimization of the display hardware, factory calibration,
and driver parameters. We help manufacturers with expert display procurement,
prototype development, display performance improvement and optimization,
testing displays to meet contract specifications, and production quality
control so that they don’t make mistakes similar to those that are exposed in
our public Display Technology Shoot-Out series for consumers. This article is a
lite version of our advanced scientific analysis – before the benefits of our DisplayMate Display Optimization
Technology, which can correct or improve all of these issues. If you are a
display or product manufacturer and want to significantly improve display
performance for a competitive advantage then Contact DisplayMate
Technologies.
Display Shoot-Out Comparison Table
Below we
examine in-depth the OLED display on the Apple iPhone
14 Pro Max based on objective Lab
measurement data
and criteria
in the following sections: Display Specifications,
Overall Assessments, Screen
Reflections, Brightness and Contrast,
Colors and Intensities, Absolute Color Accuracy, Viewing
Angles, OLED Spectra
Detailed Test and
Measurement Comparisons between the iPhone 14 Pro Max and iPhone 13 Pro Max.
You can directly compare the data and measurement results
for the iPhone 14 Pro Max with the iPhone 13 Pro Max
in detail by using a Tabbed web browser with our
comprehensive Lab measurements and analysis for each of the displays.
For each Tab click on a Link below. The entries are
mostly identical with only minor formatting differences,
so it is easy to make detailed side-by-side comparisons
by simply clicking through the Tabs.
Apple iPhone 14 Pro Max Lab Measurements Comparison Table
Apple
iPhone 13 Pro Max Lab Measurements Comparison Table
For
comparisons with the other leading Smartphone displays see our Mobile Display Technology
Shoot-Out article series.
|
Categories
|
Apple
iPhone 14 Pro Max
|
Comments
|
|
Display Technology
|
Flexible
OLED Display with Diamond
Pixels
6.7 inch
Diagonal / 17.0 cm Diagonal
Excluding
the Rounded Corners
|
Flexible Organic Light Emitting Diode
Diamond Pixels with
Diagonal Symmetry.
|
|
Screen Aspect Ratio
|
19.5 : 9 =
2.17
Higher
Aspect Ratio
Most
Smartphones and Widescreen TVs have 16 : 9 = 1.78
|
Height to Width Aspect Ratio
iPhone 14 Pro Max display screen is 22%
longer than
most Smartphones and widescreen 16:9 TV
content.
|
|
Screen Size
|
2.80
x 6.07 inches
7.12 x
15.43 cm
|
Display Width and Height in inches and
cm.
|
|
Screen Area
|
17.0 square
inches / 109 square cm
The
Rounded Corners Account for only 0.6% of Full Rectangular Screen Area
|
A better measure of size than the
diagonal length.
|
|
Sensor Slot Area
Dynamic Island
|
The Sensor
Slot Area of the Screen holds the Front Camera and 3D Sensor
It has
only 1.1% of the Total Screen Area
It can be
Dynamically Enlarged by OS Software into the Dynamic Island
in order
to show Multiple Alerts and Information from Running Apps
|
The Sensor Slot and Dynamic Island are at the top of
the Screen as a rectangular area with
rounded corners.
|
|
Supported Color Gamuts
|
Standard Wide Gamut – DCI-P3 Digital Cinema Content
Standard
Normal Gamut – sRGB / Rec.709 Content
Automatic
Color Gamut Management for Content with ICC Profiles
|
The iPhone 14 Pro Max supports 2 Standard
Gamuts including the new wider DCI-P3 Color Gamut that is
used in the 4K Ultra HD TV content.
|
|
Display Refresh Rates
|
Higher 120
Hz Refresh for Smoother Scrolling and Motion
The Refresh
Rate changes Automatically based on the image content
For Static
Images the Refresh Rate can go as low as 1 Hz
|
Higher Refresh Rates improve image
Scrolling
plus Video and Motion Performance in
Apps,
and may reduce Screen Flicker that some
people experience.
|
|
Display Resolution
|
2796 x 1290
pixels
2.8K Full
HD+
|
Screen Pixel Resolution.
Quad HD can display four 1280x720 HD
images.
|
|
Total Number of Pixels
|
3.6 Mega
Pixels
|
Total Number of Pixels.
|
|
Pixels Per Inch
|
460 PPI
with Diamond Pixels
Excellent
|
Sharpness depends on the viewing distance
and PPI.
See this on
the visual acuity for a true Retina Display
|
|
Sub-Pixels Per Inch
|
Red
325 SPPI
Green
460 SPPI
Blue
325 SPPI
|
Diamond Pixel displays have only half the
number
of Red and Blue Sub-Pixels as RGB Stripe
displays.
See the Diamond Sub-Pixel
layout
|
|
Total Number of Sub-Pixels
|
Red
1.8 Million Sub-Pixels
Green 3.6
Million Sub-Pixels
Blue
1.8 Million Sub-Pixels
|
Number of Mega Sub-Pixels for Red,
Green, Blue.
Diamond Sub-Pixel displays have only half
the number
of Red and Blue Sub-Pixels as RGB Stripe
displays.
At High PPI this is generally not visible
due to the
use of Sub-Pixel Rendering.
|
|
20/20 Vision Distance
where Pixels or Sub-Pixels
are Not Resolved
|
7.5 inches / 19.0 cm for White and Green Sub-Pixels with 20/20 Vision
10.6
inches / 26.9 cm for Red and Blue Sub-Pixels with 20/20 Vision
|
For 20/20 Vision the minimum Viewing
Distance
where the screen appears perfectly sharp
to the eye.
|
|
Display Sharpness
at Typical Viewing Distances
|
iPhone 14 Pro Max
Display appears Perfectly Sharp
Pixels are
not Resolved with 20/20 Vision
at Typical
Viewing Distances of
12 to
18 inches
30 to 46
cm
|
The Typical Viewing Distances for this
screen size
are in the range of 12 to 18 inches or
30 to 46 cm.
Also note that eye’s resolution is much
lower for
Red and Blue color content than White
and Green.
|
|
Appears Perfectly Sharp
at Typical Viewing Distances
|
Yes
|
Typical Viewing Distances are 12 to 18
inches
or 30 to 46 cm for this screen size.
|
|
Overall Assessments
This section summarizes
the results for all of the extensive Lab Measurements and Viewing Tests
performed on the display.
See Screen Reflections, Brightness
and Contrast, Colors and Intensities,
Viewing Angles, OLED
Spectra
The
iPhone 14 Pro Max has Automatic Color Management that switches to the
appropriate Color Gamut for Content with ICC Color Profiles.
The
DCI-P3 Digital Cinema Gamut is used in 4K Ultra HD TVs, and other advanced imaging
applications.
The
sRGB / Rec.709 Gamut is used for most current consumer photo, video,
web, and computer content.
|
Categories
|
Wide
Gamut
DCI-P3
Content
|
Standard
Gamut
sRGB /
Rec.709 Content
|
Comments
|
|
Viewing Tests
in Subdued Ambient Lighting
|
Excellent
Images
Photos and
Videos
have
Excellent Color
and
Accurate Contrast
Accurate
DCI-P3 Content
|
Excellent
Images
Photos and
Videos
have
Excellent Color
and
Accurate Contrast
Accurate
sRGB Content
|
The Viewing Tests examine the accuracy
of
photographic images by comparing the
displays
to an calibrated studio monitor and TV.
|
|
Variation with Viewing Angle
Colors and Brightness
See Viewing Angles
|
Color
Shifts
Small to
Medium
with Viewing
Angle
Small
Brightness Shifts
with
Viewing Angle
|
Color
Shifts
Small to
Medium
with
Viewing Angle
Small
Brightness Shifts
with
Viewing Angle
|
The iPhone 14 Pro Max display has a
relatively small
decrease in Brightness with Viewing
Angle and
relatively small to Medium Color Shifts
with
Viewing Angle.
See the Viewing Angles section for details.
|
|
Overall Display Assessment
Lab Tests and Measurements
|
Excellent
OLED Display
Accurate
DCI-P3 Content
|
Excellent
OLED Display
Accurate
sRGB Content
|
The iPhone 14 Pro Max OLED Display
performed
very well in the Lab Tests and
Measurements.
|
|
|
|
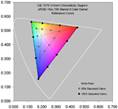
Absolute Color Accuracy
Measured over Entire Gamut
See Figure 2 and Colors
|
Excellent
Color Accuracy
Color
Errors are Very Small
Accurate
DCI-P3 Content
|
Excellent
Color Accuracy
Color
Errors are Very Small
Accurate
sRGB Content
|
Absolute
Color Accuracy is measured with a
Spectroradiometer
for 41
Reference Colors
uniformly
distributed within the entire Color Gamut.
See
Figure 2 and Colors for details.
|
|
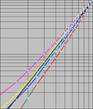
Image Contrast Accuracy
See Figure 3 and Contrast
|
Excellent
Accuracy
Image
Contrast
Very
Accurate
|
Excellent
Accuracy
Image
Contrast
Very
Accurate
|
The
Image Contrast Accuracy is determined by
measuring
the Log Intensity Scale and Gamma.
See
Figure 3 and Contrast for details.
|
|
Performance in Ambient Light
Display Brightness
Screen Reflectance
Contrast Rating
See Brightness and Contrast
See Screen Reflections
|
High
Display Brightness
Very Low
Reflectance
High
Contrast Rating
for Ambient
Light
Higher
Brightness with
Auto-Brightness
On
|
High
Display Brightness
Very Low Reflectance
High
Contrast Rating
for Ambient
Light
Higher
Brightness with
Auto-Brightness
On
|
Smartphones
are seldom used in the dark.
Screen
Brightness and Reflectance determine
the
Contrast Rating for High Ambient Light.
See
the Brightness and Contrast section for details.
See
the Screen Reflections section for details.
|
|
Overall Display Calibration
Image and Picture Quality
Lab Tests and Viewing Tests
|
Excellent
Calibration
Accurate
DCI-P3 Content
|
Excellent
Calibration
Accurate
sRGB Content
|
iPhone 14 Pro Max display delivers
accurately
calibrated colors and images for both
Wide DCI-P3 and Standard sRGB Content.
|
|
|
Overall Display Grade
Overall
Assessment
|
Overall iPhone 14 Pro Max
Display Grade is Excellent A+
DisplayMate Best
Smartphone Display Award
with 15 Smartphone
Display Performance Records
including 7 that are
Visually Indistinguishable From Perfect
An Excellent Top Tier
World Class Smartphone Display
|
The iPhone 14 Pro Max display delivers
excellent
image quality for Wide DCI-P3 Color
Content
and Standard sRGB Color Content, with
high Screen Brightness and low
Reflectance,
has good Viewing Angles, and is an all
around
top performing Smartphone display.
|
|
Accurate
DCI-P3 Content
For Viewing
4K UHD TV
DCI-P3
Cinema Content
|
Accurate
Standard sRGB Content
For Viewing
Most Current Content
Photo Video
Movie Web
|
Categories
|
Wide
Gamut
DCI-P3
Content
|
Standard
Gamut
sRGB /
Rec.709 Content
|
Comments
|
|
Screen Reflections
All display screens are mirrors good enough to use
for personal grooming – but that is actually a very bad feature…
We measured the light reflected from all directions
and also direct mirror (specular) reflections, which are much more
distracting and cause more eye strain. Many
Smartphones still have greater than 10 percent reflections that make
the screen much harder to read even in moderate
ambient light levels, requiring ever higher brightness settings that
waste precious battery power. Manufacturers should
reduce the mirror reflections with anti-reflection coatings and
matte or haze surface finishes.
Our Lab Measurements include Average
Reflectance for Ambient Light from All Directions and for Mirror Reflections.
We use an Integrating Hemisphere and a
highly collimated pencil light beam together with a Spectroradiometer.
The Screen Reflectance
is exactly the same for all Color Gamuts.
The iPhone 14 Pro Max has close to the
lowest Screen Reflectance levels that we have ever measured for a Smartphone.
These results are extremely important
for screen readability, picture quality, and color accuracy in ambient light.
|
Categories
|
iPhone
14 Pro Max
|
Comments
|
|
Average Screen Reflection
Light From All Directions
|
4.5 percent
for
Ambient Light Reflections
Excellent
|
Measured using an Integrating Hemisphere
and
a Spectroradiometer.
The lowest value we have ever measured
for a Smartphone is 4.3 percent.
|
|
Mirror Reflections
Percentage of Light Reflected
|
5.5
percent
for Mirror
Reflections
Very Good
|
These are the most annoying types of
Reflections.
Measured using a Spectroradiometer and a
narrow
collimated pencil beam of light
reflected off the screen.
The lowest value we have ever measured
for a Smartphone is 5.4 percent.
|
|
Brightness and Contrast
The Contrast Ratio
is the specification that gets the most attention, but it only applies for
low ambient light, which is seldom
the case for mobile
displays.
Much more important is the Contrast
Rating for High Ambient Light, which indicates how easy it is to read
the screen under
high ambient lighting and depends on both
the Maximum Brightness and the Screen Reflectance. The larger the better.
The display’s actual on-screen Contrast Ratio changes with the Ambient Light lux
level and is proportional to the Contrast Rating.
The iPhone 14 Pro Max comes set with Auto-Brightness turned On, which automatically
changes the display Brightness
based on the current level of Ambient Light measured by
a sensor beneath the OLED display near the top of the screen..
The Maximum Brightness is
higher with Auto-Brightness On.
|
Categories
|
Wide
Gamut
DCI-P3
Content
|
Standard
Gamut
sRGB /
Rec.709 Content
|
Comments
|
|
Manual Brightness Mode
Auto-Brightness Off
|
|
Home Screen Peak Brightness
Measured for White
|
Brightness
840 cd/m2
Excellent
|
Brightness
840 cd/m2
Excellent
|
The Peak Brightness for White on the
Home Screen.
|
|
Measured Maximum Brightness
50% Average Picture Level
|
Brightness
837 cd/m2
Excellent
|
Brightness
839 cd/m2
Excellent
|
This is the Brightness for typical
screen content
that has a 50% Average Picture Level.
|
|
Measured Maximum Brightness
100% Full Screen White
|
Brightness
825 cd/m2
Excellent
|
Brightness
827 cd/m2
Excellent
|
This is the Brightness for a screen that
is entirely
all white with 100% Average Picture
Level.
|
|
Measured Maximum Brightness
1% Average Picture Level
|
Brightness
836 cd/m2
Excellent
|
Brightness
838 cd/m2
Excellent
|
This is the Brightness for a screen that
has only a tiny 1% Average Picture
Level.
|
|
Dynamic Brightness
Change in Luminance with
Average Picture Level
|
1 percent
Decrease
Excellent
|
1 percent
Decrease
Excellent
|
This is the percent Brightness decrease
with APL,
Average Picture Level. Ideally should be
0 percent.
|
|
Auto Brightness Mode
The Maximum Brightness Increases
Automatically with the Ambient Light Level
Measured at 5,500 lux Ambient Light
|
|
Measured Maximum Brightness
50% Average Picture Level
|
Brightness
1,028 cd/m2
Excellent
|
Brightness
1,032 cd/m2
Excellent
|
This is the Brightness for typical
screen content
that has a 50% Average Picture Level.
|
|
Measured Maximum Brightness
100% Full Screen White
|
Brightness
1,016 cd/m2
Excellent
|
Brightness
1,020 cd/m2
Excellent
|
This is the Brightness for a screen that
is entirely
all white with 100% Average Picture
Level.
|
|
Measured Maximum Brightness
1% Average Picture Level
|
Brightness
1,031 cd/m2
Excellent
|
Brightness
1,035 cd/m2
Excellent
|
This is the Brightness for a screen that
has only a tiny 1% Average Picture
Level.
|
|
Dynamic Brightness
Change in Luminance with
Average Picture Level
|
1 percent
Decrease
Excellent
|
1 percent
Decrease
Excellent
|
This is the percent Brightness decrease
with APL,
Average Picture Level. Ideally should be
0 percent.
|
|
Auto High Brightness Mode
Measured at Very High Ambient Light
The Maximum Brightness Increases
Significantly for Lower Average Picture Levels in order to improve Screen
Readability
|
|
Measured Maximum Brightness
50% Average Picture Level
|
Brightness
1,045 cd/m2
Excellent
|
Brightness
1,044 cd/m2
Excellent
|
This is the Brightness for typical
screen content
that has a 50% Average Picture Level.
|
|
Measured Maximum Brightness
100% Full Screen White
|
Brightness
1,021 cd/m2
Excellent
|
Brightness
1,026 cd/m2
Excellent
|
This is the Brightness for a screen that
is entirely
all white with 100% Average Picture
Level.
|
|
Measured Maximum Brightness
1% Average Picture Level
|
Brightness
2,108 cd/m2
Excellent
|
Brightness
2,307 cd/m2
Excellent
|
This is the Brightness for a screen that
has only a tiny 1% Average Picture
Level.
|
|
Dynamic Brightness
Change in Luminance with
Average Picture Level
|
52 percent
Decrease
Intentionally
Large
|
56 percent
Decrease
Intentionally
Large
|
This is the percent Brightness decrease
with APL,
Average Picture Level. Ideally should be
0 percent.
|
|
Low Ambient Light
|
|
Lowest Peak Brightness
Super Dim Setting
Brightness Slider to Minimum
|
2 cd/m2
For Very
Low Light
|
2 cd/m2
For Very
Low Light
|
This is the Lowest Brightness with the
Slider set to
Minimum. This is useful for working in
very dark
environments. Picture Quality remains
Excellent.
|
|
Black Brightness at 0 lux
at Maximum Brightness Setting
|
0 cd/m2
Outstanding
|
0 cd/m2
Outstanding
|
Black Brightness is important for Low
Ambient Light,
which is seldom the case for mobile
devices.
|
|
Contrast Ratio at 0 lux
Relevant for Low Ambient Light
|
Infinite
Outstanding
|
Infinite
Outstanding
|
Only relevant for Low Ambient Light,
which is seldom the case for mobile
devices.
|
|
Always-On Display Mode
The Brightness Varies Automatically with
the Ambient Light Level
|
|
Measured Brightness for White
|
Low
Ambient Light 2 cd/m2
High
Ambient Light 480 cd/m2
|
Low
Ambient Light 2 cd/m2
High
Ambient Light 480 cd/m2
|
Displayed image content when the iPhone
is in Standby Mode.
|
|
High Ambient Light Contrast Rating
For White with the Brightness Slider at
Maximum
|
|
Contrast Rating
for High Ambient Light
The Higher the Better
for Screen Readability
in High Ambient Light
|
183 – 186
With Manual
Brightness Mode
Very Good
227 – 468
With
Auto-Brightness On
Excellent
|
184 – 186
With Manual
Brightness Mode
Very Good
228 – 513
With
Auto-Brightness On
Excellent
|
Depends on the Screen Reflectance and
Brightness.
Defined as Maximum Brightness / Average Reflectance.
The display’s actual on-screen Contrast
Ratio
changes with the Ambient Light lux level
and
is proportional to the Contrast Rating.
|
|
Screen Readability
in High Ambient Light
|
Very Good A
With Manual
Brightness Mode
Excellent A+
With
Auto-Brightness On
|
Very Good A
With Manual
Brightness Mode
Excellent A+
With
Auto-Brightness On
|
Indicates how easy it is to read the
screen
under High Ambient Lighting. Depends on
both the Screen Reflectance and
Brightness.
See High
Ambient Light Screen Shots
|
|
Colors and Intensities
The Color Gamut, Intensity Scale, and White Point
determine the quality and accuracy of all displayed images and all
the image colors. Bigger is definitely Not Better
because the display needs to match all the standards that were used
when the content was produced.
The iPhone has Automatic Color
Management that switches to the appropriate Color Gamut for Content with ICC
Color Profiles.
|
Categories
|
Wide
Gamut
DCI-P3
Content
|
Standard
Gamut
sRGB /
Rec.709 Content
|
Comments
|
|
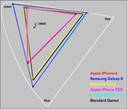
Color of White
Color Temperature in degrees
Measured in the dark at 0 lux
See Figure 1
|
6,550 K
0.2 JNCD
from D65 White
Very Close
to Standard
Excellent
Accurate
White Point
See Figure 1
|
6,550 K
0.2 JNCD
from D65 White
Very Close
to Standard
Excellent
Accurate
White Point
See Figure 1
|
D65 with 6,500 K is the standard color
of White
for most Consumer Content and needed for
accurate color reproduction of all
images.
JNCD is a Just Noticeable Color Difference.
White Point accuracy is more critical than
other colors.
See Figure 1
for the plotted White Points.
See Figure 2 for the
definition of JNCD.
|
|
Color Gamut
Measured in the dark at 0 lux
See Figure 1
|
102 percent
DCI-P3
Cinema Gamut
Very Close
to Standard
Excellent
Accurate
Wide Gamut
See Figure 1
|
104 percent
sRGB /
Rec.709 Gamut
Very Close
to Standard
Excellent
Accurate
Standard Gamut
See Figure 1
|
Most current consumer content uses sRGB /
Rec.709.
The new 4K UHD TVs and Digital Cinema use
DCI-P3.
A Wide Color Gamut is useful in High
Ambient Light
and for some applications. It can be used
with Color
Management to dynamically change the
Gamut.
See Figure 1
|
|
Color Gamut in Ambient Light
Measured at 1,000 lux
Display Brightness set at Maximum
1,000 lux corresponds to
very bright indoor lighting or
outdoor daylight with an
overcast sky.
|
at 1,000
lux
90 percent
DCI-P3
Cinema Gamut
Very Good
See
Figure 1
|
at 1,000
lux
91 percent
sRGB /
Rec.709 Gamut
Very Good
See
Figure 1
|
The visible on-screen Color Gamut
decreases
as the Ambient Light level increases.
The Ambient Light level is measured in
lux.
The Gamut Depends on both the Display
Brightness
and the Screen Reflectance.
See
Figure 1
|
|
Absolute Color Accuracy
|
|
Absolute Color Accuracy
Average Color Error at 0 lux
For 41 Reference Colors
Just Noticeable Color Difference
See Figure 2
|
Average
Color Error
From
DCI-P3
Δ(u’v’)
= 0.0019
0.5 JNCD
Excellent
Accuracy
Accurate
DCI-P3 Content
See Figure 2
|
Average
Color Error
From sRGB
/ Rec.709
Δ(u’v’)
= 0.0020
0.5 JNCD
Excellent
Accuracy
Accurate
sRGB Content
See Figure 2
|
JNCD is a Just Noticeable Color Difference.
See Figure 2 for the
definition of JNCD and for
Accuracy Plots showing
the measured Color Errors.
Color Errors below 2.0 JNCD are
Excellent
Color Errors below 3.5 JNCD are Very
Good.
Color Errors 3.5 to 7.0 JNCD are
Good.
Color Errors above 7.0 JNCD are
Poor.
|
|
Absolute Color Accuracy
Maximum Color Error at 0 lux
For 41 Reference Colors
Just Noticeable Color Difference
See Figure 2
|
Largest Color Error
From
DCI-P3
Δ(u’v’)
= 0.0071
1.8 JNCD
for 100%
Blue
Excellent
Accuracy
Accurate
DCI-P3 Content
See Figure 2
|
Largest Color Error
From sRGB
/ Rec.709
Δ(u’v’)
= 0.0072
1.8 JNCD
for 100%
Blue
Excellent
Accuracy
Accurate
sRGB Content
See Figure 2
|
JNCD is a Just Noticeable Color Difference.
See Figure 2 for the
definition of JNCD and for
Accuracy Plots showing
the measured Color Errors.
Color Errors below 2.0 JNCD are
Excellent
Color Errors below 3.5 JNCD are Very
Good.
Color Errors 3.5 to 7.0 JNCD are
Good.
Color Errors above 7.0 JNCD are
Poor.
|
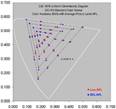
Shifts in Absolute Color Accuracy with Average Picture Level APL
Measured Shifts in the Absolute Color
Accuracy with Image Content from Low 1% APL to High 50% APL
|
|
Shift in the Color of White
Just Noticeable Color Difference
See Figure 4
|
White Point
Color Shift
from Low
to High APL
Δ(u’v’)
= 0.0014
0.3 JNCD
Excellent
See Figure 4
|
White Point
Color Shift
from Low
to High APL
Δ(u’v’)
= 0.0013
0.3 JNCD
Excellent
See Figure 4
|
JNCD is a Just Noticeable Color Difference
See Figure 2 for the
definition of JNCD.
See Figure 4 for the
measured Color Shifts.
Color Shifts below 2.0 JNCD are
Excellent
Color Shifts below 3.5 JNCD are Very
Good.
Color Shifts 3.5 to 7.0 JNCD are
Good.
Color Shifts above 7.0 JNCD are
Poor.
|
|
Average Color Shift
For 41 Reference Colors
Just Noticeable Color Difference
See Figure 4
|
Average
Color Shift
from Low
to High APL
Δ(u’v’)
= 0.0013
0.3 JNCD
Excellent
See Figure 4
|
Average
Color Shift
from Low
to High APL
Δ(u’v’)
= 0.0014
0.3 JNCD
Excellent
See Figure 4
|
JNCD is a Just Noticeable Color Difference.
See Figure 2 for the
definition of JNCD.
See Figure 4 for the
measured Color Shifts.
Color Shifts below 2.0 JNCD are
Excellent
Color Shifts below 3.5 JNCD are Very
Good.
Color Shifts 3.5 to 7.0 JNCD are
Good.
Color Shifts above 7.0 JNCD are
Poor.
|
|
Maximum Color Shift
For 41 Reference Colors
Just Noticeable Color Difference
See Figure 4
|
Largest Color Shift
from Low
to High APL
Δ(u’v’)
= 0.0036
0.9 JNCD
for 100%
Cyan-Blue
Excellent
See Figure 4
|
Largest Color Shift
from Low
to High APL
Δ(u’v’)
= 0.0030
0.8 JNCD
for 100%
Cyan-Blue
Excellent
See Figure 4
|
JNCD is a Just Noticeable Color Difference
See Figure 2 for the
definition of JNCD.
See Figure 4 for the
measured Color Shifts.
Color Shifts below 2.0 JNCD are Excellent
Color Shifts below 3.5 JNCD are Very
Good.
Color Shifts 3.5 to 7.0 JNCD are
Good.
Color Shifts above 7.0 JNCD are
Poor.
|
|
Intensity Scale and Image Contrast Accuracy
|
|
Dynamic Brightness
Change in Luminance with
Average Picture Level
|
1 percent
Decrease
Excellent
|
1 percent
Decrease
Excellent
|
This is the percent Brightness decrease
with APL,
Average Picture Level. Ideally should be
0 percent.
|
|
Intensity Scale and
Image Contrast
See Figure 3
|
Very
Smooth and Straight
Excellent
Very
Accurate
See Figure 3
|
Very
Smooth and Straight
Excellent
Very
Accurate
See Figure 3
|
The Intensity Scale controls image
contrast needed
for accurate Image Contrast and Color
reproduction.
See Figure 3
|
|
Gamma for the Intensity Scale
Larger has more Image Contrast
See Figure 3
|
Gamma 2.22
Excellent
Gamma Very
Accurate
|
Gamma 2.22
Excellent
Gamma Very
Accurate
|
Gamma is the log slope of the Intensity
Scale.
Gamma of 2.20 is the standard and needed
for
accurate Image Contrast and Color
reproduction.
See Figure 3
|
|
Image Contrast Accuracy
|
Excellent
|
Excellent
|
See Figure 3
|
|
Viewing Angles
The variation of
Brightness, Contrast, and Color with Viewing Angle is especially important
for Smartphones because
of their larger screen
and multiple viewers. The typical manufacturer 176+ degree specification for
LCD Viewing Angle
is nonsense because that
is where the Contrast Ratio falls to a miniscule 10. For most LCDs there are
substantial
degradations at less
than ±30 degrees, which is not an atypical Viewing Angle for Smartphones and
Tablets.
The
Viewing Angle variations are essentially identical for both of the Color
Gamut Modes.
Note
that the Viewing Angle performance is also very important for a single viewer
because the Viewing Angle can vary
significantly
based on how the Smartphone is held. The Viewing Angle can be very large if resting
on a table or desk.
· The iPhone 14 Pro Max display has a Brightness
(Luminance) fall off with Viewing Angle that is much smaller than the best
LCD displays.
Color Shifts:
· The White Point Color Shift is the most viewer noticeable
Color Shift with Viewing Angle because it is often the screen background.
The 14 Pro Max has a White Shift of 1.5 JNCD at 30 degrees, which is unlikely to be
noticeable.
·
The Color Shifts throughout the entire Color
Gamut vary as combinations of the Primary Color Shifts.
· The Color Shift for the Red
Primary at 30 degrees Viewing Angle is 3.6
JNCD, slightly greater than the 3.5 JNCD
limit for a
Green
Very Good Rating.
·
The Color Shift for the Green Primary at 30
degrees Viewing Angle is 3.7 JNCD, slightly greater than the 3.5 JNCD limit for a
Green
Very Good Rating.
·
The Color Shift for the Blue Primary at 30
degrees Viewing Angle is 4.6 JNCD, somewhat greater than the 3.5 JNCD limit for a
Green
Very Good Rating. But Color Shifts in the
Blue Region are less visually noticeable as discussed in this article
Most
current model OLED Smartphone Displays have 1 or 2 Primary Color Shift Yellow
ratings.
|
Categories
|
Wide
Gamut
DCI-P3
Content
|
Standard
Gamut
sRGB /
Rec.709 Content
|
Comments
|
|
Brightness Decrease
at a 30 degree Viewing Angle
|
25 percent
Decrease
Small
Decrease
Very Good
|
Most screens become less bright when
tilted.
OLED decrease is due to optical
absorption.
LCD decrease is generally greater than 50
percent.
|
|
Contrast Ratio at 0 lux
at a 30 degree Viewing Angle
|
Infinite
Contrast Ratio
Outstanding
|
A measure of screen readability when the
screen
is tilted under low ambient lighting.
|
|
White Point Color Shift
at a 30 degree Viewing Angle
|
Small Color
Shift
Δ(u’v’)
= 0.0059 Shift
1.5 JNCD Excellent
|
JNCD is a Just Noticeable Color Difference.
See Figure 2 for the
definition of JNCD.
Color Shifts below 2.0 JNCD are
Excellent
|
|
Color Shifts for the Primaries
|
|
Red Primary Color Shift
at a 30 degree Viewing Angle
|
Medium
Color Shift
Δ(u’v’)
= 0.0142
3.6 JNCD
Good
|
JNCD is a Just Noticeable Color Difference.
See Figure 2 for the
definition of JNCD.
Color Shifts 3.5 to 7.0 JNCD are
Good.
|
|
Green Primary Color Shift
at a 30 degree Viewing Angle
|
Medium
Color Shift
Δ(u’v’)
= 0.0150
3.7 JNCD
Good
|
JNCD is a Just Noticeable Color Difference.
See Figure 2 for the
definition of JNCD.
Color Shifts 3.5 to 7.0 JNCD are
Good.
|
|
Blue Primary Color Shift
at a 30 degree Viewing Angle
|
Medium
Color Shift
Δ(u’v’)
= 0.0182
4.6 JNCD
Good
|
JNCD is a Just Noticeable Color Difference.
See Figure 2 for the
definition of JNCD.
Color Shifts 3.5 to 7.0 JNCD are
Good.
|
|
|
|
Color Shifts for Color Mixtures
at a 30 degree Viewing Angle
Reference Brown (255, 128, 0)
|
Small
Color Shift
Δ(u’v’)
= 0.0053
1.3 JNCD
Excellent
|
JNCD is a Just Noticeable Color Difference.
Color Shifts for non-IPS LCDs are about 10
JNCD.
Reference Brown is a good indicator of
color shifts
with angle because of unequal drive
levels and
roughly equal luminance contributions
from Red
and Green. See Figure 2 for the
definition of JNCD.
|
|
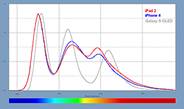
Display Spectra
The Display Spectra for the iPhone 14
Pro Max including the Night Shift mode are measured in Figure 5 below.
The Night Shift
mode is designed to change the color balance of the display in order to
reduce the amount of Blue Light
produced by the display,
which some recent research indicates can affect how well users sleep
afterwards.
The
White Point can Shift down to a Warm 2,700 K White Point.
The measured display
spectra for several of the Night Shift settings
are included in Figure 5b.
|
About the Author
Dr. Raymond Soneira is
President of DisplayMate Technologies Corporation of Amherst, New Hampshire,
which produces display calibration, evaluation, and diagnostic products for
consumers, technicians, and manufacturers. See www.displaymate.com. He is
a research scientist with a career that spans physics, computer science, and
television system design. Dr. Soneira obtained his Ph.D. in Theoretical Physics
from Princeton University, spent 5 years as a Long-Term Member of the world
famous Institute for Advanced Study in Princeton, another 5 years as a
Principal Investigator in the Computer Systems Research Laboratory at AT&T
Bell Laboratories, and has also designed, tested, and installed color
television broadcast equipment for the CBS Television Network Engineering and
Development Department. He has authored over 35 research articles in scientific
journals in physics and computer science, including Scientific American. If you
have any comments or questions about the article, you can contact him at dtso.info@displaymate.com.
DisplayMate Display Optimization Technology
All
Smartphone, Tablet, Monitor and TV displays can be significantly improved using
DisplayMate’s proprietary very advanced scientific analysis and mathematical display
modeling and optimization of the display hardware, factory calibration, and
driver parameters. We help manufacturers with expert display procurement,
prototype development, display performance improvement and optimization,
testing displays to meet contract specifications, and production quality
control so that they don’t make mistakes similar to those that are exposed in
our public Display Technology Shoot-Out series for consumers. This article is a
lite version of our advanced scientific analysis – before the benefits of our DisplayMate Display Optimization
Technology, which can correct or improve all of these issues. If you are a
display or product manufacturer and want to significantly improve display
performance for a competitive advantage then Contact DisplayMate
Technologies.
About DisplayMate Technologies
DisplayMate Technologies specializes in proprietary advanced
scientific display calibration and mathematical display optimization to deliver
unsurpassed objective performance, picture quality and accuracy for all types
of displays including video and computer monitors, projectors, TVs, mobile
displays such as Smartphones and Tablets, and all display technologies
including LCD, OLED, 3D, LED, LCoS, Plasma, DLP and CRT. This article is a lite version of
our intensive scientific analysis of Smartphone and Smartphone mobile displays
– before the benefits of our advanced mathematical DisplayMate Display Optimization
Technology, which can correct or improve many of the display deficiencies. We offer DisplayMate display
calibration software for consumers and advanced DisplayMate display diagnostic
and calibration software for technicians and test labs.
For
manufacturers we offer Consulting Services that include advanced Lab testing
and evaluations, confidential Shoot-Outs with competing products, calibration
and optimization for displays, cameras and their User Interface, plus on-site
and factory visits. We help manufacturers with expert display procurement,
prototype development, and production quality control so they don’t make
mistakes similar to those that are exposed in our Display Technology Shoot-Out
series. See our world renown Display
Technology Shoot-Out public article series for an introduction and preview.
DisplayMate’s
advanced scientific optimizations can make lower cost panels look as good or
better than more expensive higher performance displays. If you are a display or
product manufacturer and want to turn your display into a spectacular one to
surpass your competition then Contact
DisplayMate Technologies to learn more.
Article Links: Apple
iPhone 13 Pro Max OLED Display Technology Shoot-Out
Article Links: Display
Color Gamuts Shoot-Out NTSC to Rec.2020
Article Links: Absolute
Color Accuracy Display Technology Shoot-Out
Article Links: Watching
Displays at Night
Article Links: Display Technology Shoot-Out
Article Series Overview and Home Page
Copyright © 1990-2022 by DisplayMate
Technologies Corporation. All Rights Reserved.
This article, or any part
thereof, may not be copied, reproduced, mirrored, distributed or incorporated
into any other work without
the prior written permission of DisplayMate Technologies Corporation