The Intensity Scale (sometimes called the Gray Scale) not only controls the Image Contrast within all displayed images but it also controls how the Red, Green and Blue primary colors mix to produce all of the on-screen colors. The steeper the Intensity Scale the greater the on-screen image contrast and the higher the saturation of all displayed color mixtures.
Intensity Scale Accuracy
So if the Intensity Scale does not follow the Standard
that is used in all consumer content then the colors and intensities
will be inaccurate everywhere in all images.
In order to deliver accurate color and image contrast a display must closely
match the Standard Intensity Scale.
Figure 3
below shows the measured Intensity Scales for the
Galaxy Note20 Ultra alongside the industry standard Gamma of 2.2,
which is the straight black line.
Logarithmic Intensity Scale
Both the eye and the Intensity Scale Standard operate
on a logarithmic scale,
which is why the Intensity Scale must be plotted and evaluated
on a log scale as we have done below.
The linear scale plots that are published by many reviewers
are bogus and completely meaningless because
it is log ratios rather than linear differences
that matter to the eye for seeing accurate Image Contrast.
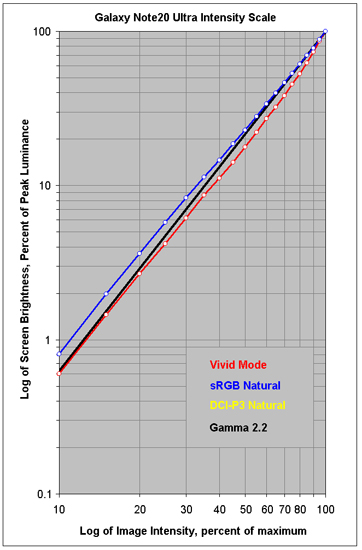
Figure 3a below shows the Intensity Scales for the sRGB, DCI-P3, and Vivid Modes. The sRGB and DCI-P3 Intensity Scales are idential and relatively straight and smooth, with a Gamma that is slightly smaller than the Standrd 2.20. The Vivid Mode Intensity Scale is Intentionally Steep and Variable.
Gamma is 2.12 for the sRGB and DCI-P3 Natural Modes and 2.49 for the Vivid Mode.
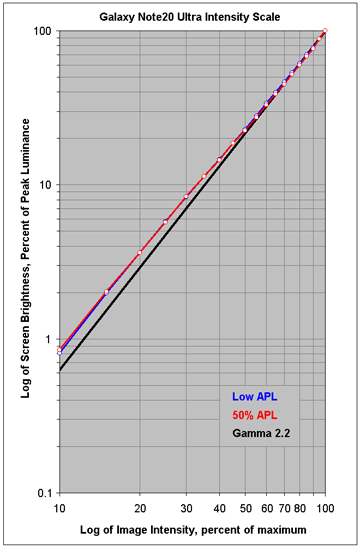
Variation of the Intensity Scales with Average Picture Level APL
Figure 3b
below shows the variation in the Intensity Scales between
Low APL and 50% APL for the sRGB and DCI-P3 Natural Modes.
For the sRGB and DCI-P3 Natural Modes there only a very small Shift in the Intensity Scales with APL, with the Gamma varying from 2.12 for Low APL to 2.16 for 50% APL. As a result, the Image Contrast appears unchanged with with changing APL, and we then expect the Absolute Color Accuracy to also have small variations with APL, which is examined in Figure 4.
For the Natural sRGB and DCI-P3 Modes the Gamma is 2.12 for Low APL and 2.16 for 50% APL.